| Research article |
|


|
|
|
| Spatiotemporal changes of typical glaciers and their responses to climate change in Xinjiang, Northwest China |
HUANG Xiaoran1,2, BAO Anming1,3,4,*( ), GUO Hao5, MENG Fanhao6, ZHANG Pengfei7, ZHENG Guoxiong1,2, YU Tao1,2, QI Peng8, Vincent NZABARINDA1,2, DU Weibing9 ), GUO Hao5, MENG Fanhao6, ZHANG Pengfei7, ZHENG Guoxiong1,2, YU Tao1,2, QI Peng8, Vincent NZABARINDA1,2, DU Weibing9 |
1State Key Laboratory of Desert and Oasis Ecology, Xinjiang Institute of Ecology and Geography, Chinese Academy of Sciences, Urumqi 830011, China
2University of Chinese Academy of Sciences, Beijing 100049, China
3Research Center for Ecology and Environment of Central Asia, Chinese Academy of Sciences, Urumqi 830011, China
4China-Pakistan Joint Research Center on Earth Sciences, Chinese Academy of Sciences and Higher Education Commission, Islamabad 45320, Pakistan
5School of Geography and Tourism, Qufu Normal University, Rizhao 276800, China
6College of Geographical Science, Inner Mongolia Normal University, Hohhot 010022, China
7Xuchang University, Xuchang 461000, China
8Key Laboratory of Wetland Ecology and Environment, Northeast Institute of Geography and Agroecology, Chinese Academy of Sciences, Changchun 130102, China
9School of Surveying and Land Information Engineering, Henan Polytechnic University, Jiaozuo 454000, China |
|
|
|
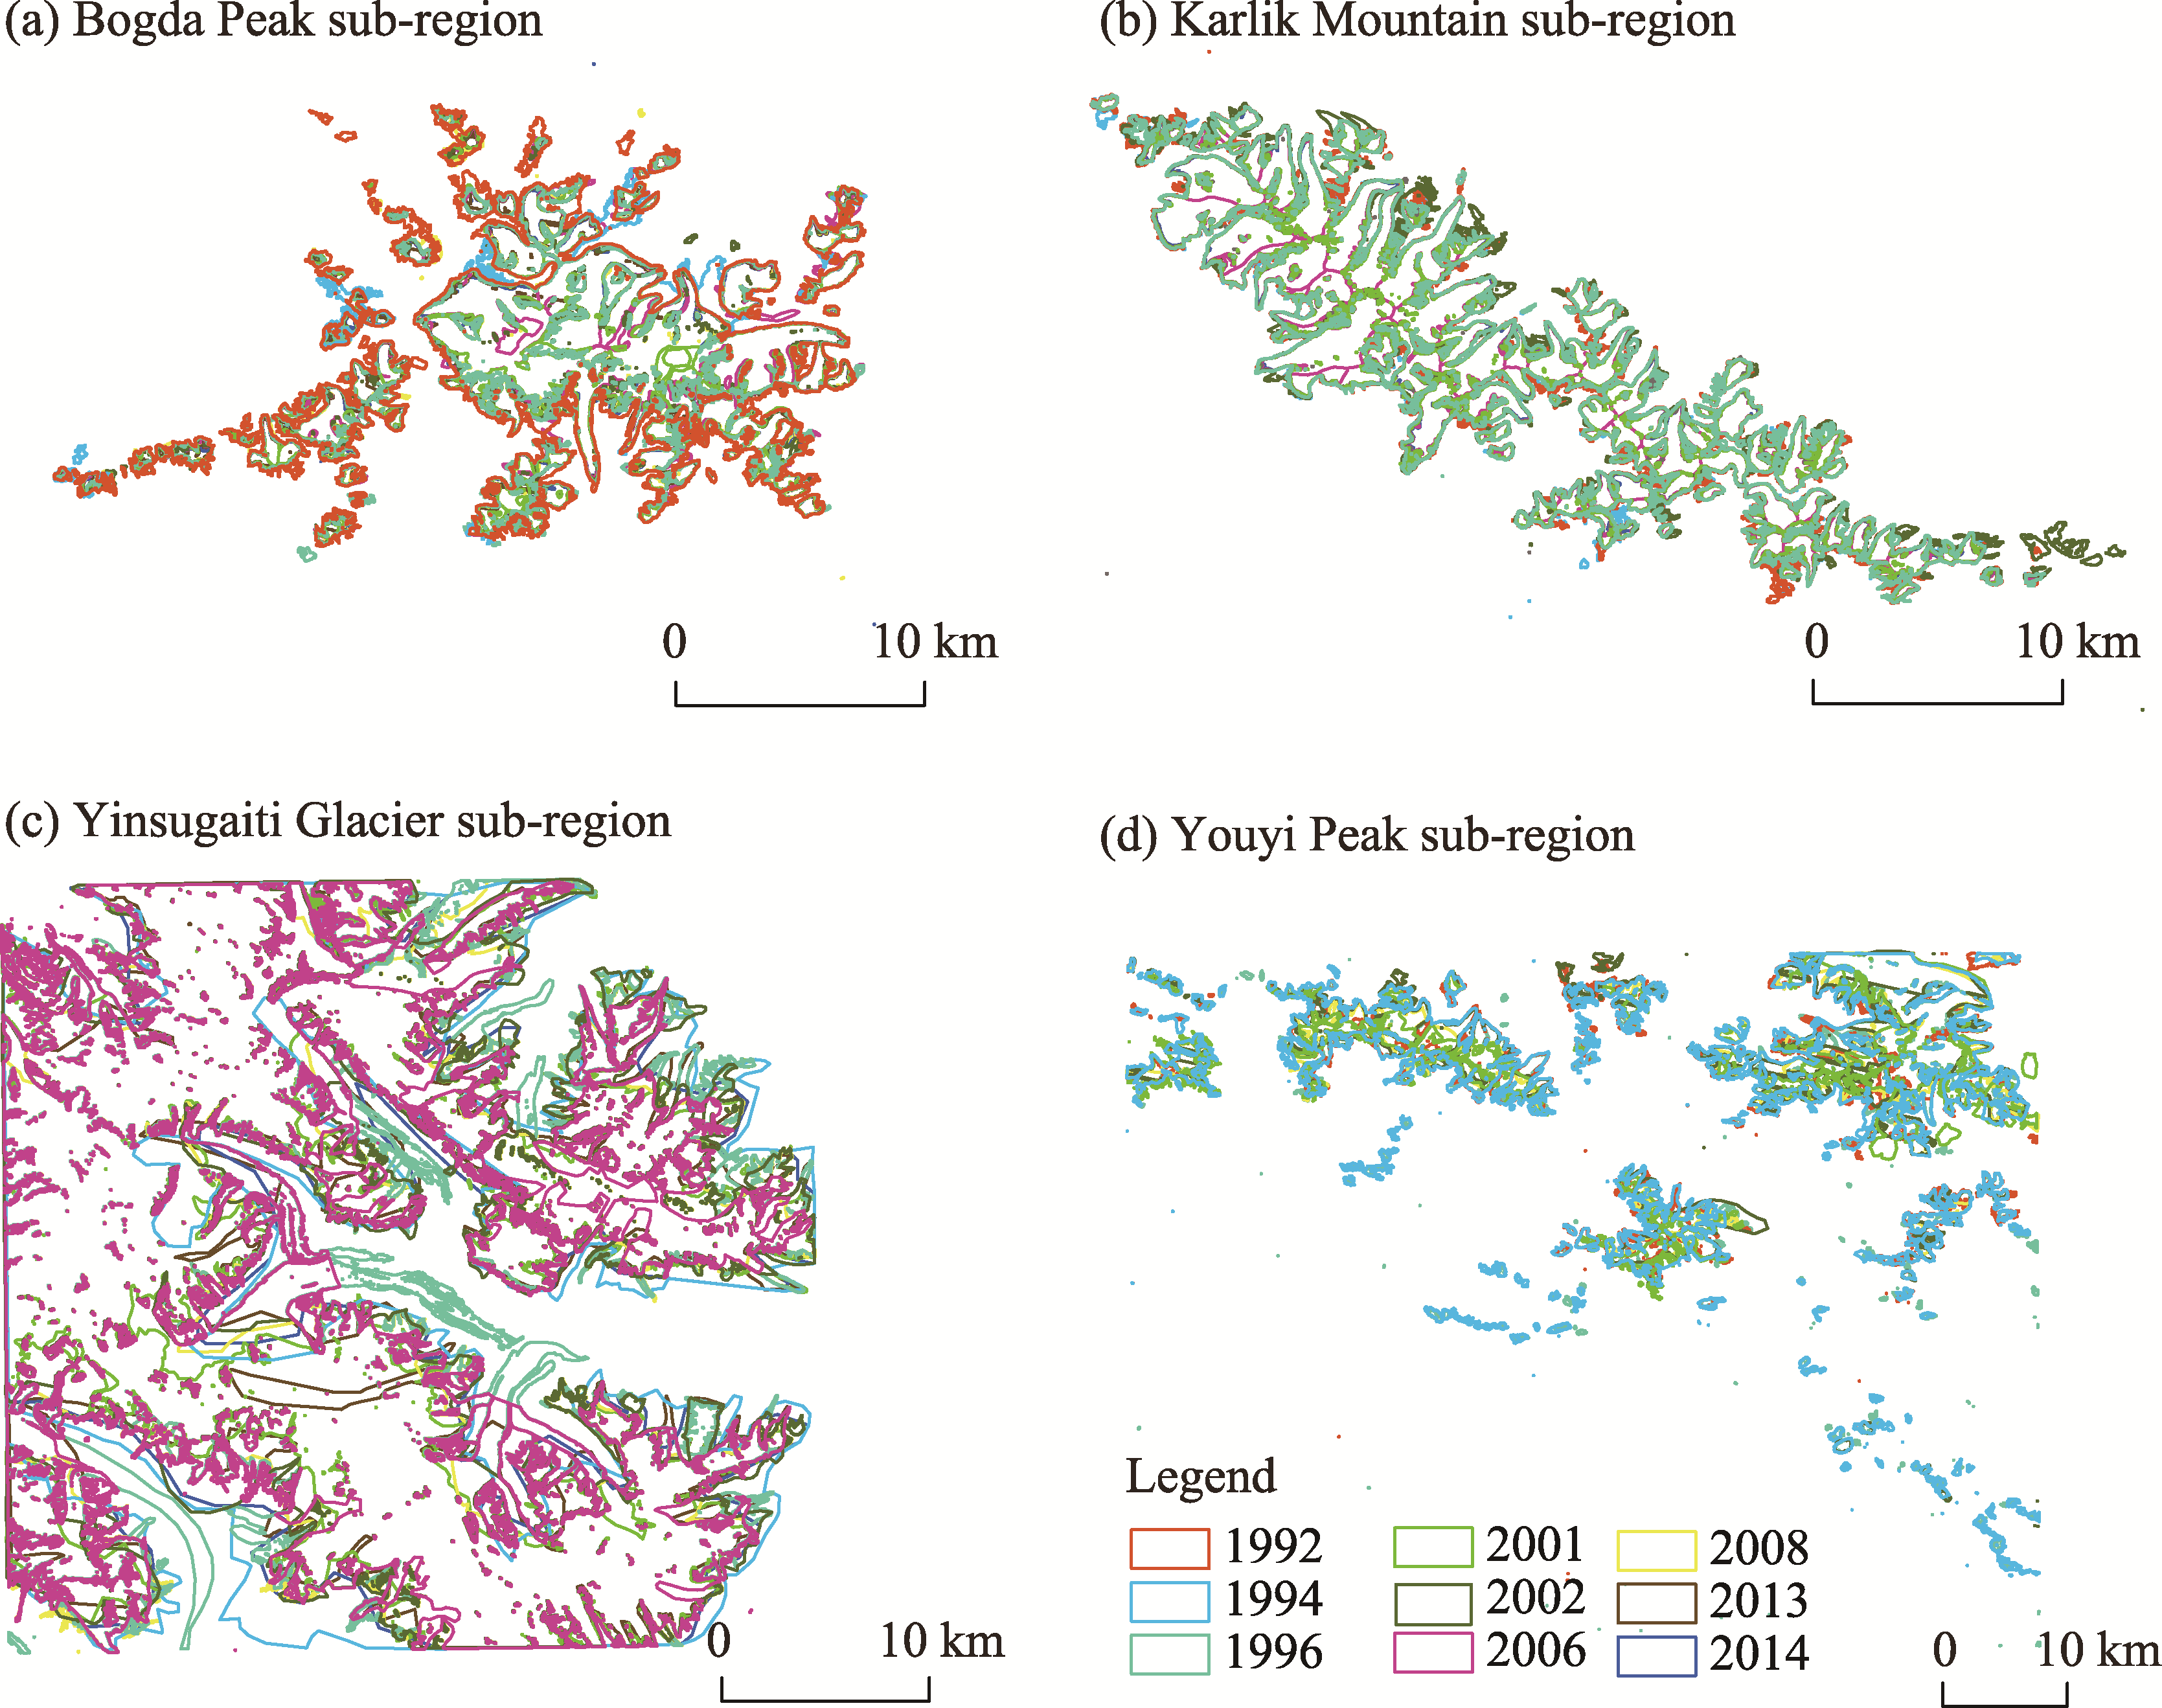
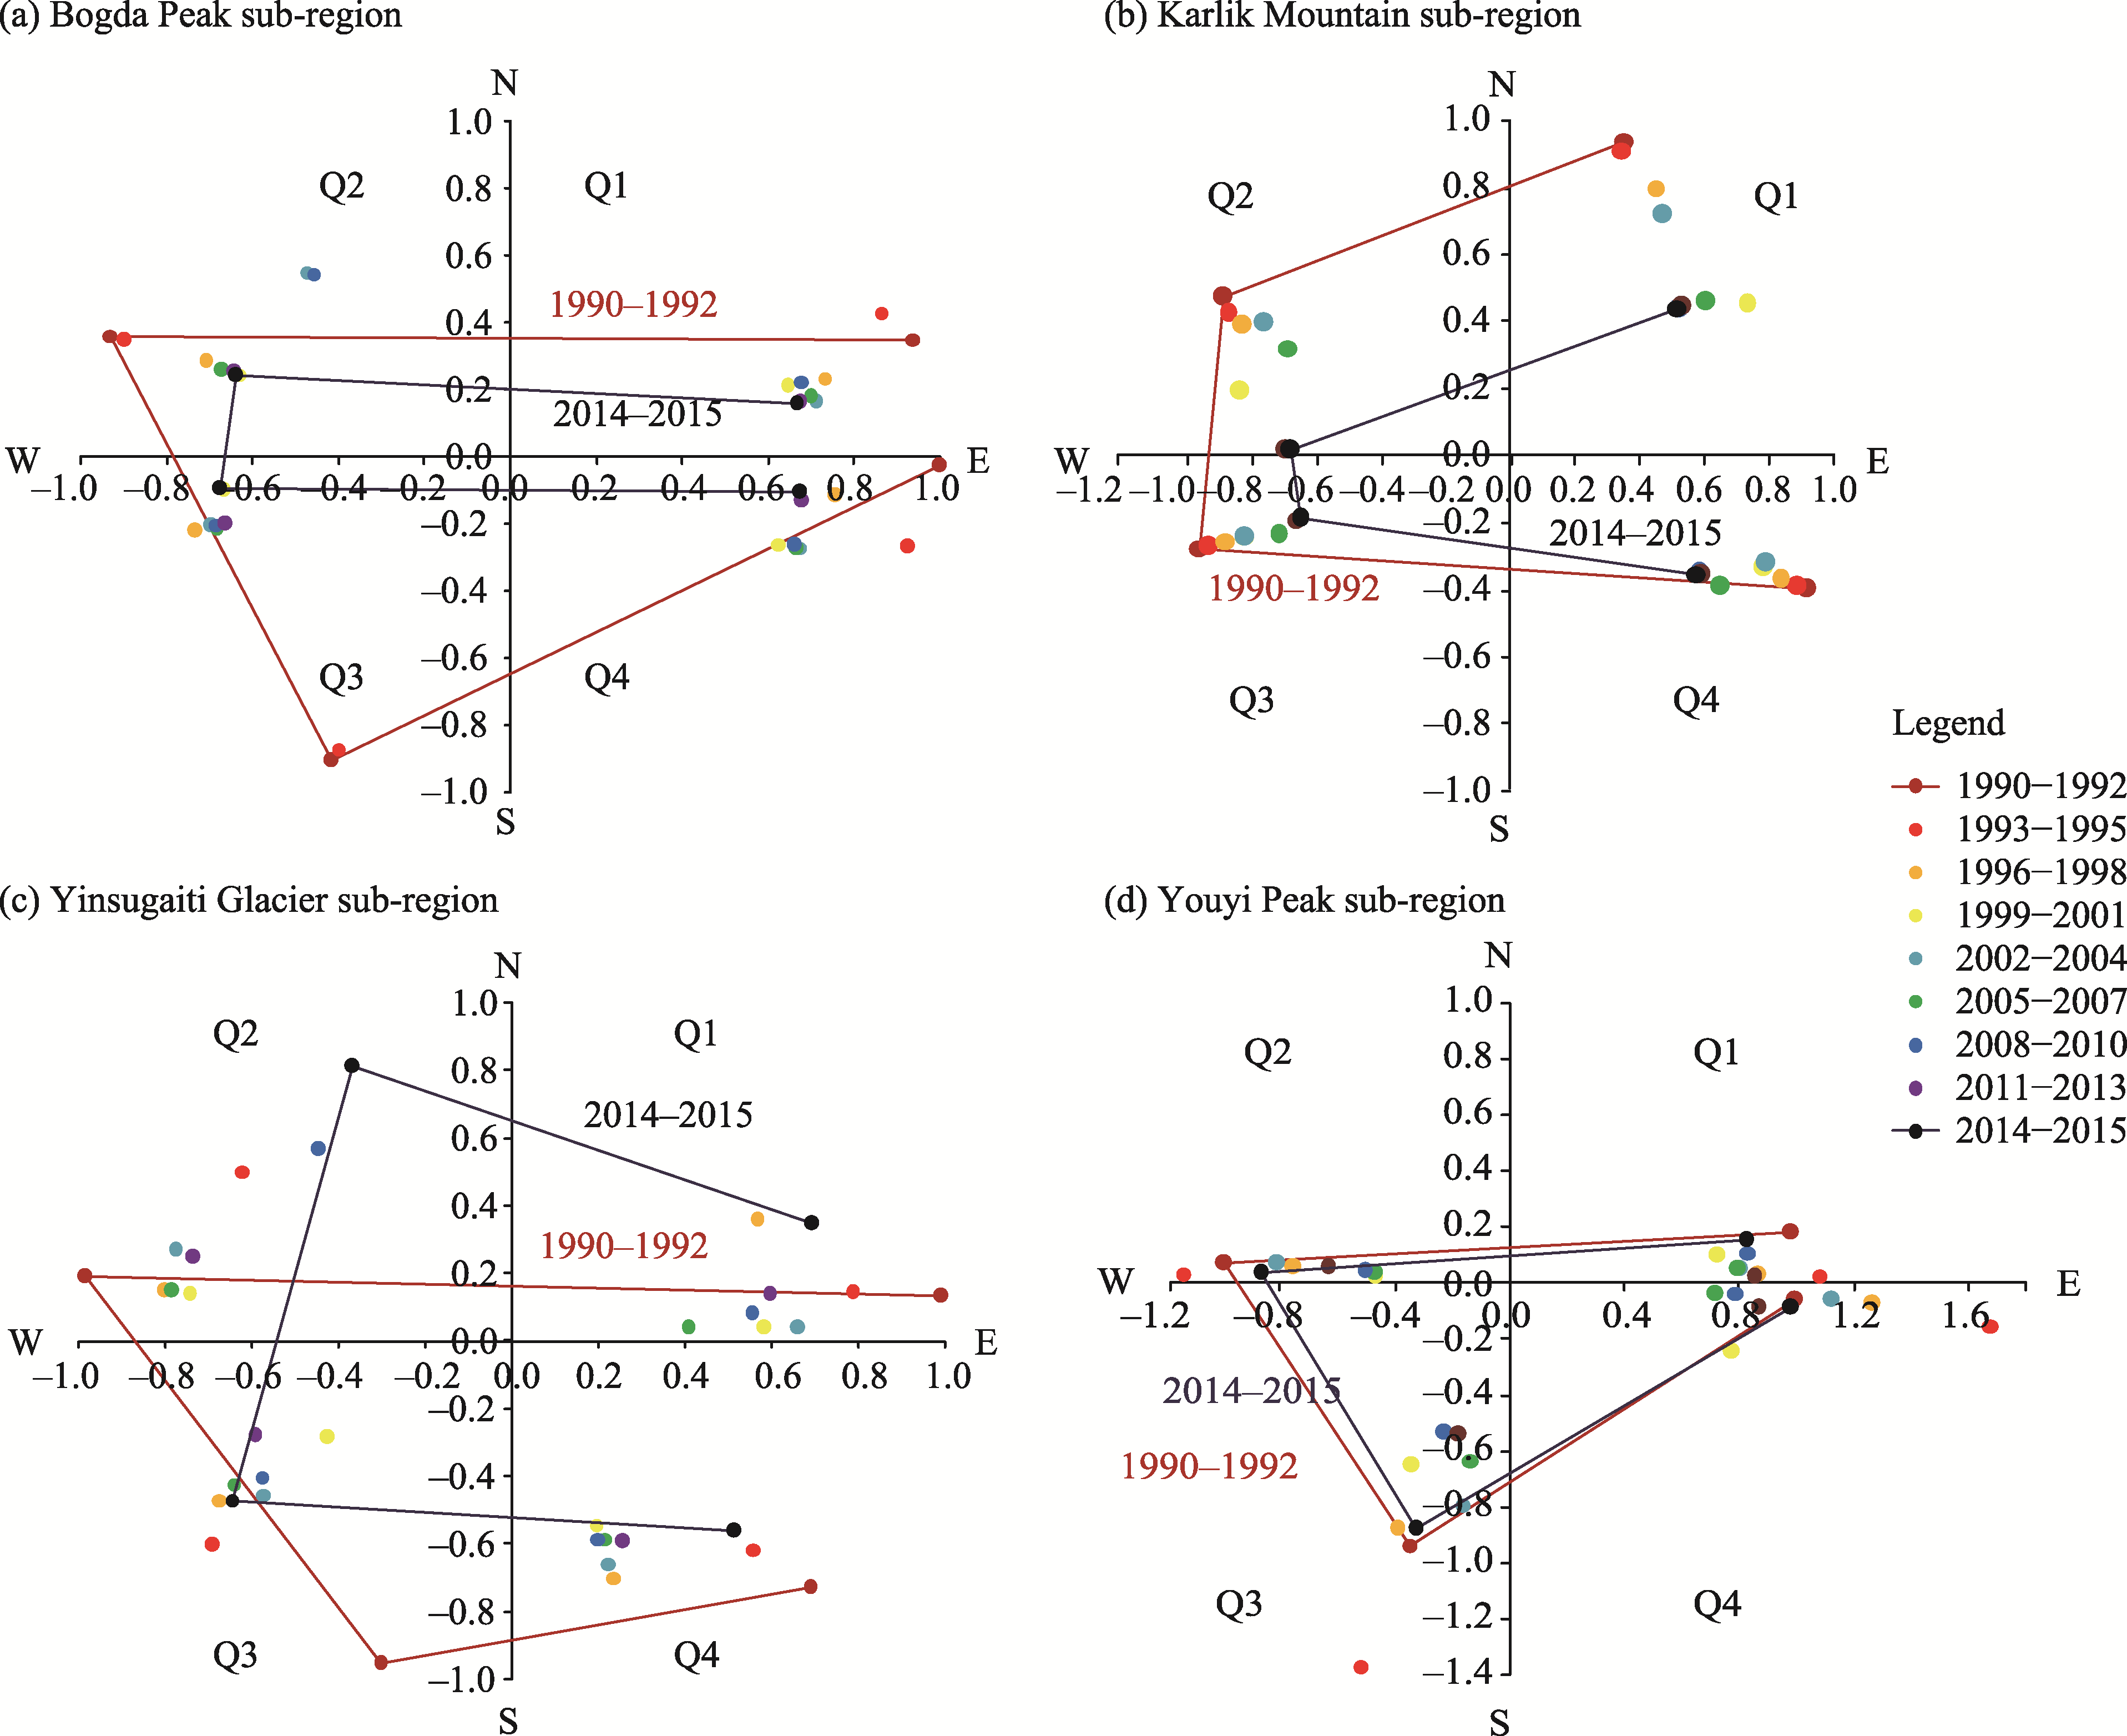
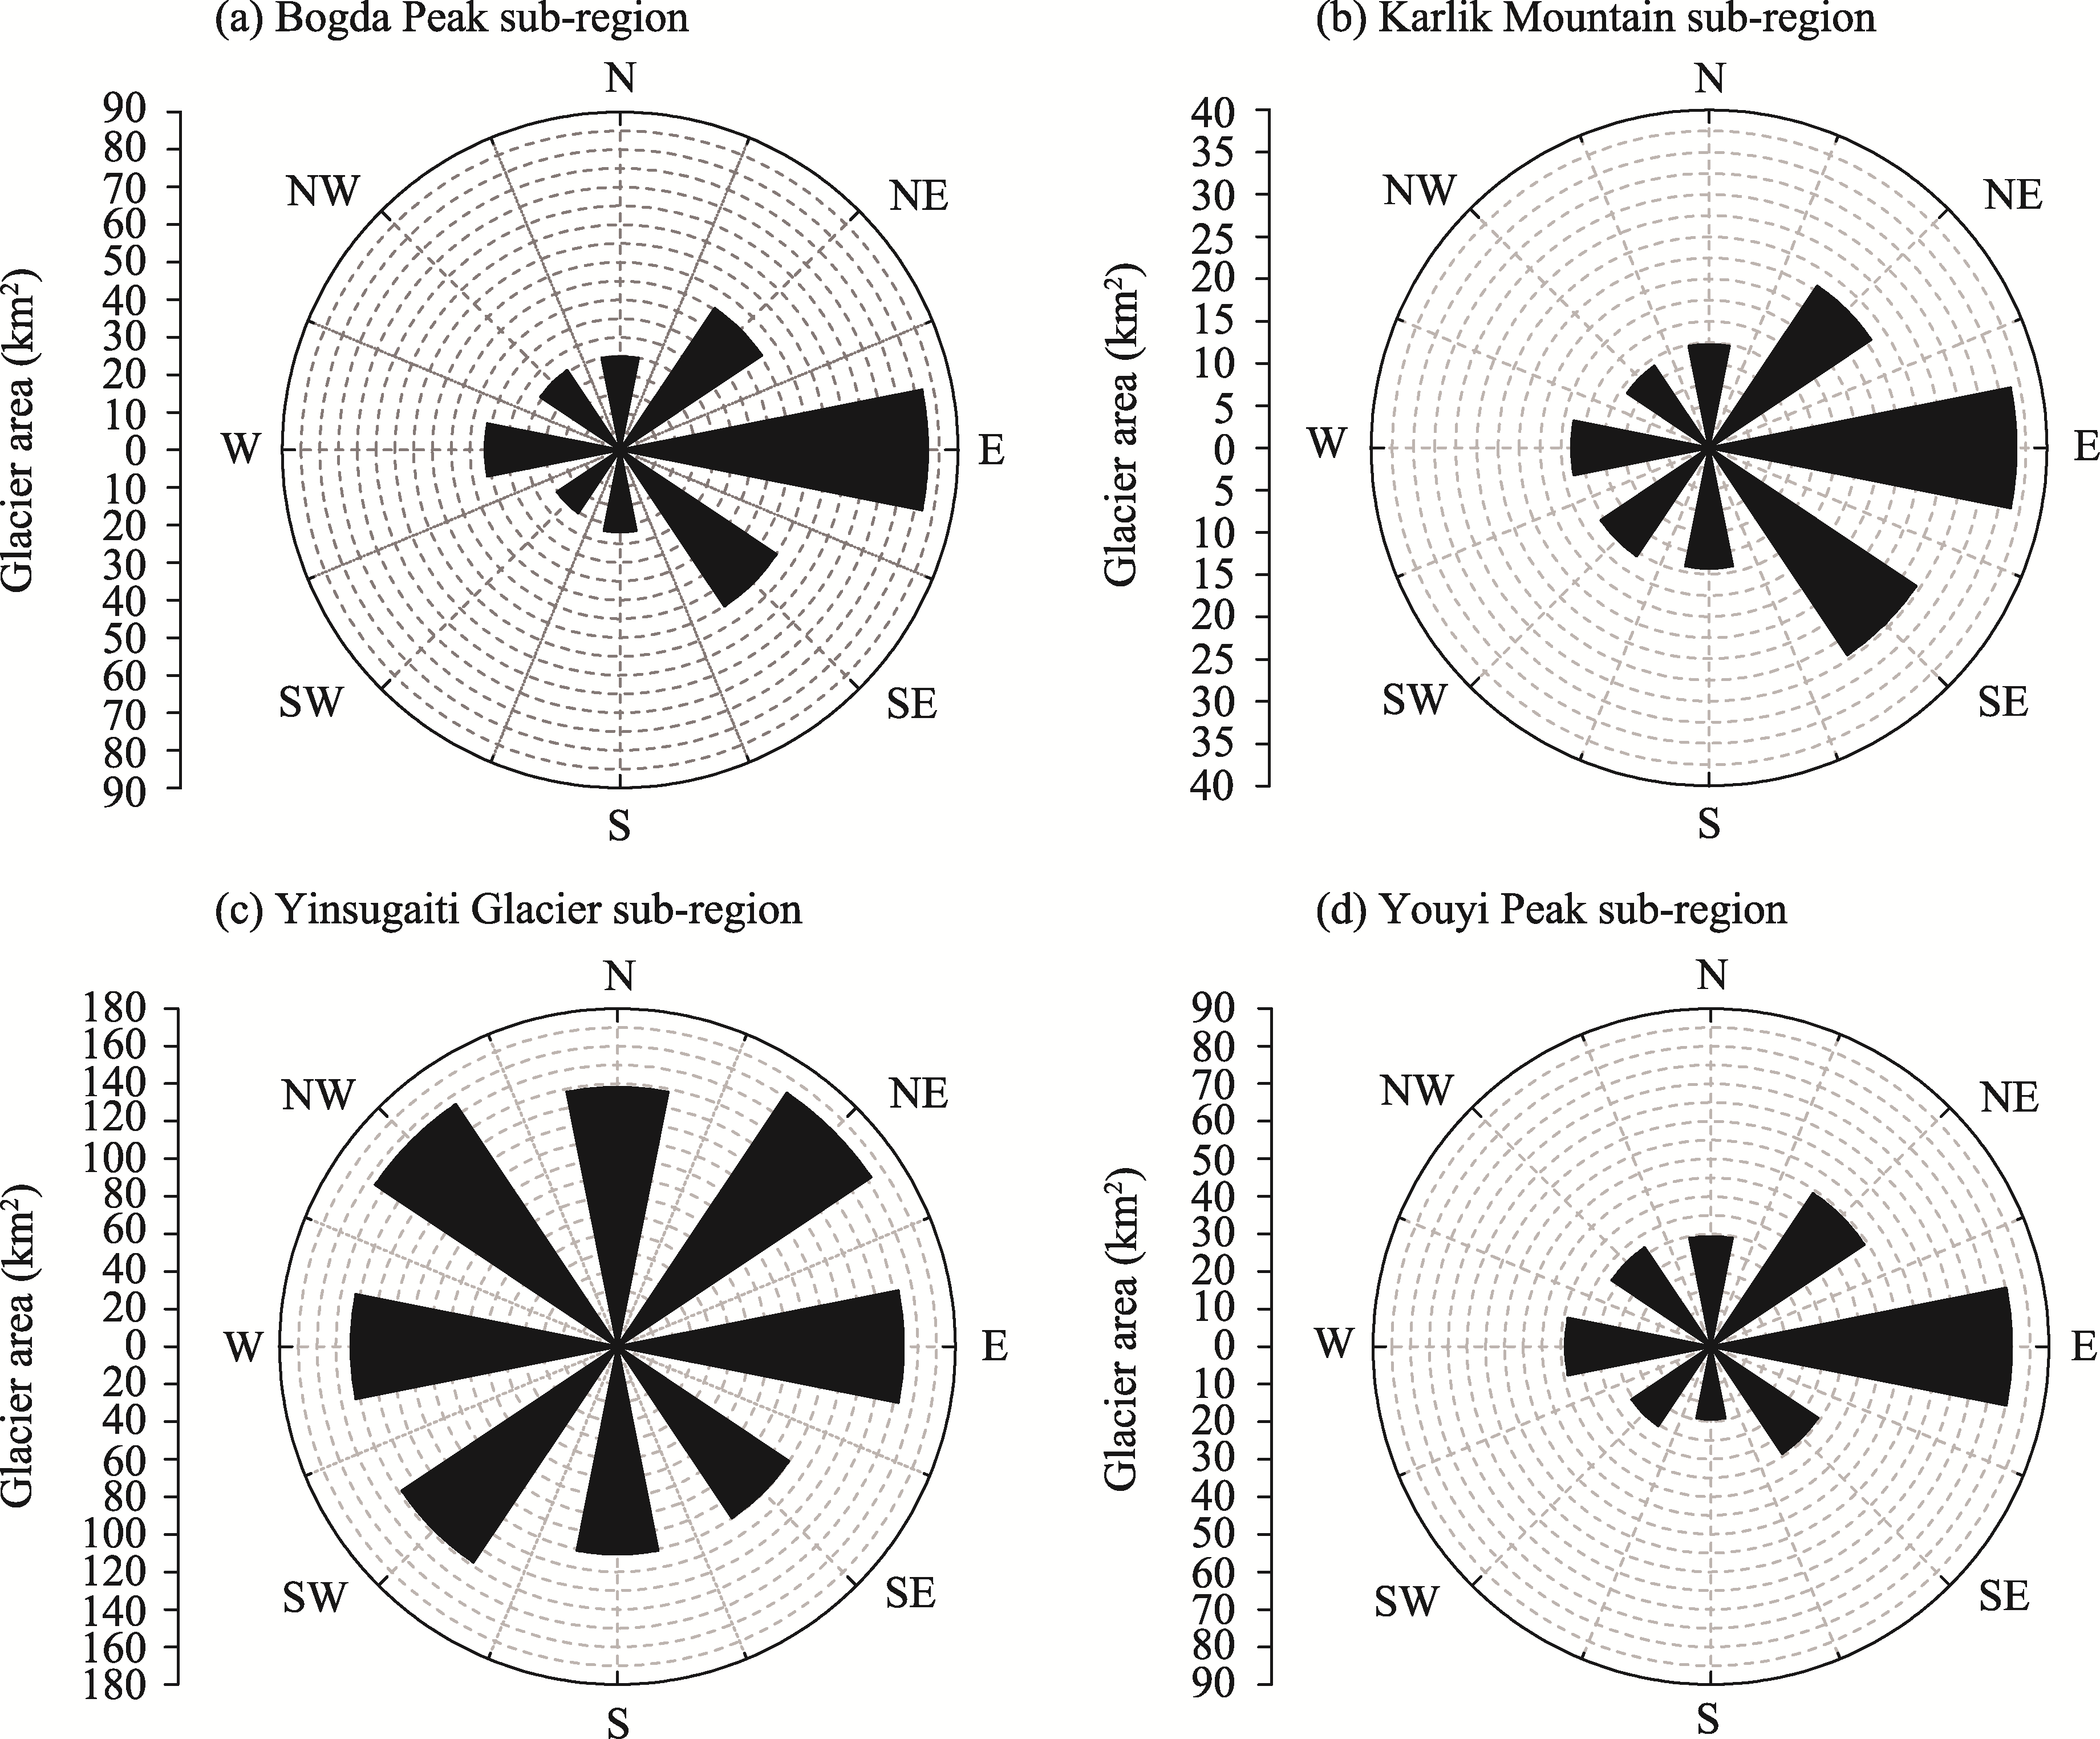
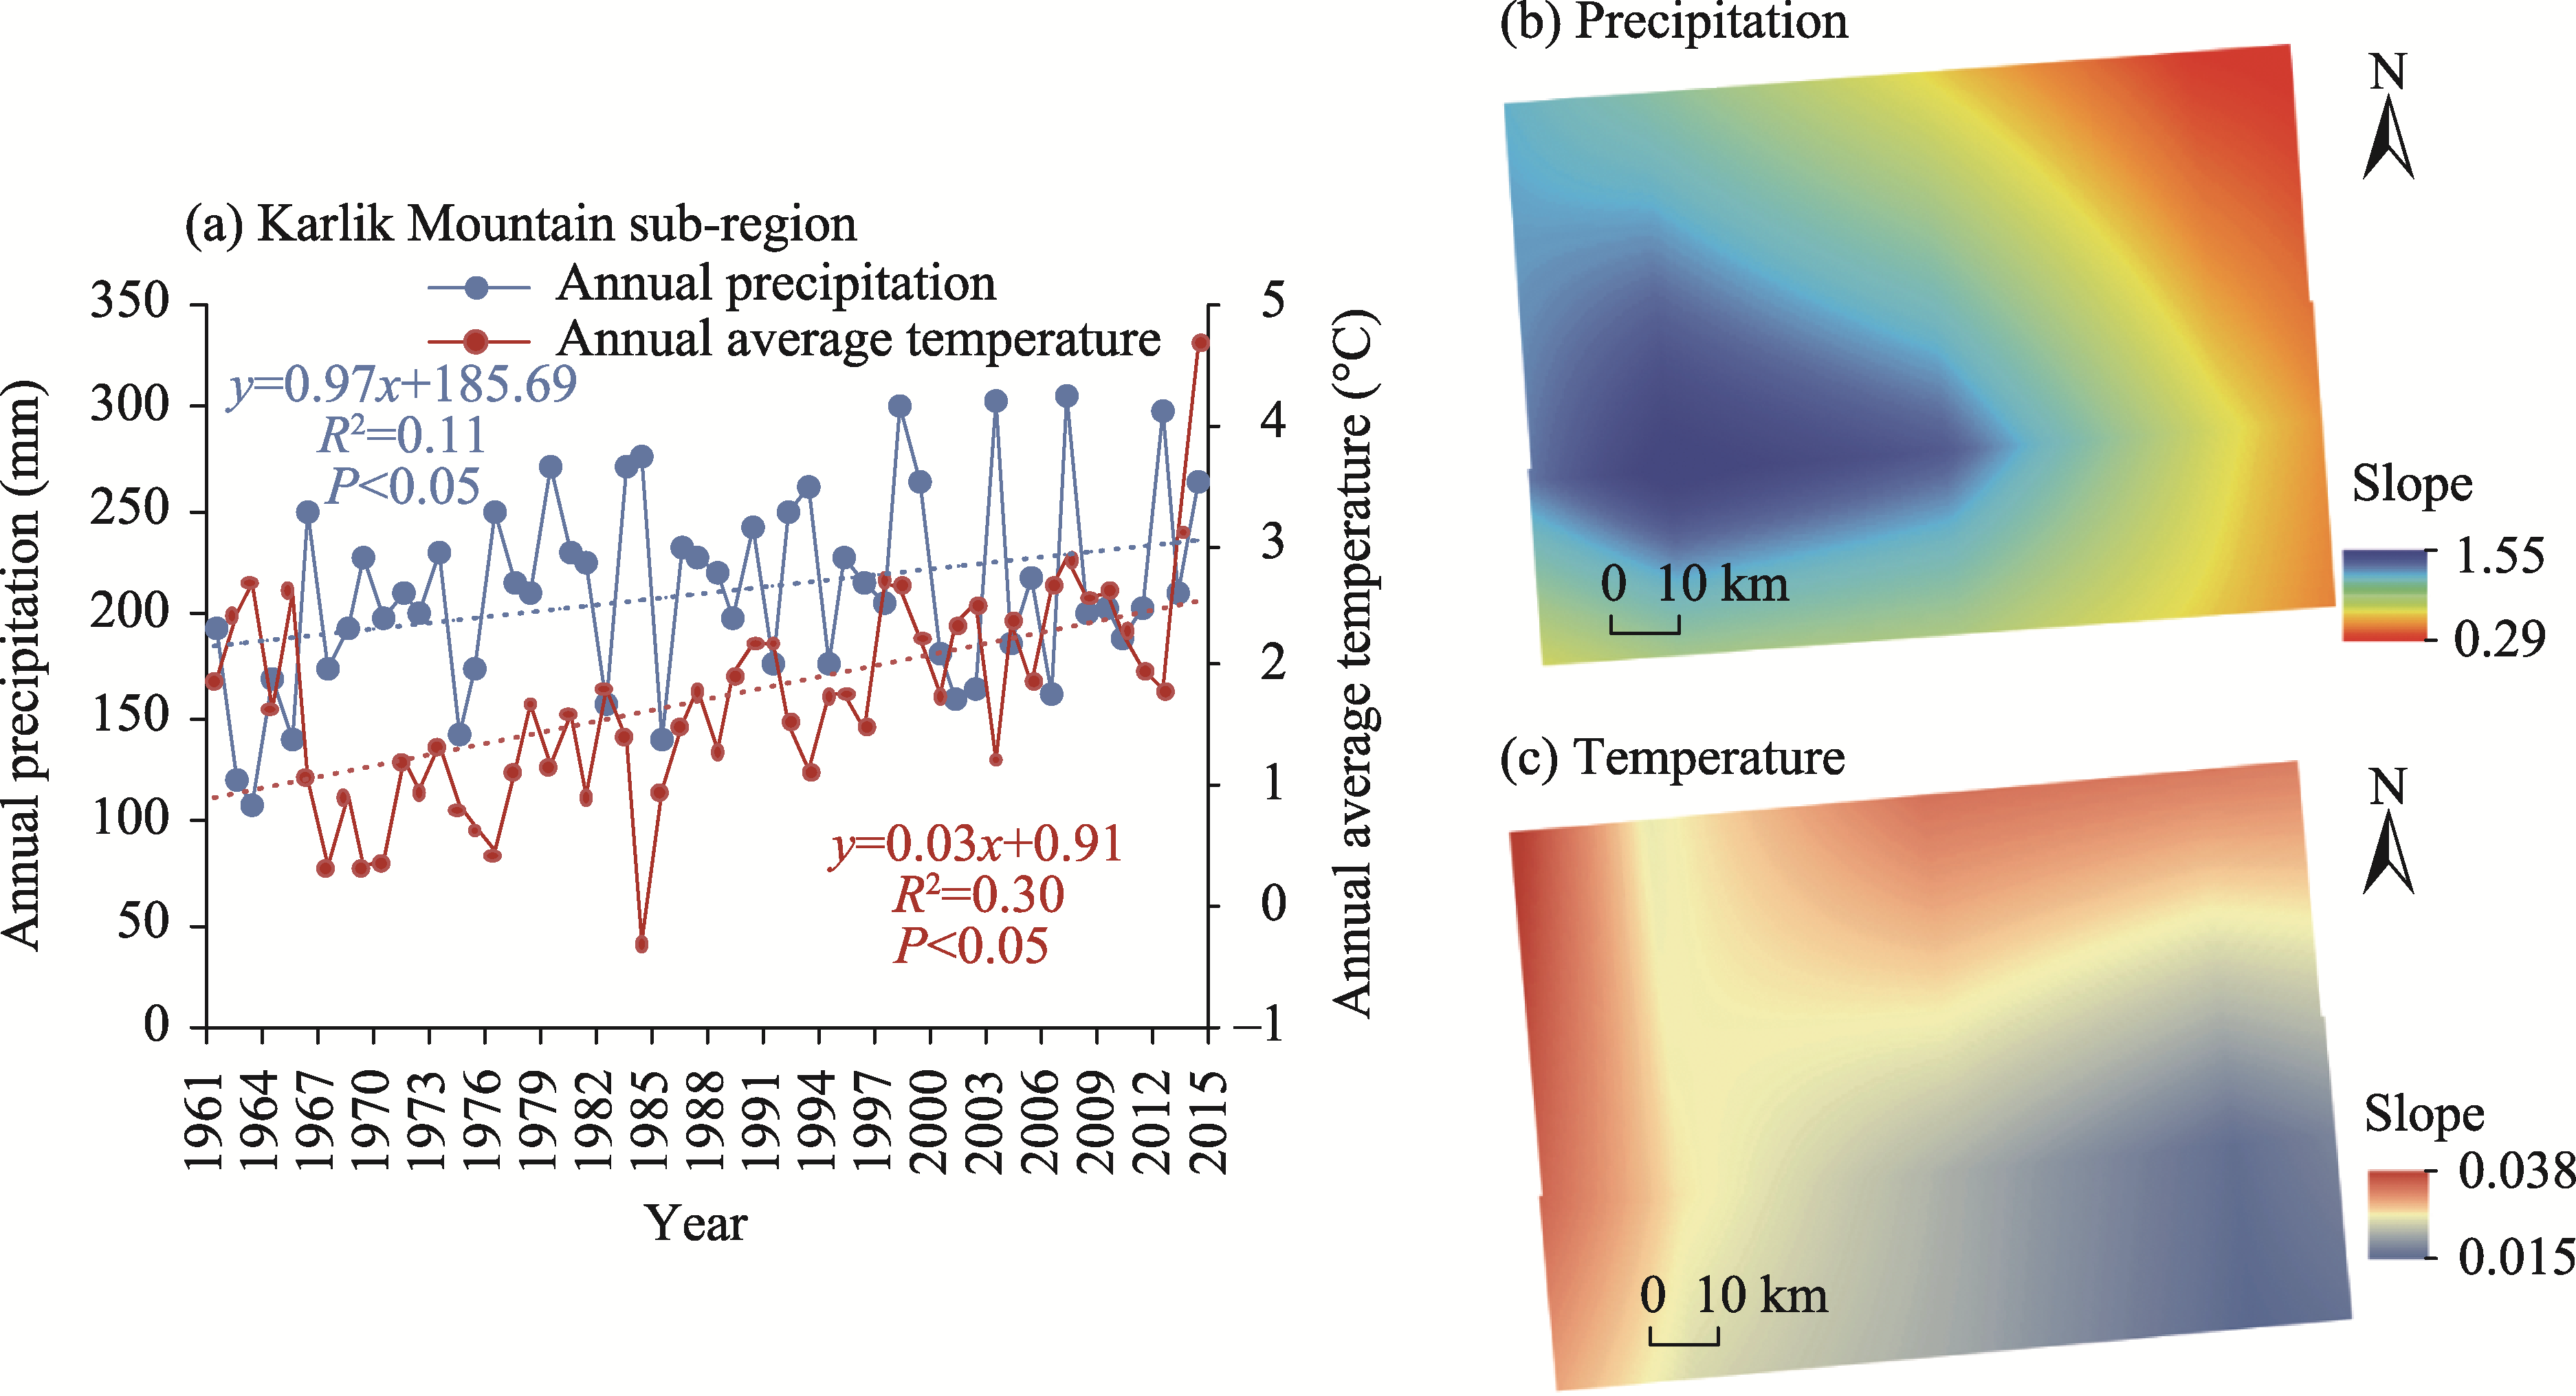
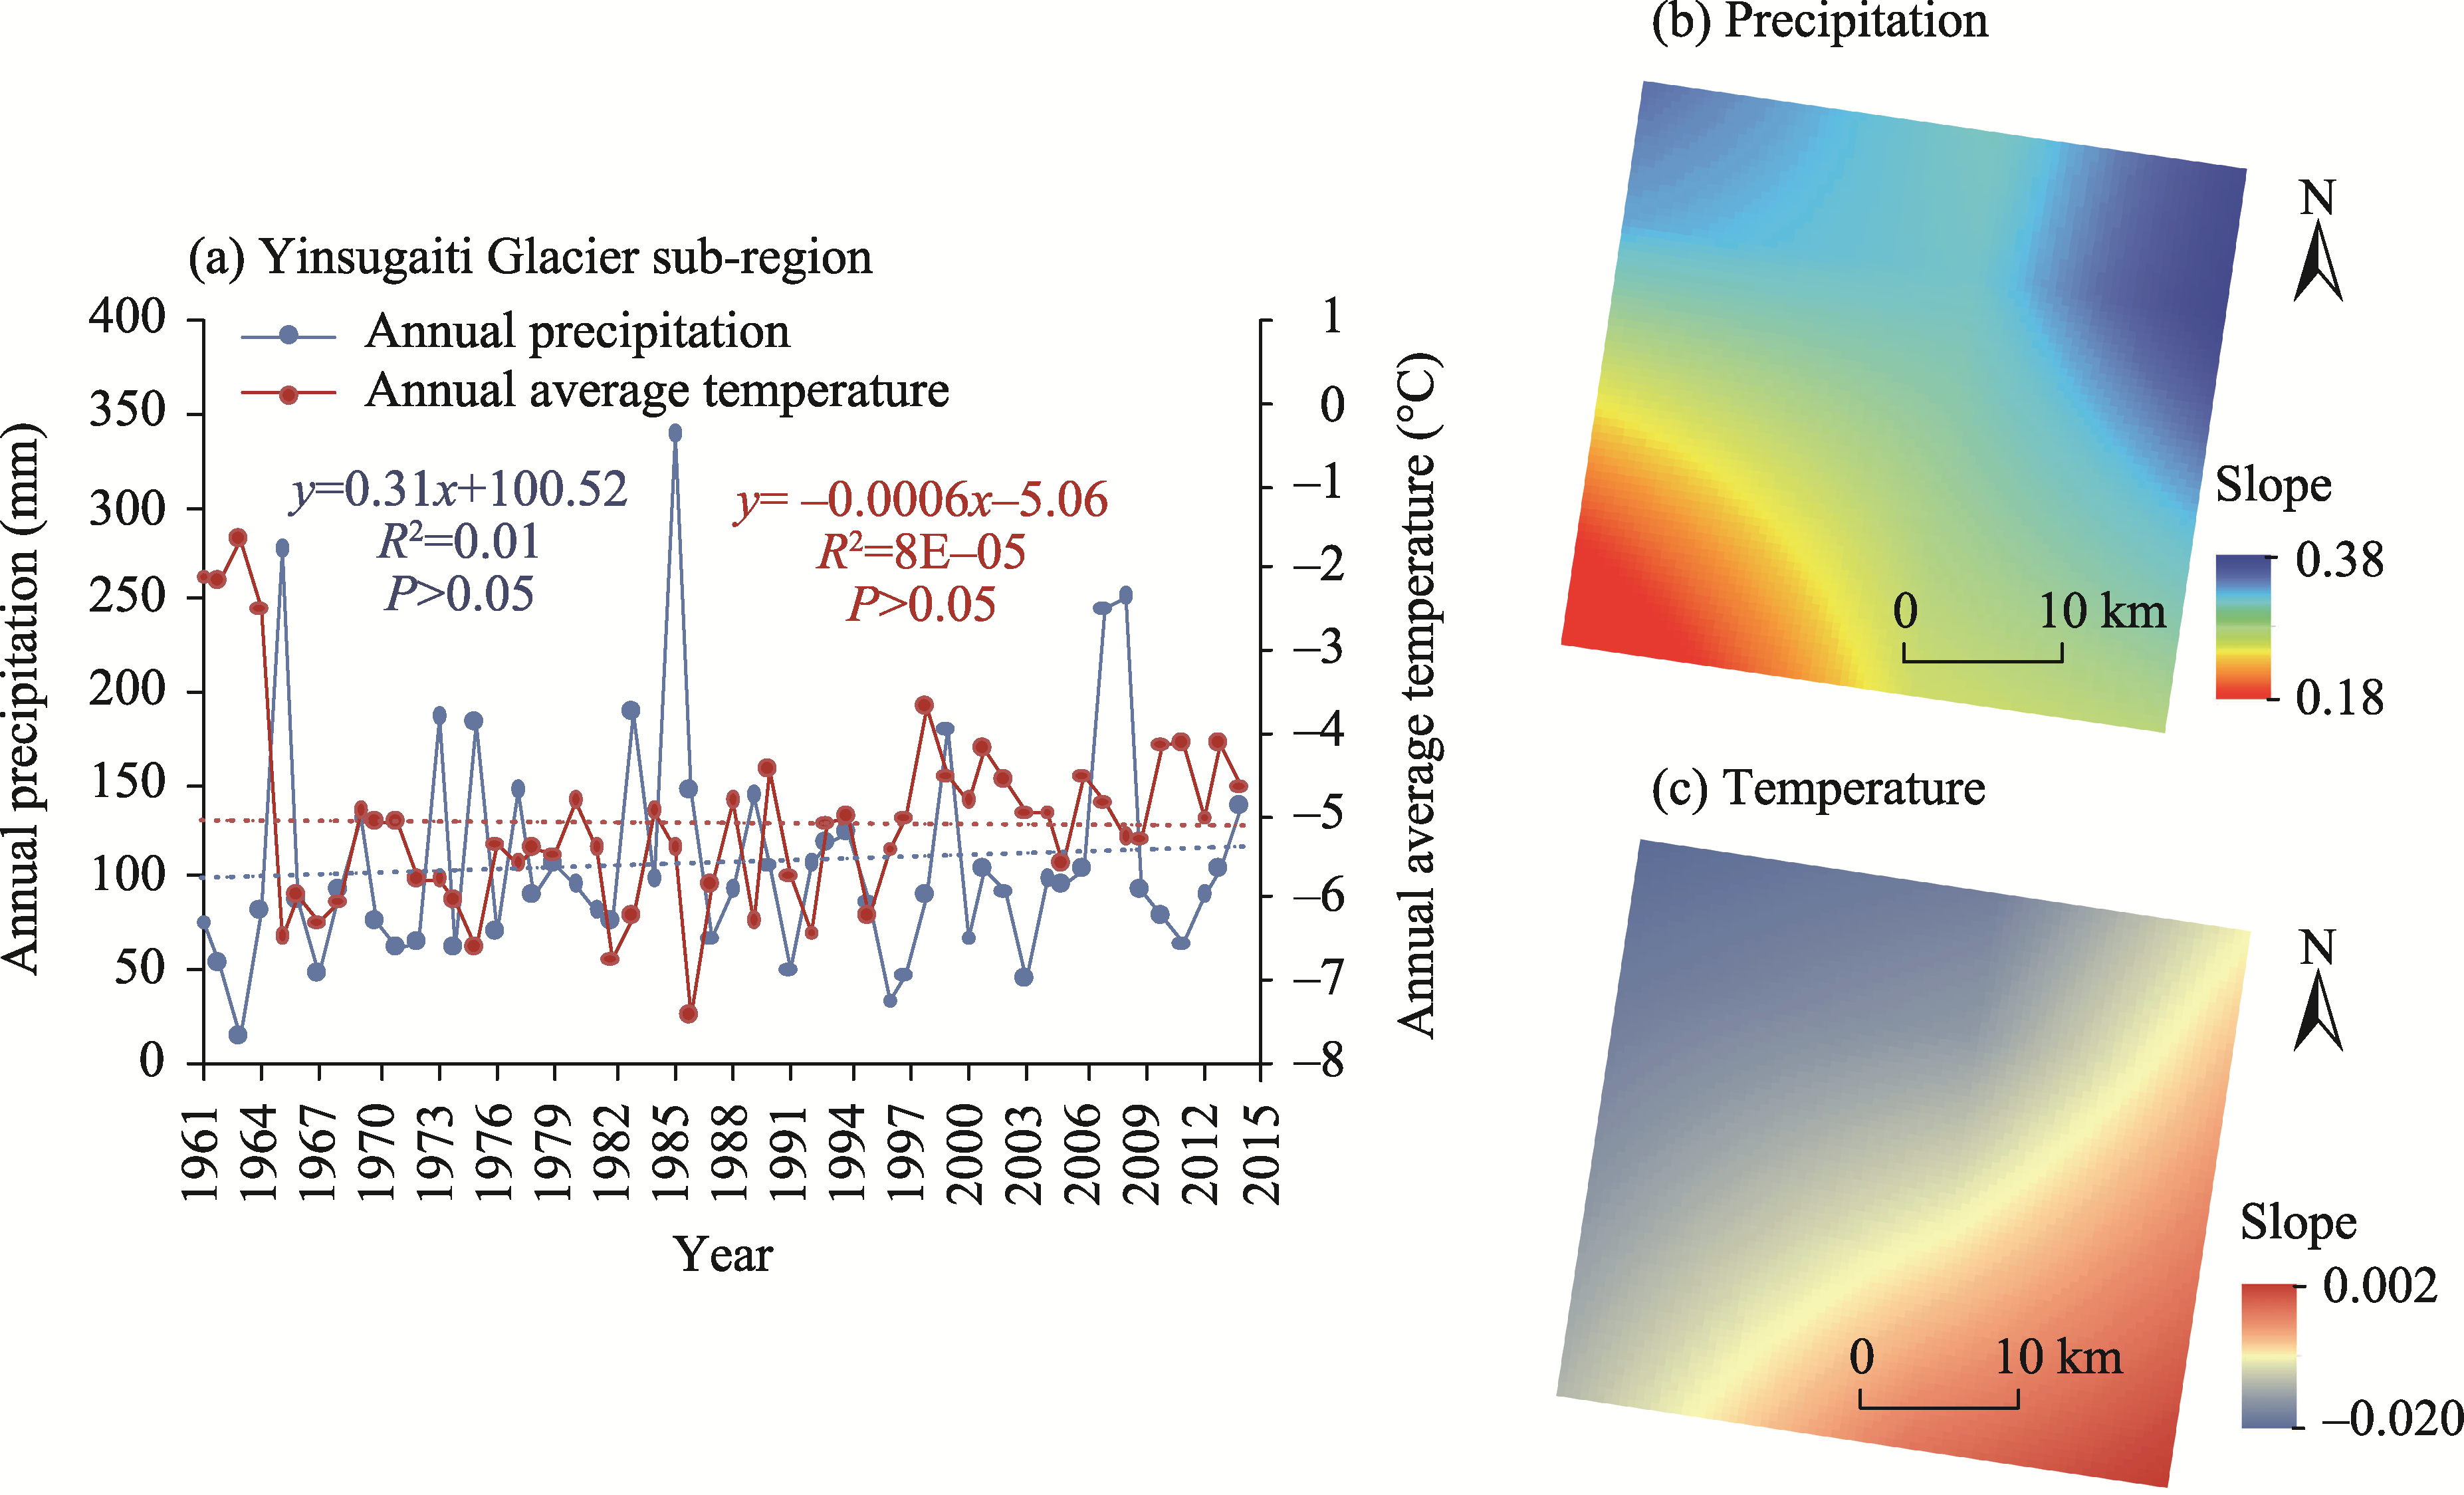
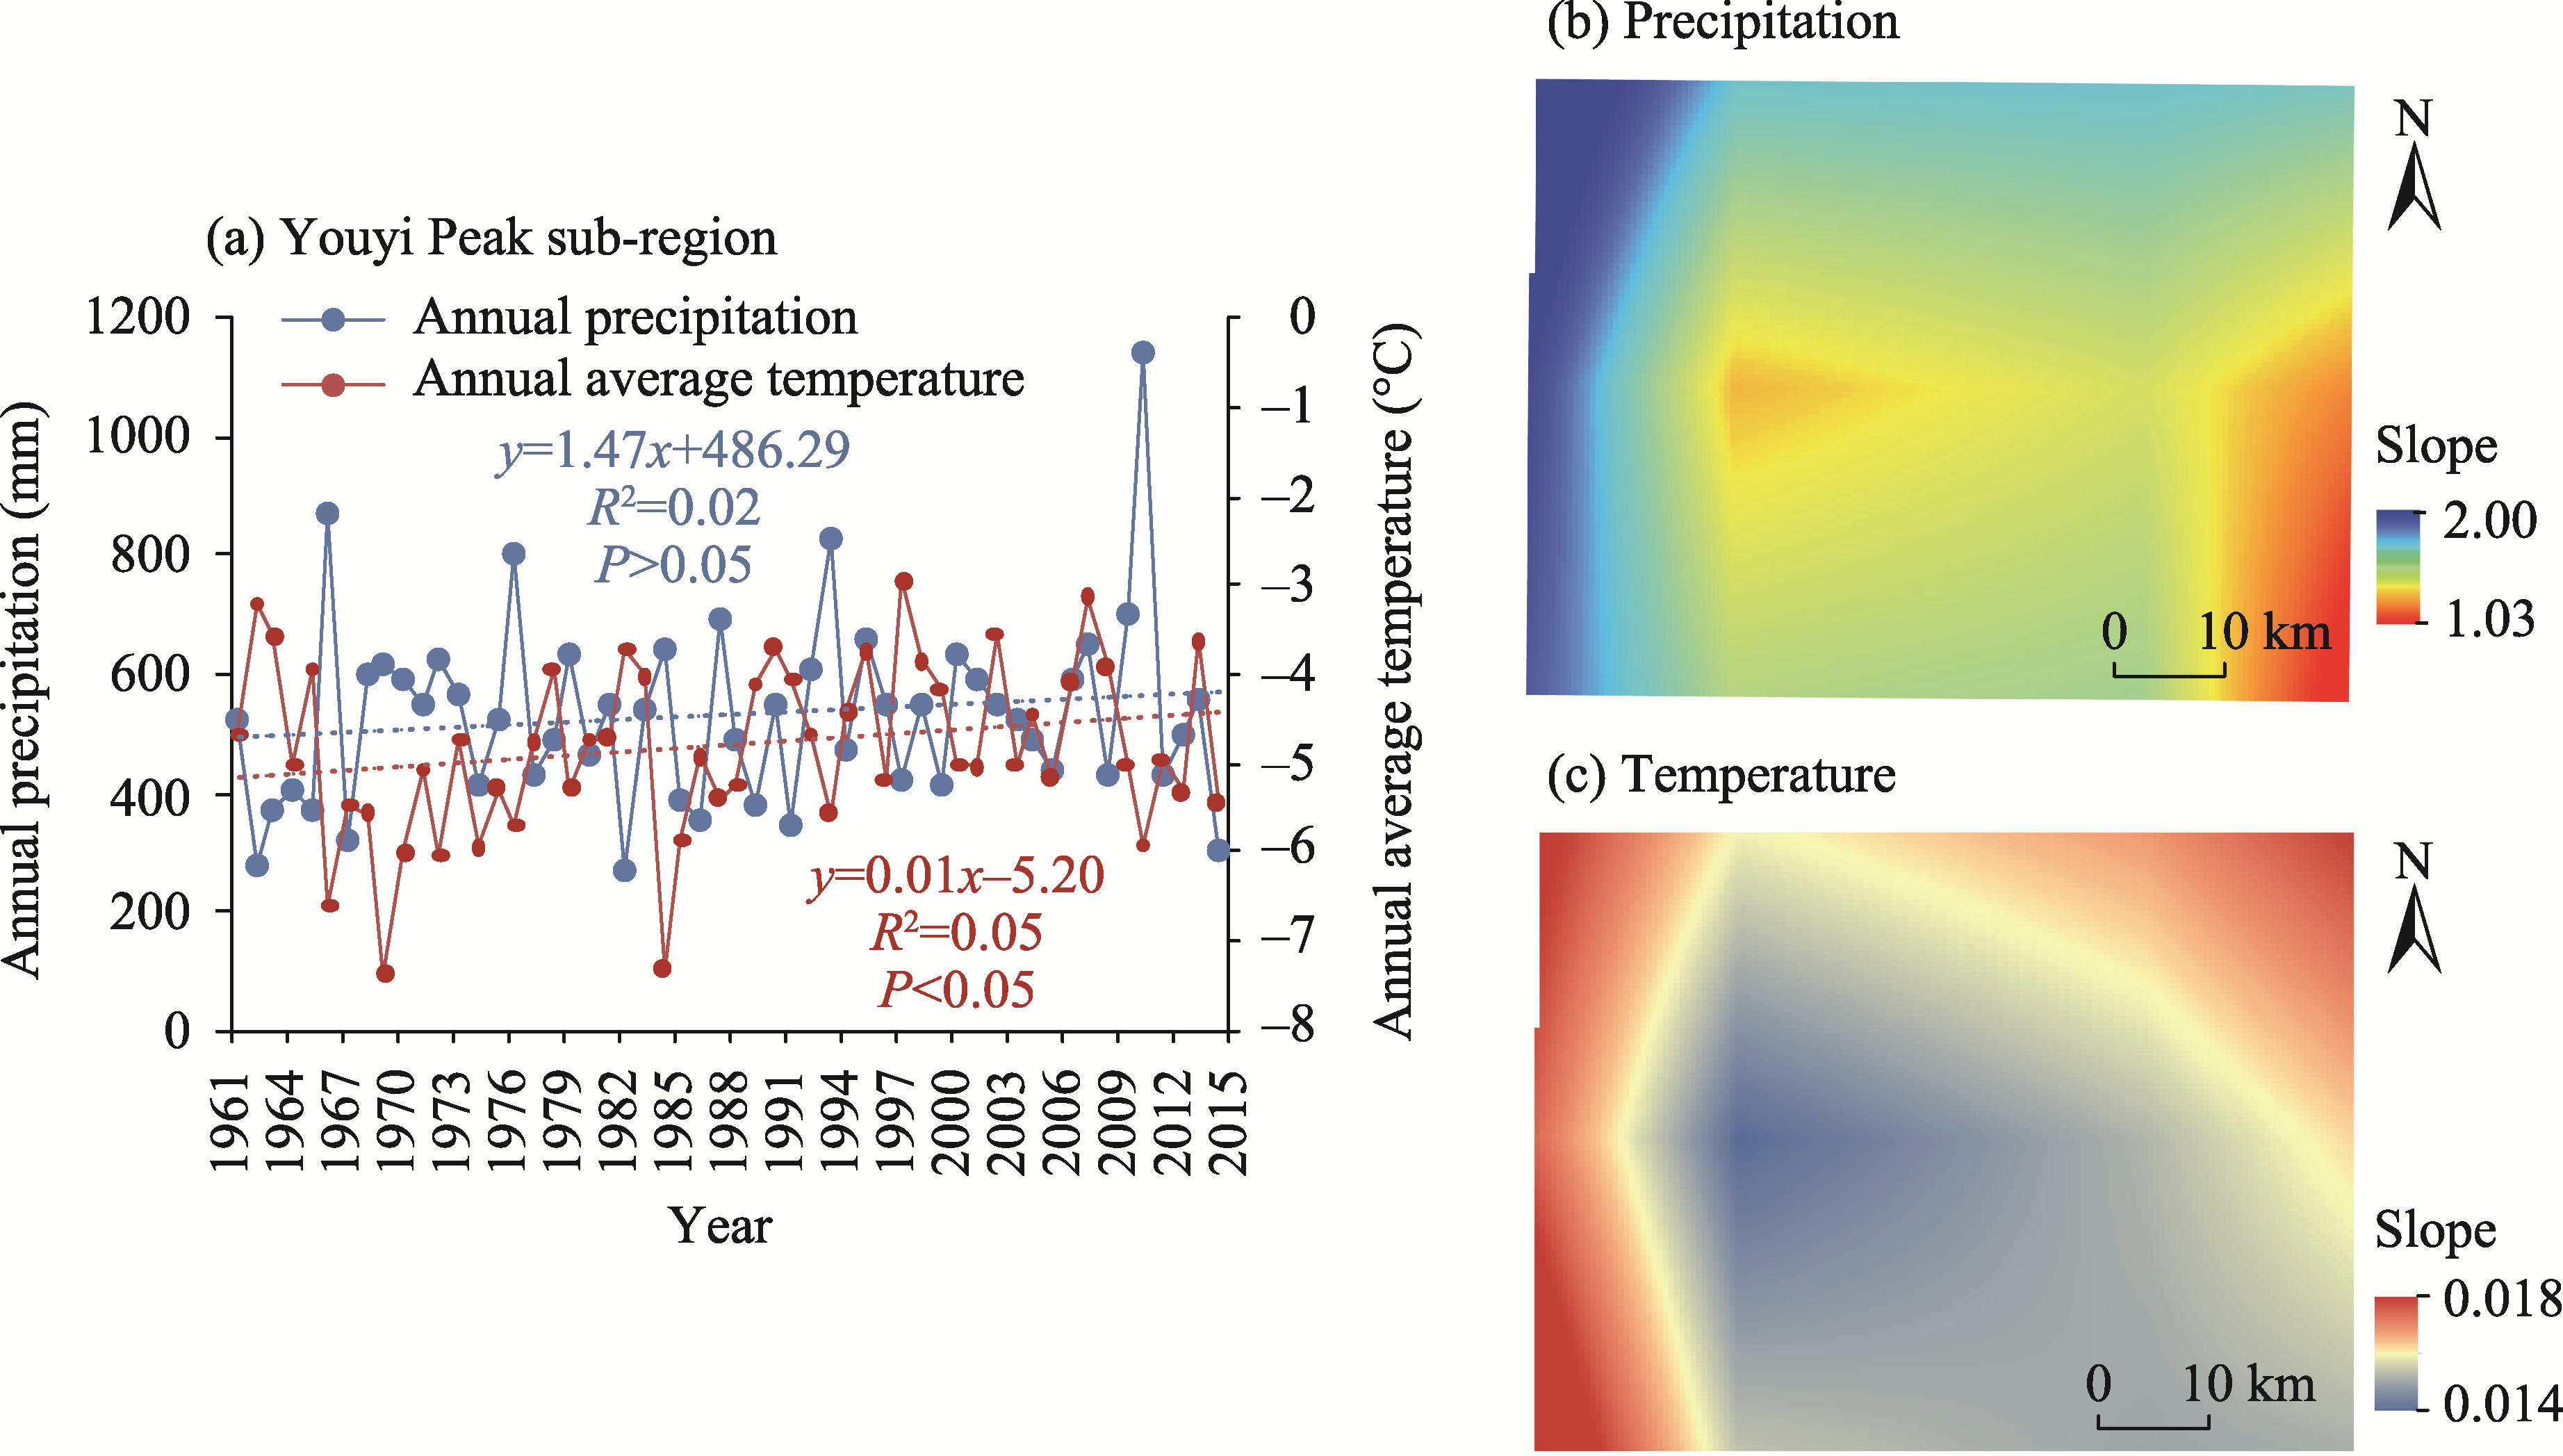
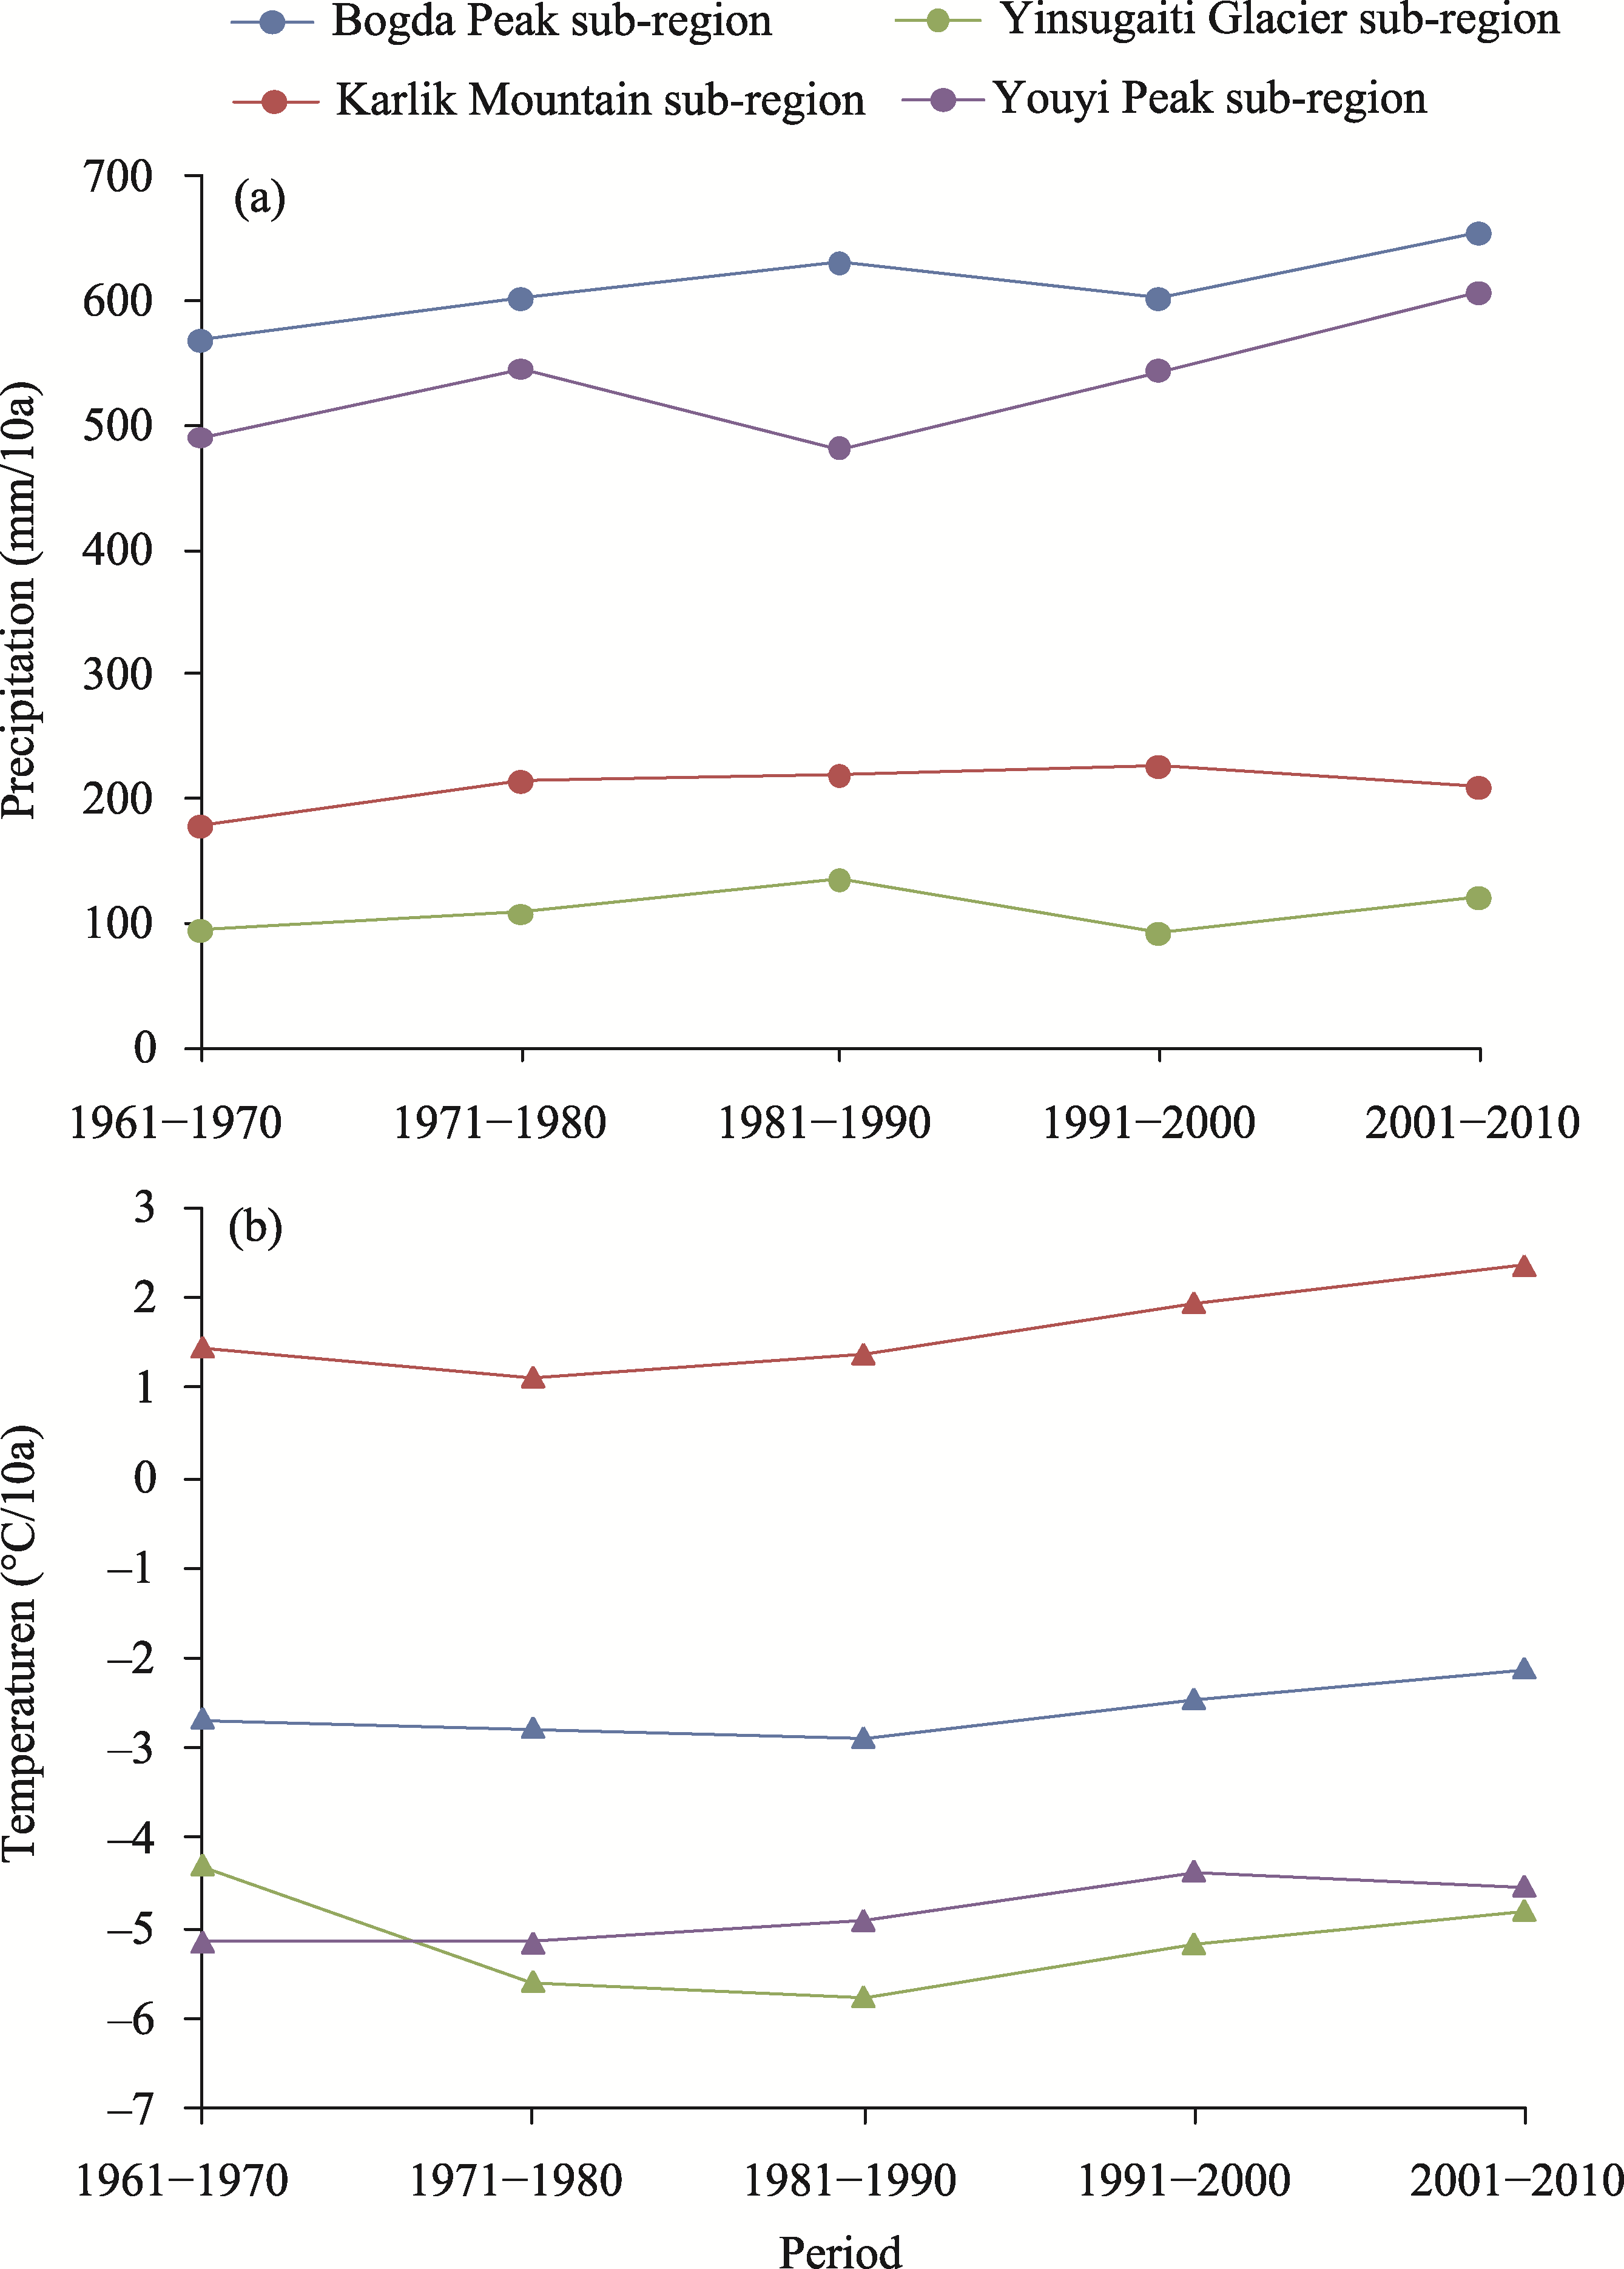
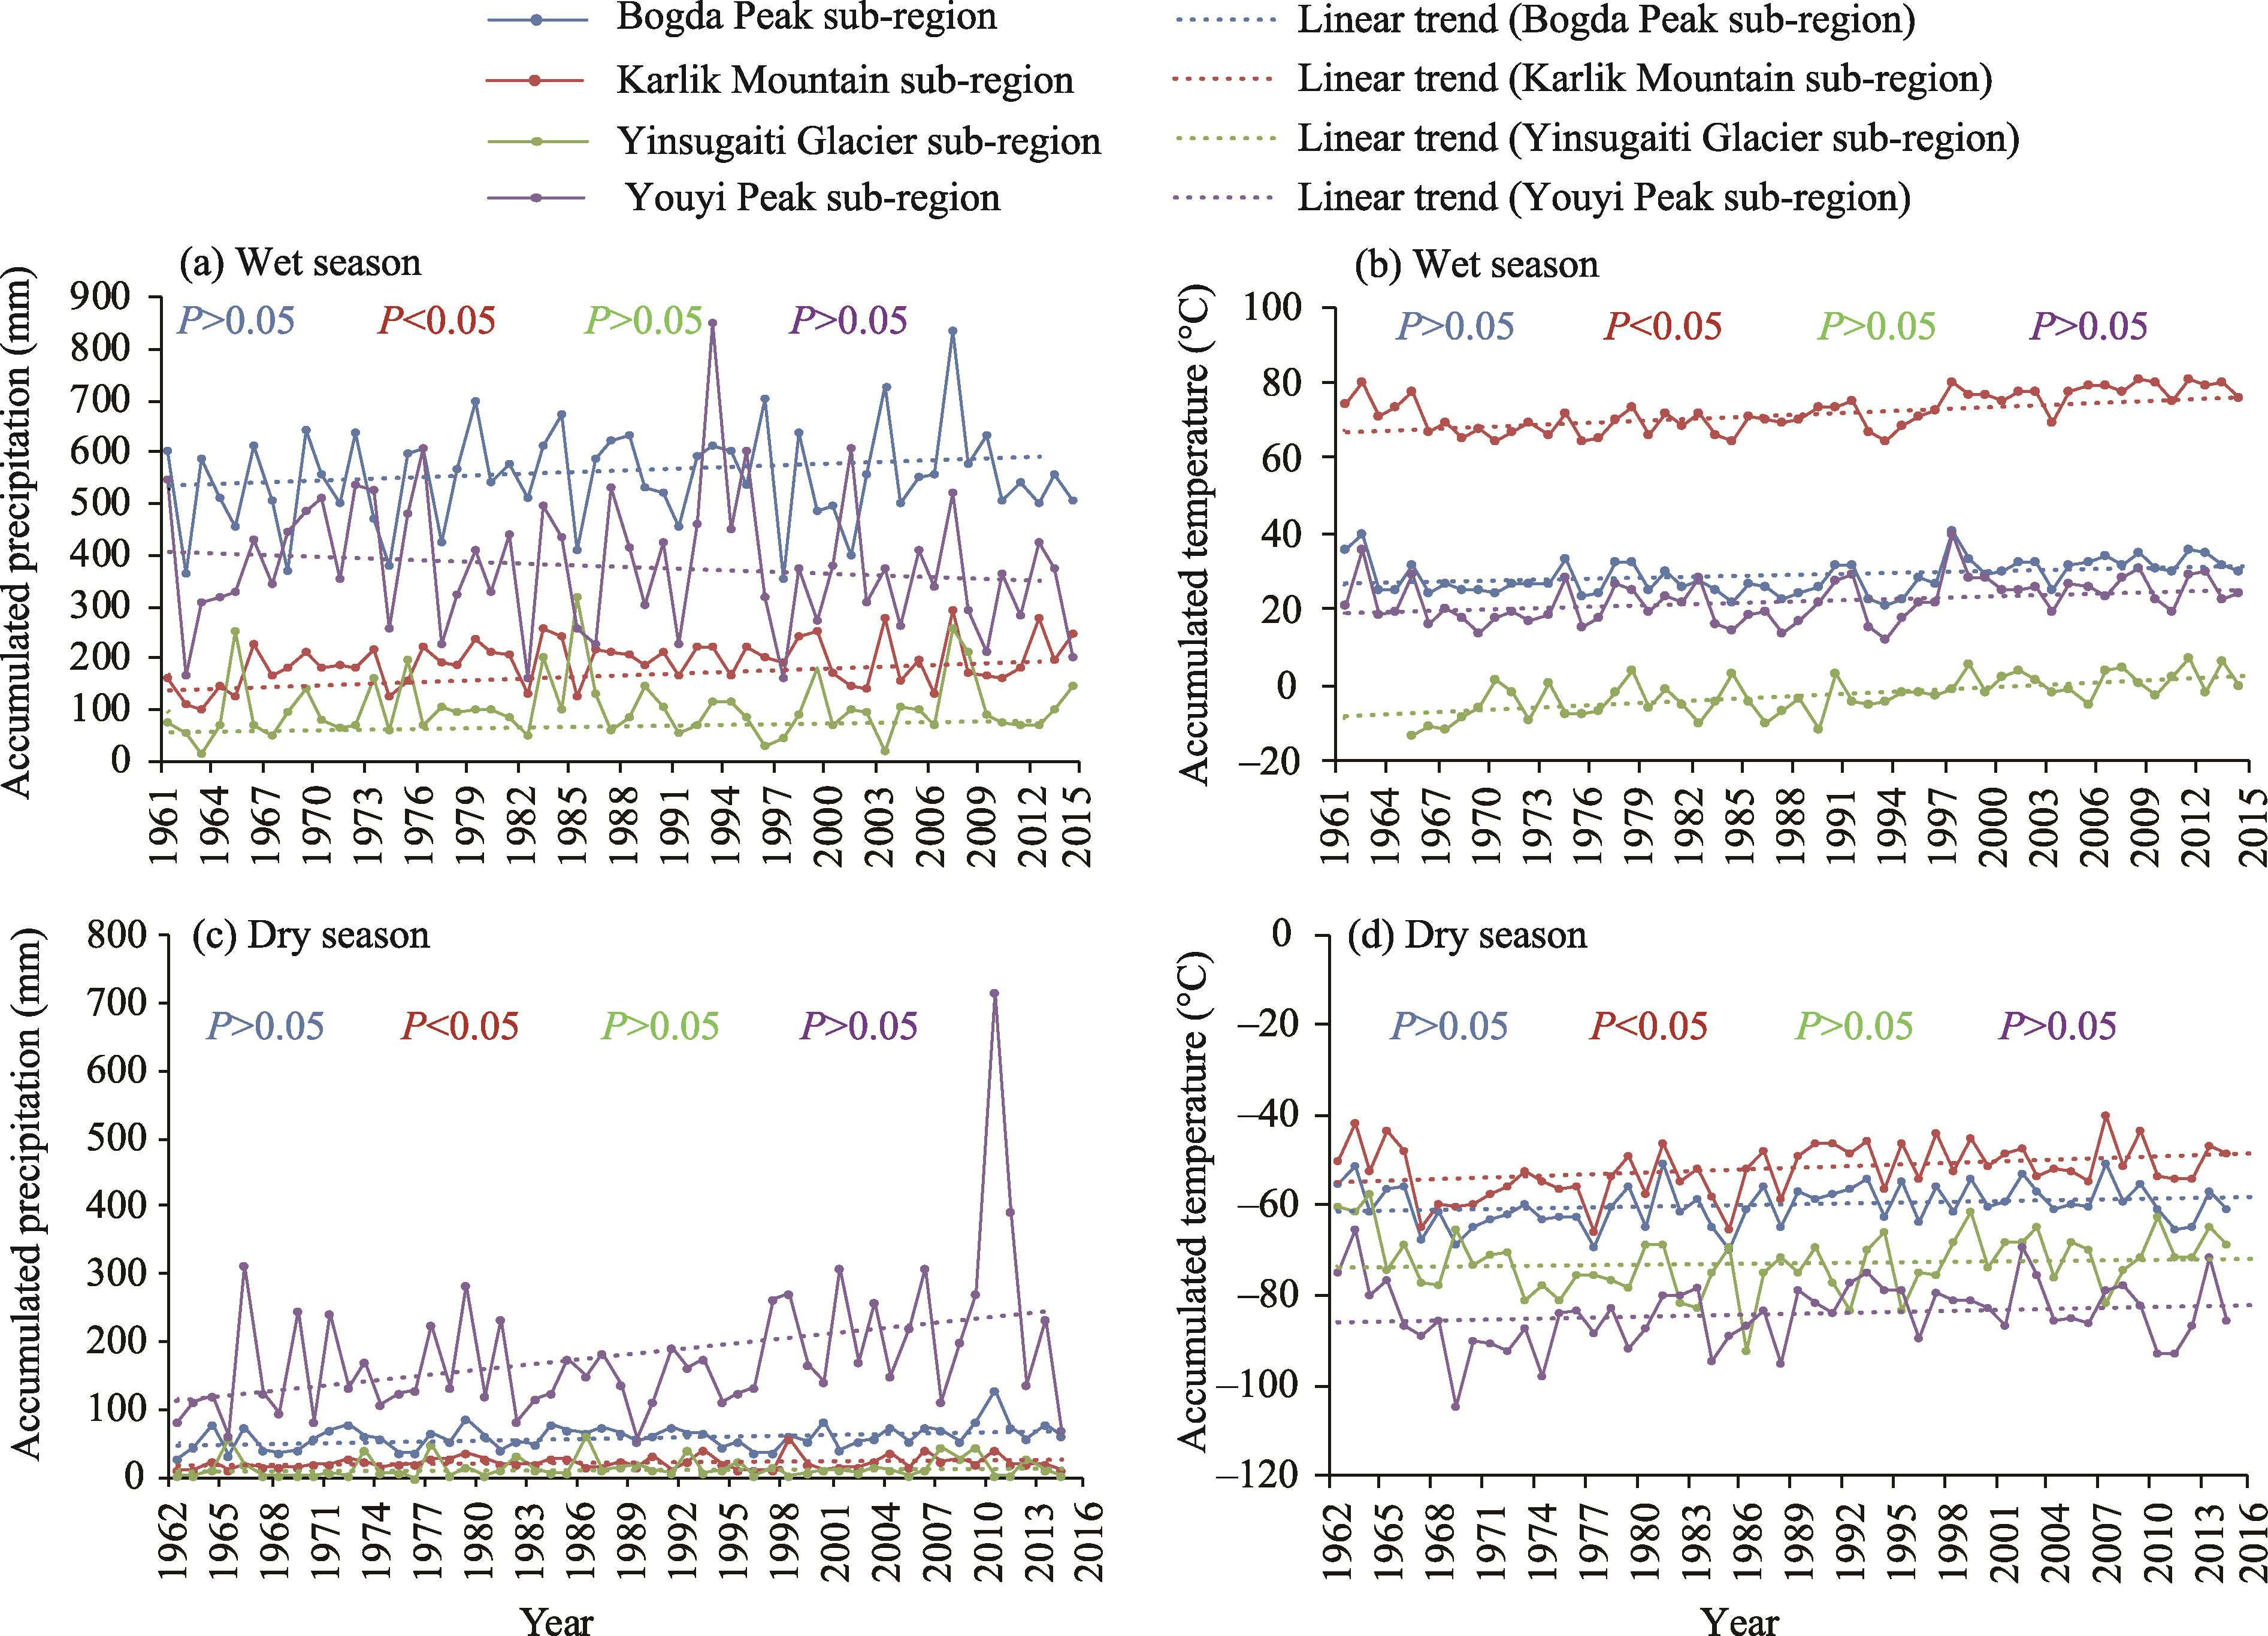
Abstract Glaciers are highly sensitive to climate change and are undergoing significant changes in mid-latitudes. In this study, we analyzed the spatiotemporal changes of typical glaciers and their responses to climate change in the period of 1990-2015 in 4 different mountainous sub-regions in Xinjiang Uygur Autonomous Region of Northwest China: the Bogda Peak and Karlik Mountain sub-regions in the Tianshan Mountains; the Yinsugaiti Glacier sub-region in the Karakorum Mountains; and the Youyi Peak sub-region in the Altay Mountains. The standardized snow cover index (NDSI) and correlation analysis were used to reveal the glacier area changes in the 4 sub-regions from 1990 to 2015. Glacial areas in the Bogda Peak, Karlik Mountain, Yinsugaiti Glacier, and Youyi Peak sub-regions in the period of 1990-2015 decreased by 57.7, 369.1, 369.1, and 170.4 km², respectively. Analysis of glacier area center of gravity showed that quadrant changes of glacier areas in the 4 sub-regions moved towards the origin. Glacier area on the south aspect of the Karlik Mountain sub-region was larger than that on the north aspect, while glacier areas on the north aspect of the other 3 sub-regions were larger than those on the south aspect. Increased precipitation in the Karlik Mountain sub-region inhibited the retreat of glaciers to a certain extent. However, glacier area changes in the Bogda Peak and Youyi Peak sub-regions were not sensitive to the increased precipitation. On a seasonal time scale, glacier area changes in the Bogda Peak, Karlik Mountain, Yinsugaiti Glacier, and Youyi Peak sub-regions were mainly caused by accumulated temperature in the wet season; on an annual time scale, the correlation coefficient between glacier area and annual average temperature was -0.72 and passed the significance test at P<0.05 level in the Karlik Mountain sub-region. The findings of this study can provide a scientific basis for water resources management in the arid and semi-arid regions of Northwest China in the context of global warming.
|
|
Received: 13 October 2021
Published: 31 May 2022
|
| Fund: This study was sponsored by the National Key Research & Development Program of China(2017YFB0504204);the K.C. Wong Education Foundation(GJTD-2020-14);the International Collaboration Project of the Chinese Academy of Sciences(131965KYSB20200029);the New Water Resources Strategic Research Project in Southern Xinjiang Uygur Autonomous Region, China(403-1005-YBN-FT6I-8) |
|
Corresponding Authors:
*:BAO Anming (E-mail: baoam@ms.xjb.ac.cn)
|
| Cite this article:
HUANG Xiaoran, BAO Anming, GUO Hao, MENG Fanhao, ZHANG Pengfei, ZHENG Guoxiong, YU Tao, QI Peng, Vincent NZABARINDA, DU Weibing. Spatiotemporal changes of typical glaciers and their responses to climate change in Xinjiang, Northwest China. Journal of Arid Land, 2022, 14(5): 502-520.
URL:
http://jal.xjegi.com/10.1007/s40333-022-0056-2 OR http://jal.xjegi.com/Y2022/V14/I5/502
|
|
|
| [1] |
Bai J Z, Li Z Q, Zhang M J, et al. 2012. Glacier changes in Youyi Area in the Altay Mountains of Xinjiang during 1959-2008. Arid Land Geography, 35(1): 116-124. (in Chinese)
|
|
|
| [2] |
Chen W, Yao T, Zhang G, et al. 2021. Accelerated glacier mass loss in the largest river and lake source regions of the Tibetan Plateau and its links with local water balance over 1976-2017. Journal of Glaciology, 67(264): 577-591.
doi: 10.1017/jog.2021.9
|
|
|
| [3] |
Cook A J, Fox A J, Vaughan D G, et al. 2005. Retreating glacier fronts on the Antarctic Peninsula over the past half-century. Science, 308(5721): 541-544.
pmid: 15845851
|
|
|
| [4] |
Dehecq A, Gourmelen N, Gardner A S, et al. 2019. Twenty-first century glacier slowdown driven by mass loss in High Mountain Asia. Nature Geoscience, 12: 22-27.
doi: 10.1038/s41561-018-0271-9
|
|
|
| [5] |
Ding Y J. 1995. Response of global glacier fluctuation to climate change in recent 40 years. Scientia Sinica (Chimica), 25(10): 1093-1098.
|
|
|
| [6] |
Duan J P, Wang L L, Ren J W, et al. 2009. Progress in glacier variations in China and its sensitivity to climatic change during the past century. Progress in Geography, 28(2): 231-237. (in Chinese)
|
|
|
| [7] |
Gao H K, Li H, Duan Z, et al. 2018. Modelling glacier variation and its impact on water resource in the Urumqi Glacier No.1 in Central Asia. Science of the Total Environment, 644: 1160-1170.
doi: 10.1016/j.scitotenv.2018.07.004
|
|
|
| [8] |
Gao X Q, Tang M C, Fen S. 2000. Discussion on the relationship between glacial fluctuation and climate change. Plateau Meteorology, 19(1): 9-16. (in Chinese)
|
|
|
| [9] |
Guo W Q, Liu S Y, Wei J F, et al. 2013. The 2008/09 surge of central Yulinchuan glacier, northern Tibetan Plateau, as monitored by remote sensing. Annals of Glaciology, 54(63): 299-310.
|
|
|
| [10] |
He Y, Yang T B. 2014. Climate variation and glacier response in the Bogda region, Tianshan Mountains. Progress in Geography, 33(10): 1387-1396. (in Chinese)
|
|
|
| [11] |
He Y, Yang T B, Chen J, et al. 2015. Remote sensing detection of glaciers changes in Dong Tianshan Bogda region in 1972-2013. Scientia Geographica Sinica, 35(7): 925-932. (in Chinese)
|
|
|
| [12] |
Hu R J. 1979. Glaciation in Karlik Mountain area, eastern Tianshan Mountains. Xinjiang Geography, 1: 69-82. (in Chinese)
|
|
|
| [13] |
Huang J Q. 1984. Glaciers in China. Journal of Glaciology and Geocryology, 1(6): 85-93. (in Chinese)
|
|
|
| [14] |
IPCC. 2013. Working Group I Contribution to the IPCC Fifth Assessment Report, Climate Change 2013: The Physical Science Basis:Summary for Policymakers. Cambridge: Cambridge University Press, 465-570
|
|
|
| [15] |
Jacob T, Wahr J, Pfeffer W T, et al. 2012. Recent contributions of glaciers and ice caps to sea level rise. Nature, 482(7386): 514-518.
doi: 10.1038/nature10847
|
|
|
| [16] |
Jiang Z L, Wang L, Zhang Z, et al. 2020. Surface elevation changes of Yengisogat Glacier between 2000 and 2014. Arid Land Geography, 43(1): 12-19. (in Chinese)
|
|
|
| [17] |
Kamb B, Raymond C F, Harrison W D, et al. 1985. Glacier surge mechanism: 1982-1983 surge of variegated glacier, Alaska. Science, 227(4686): 469-479.
pmid: 17733459
|
|
|
| [18] |
Kang S C, Xu Y W, You Q L, et al. 2010. Review of climate and cryospheric change in the Tibetan Plateau. Environmental Research Letters, 5(1): 015101.
doi: 10.1088/1748-9326/5/1/015101
|
|
|
| [19] |
Li K M, Li Z Q, Wang C Y, et al. 2016. Shrinkage of Mt. Bogda glaciers of eastern Tian Shan in Central Asia during 1962-2006. Journal of Earth Science, 27(1): 139-150.
doi: 10.1007/s12583-016-0614-7
|
|
|
| [20] |
Li Z G, Yao T D, Ye Q H, et al. 2011. Monitoring glacial variations based on remote sensing in the Luozha region, eastern Himalayas, 1980-2007. Geographical Research, 30(5): 939-952. (in Chinese)
|
|
|
| [21] |
Li Z Q, Han T D, Jin Z F, et al. 2003. A summary of 40-year observed variation facts of climate and Glacier No.1 at headwater of Urumqi River, Tianshan, China. Journal of Glaciology and Geocryology, 25(2): 117-123. (in Chinese)
|
|
|
| [22] |
Liu M L. 2014. Methods and applications for glacier extraction of multi-source remote sensing data. MSc Thesis. Lanzhou: Lanzhou Jiaotong University. (in Chinese)
|
|
|
| [23] |
Liu Z H, Wang H J, Pei H, et al. 2005. Analysis of the glacier change near 40a in Changji Prefecture, Xinjiang based on RS&GIS. Journal of Xinjiang University (Natural Science Edition), 22(2): 127-133, 253. (in Chinese)
|
|
|
| [24] |
Luo S F, Li Z Q, Wang P Y, et al. 2014. Glacier volume change in Youyi area of Altay Mountains, China from 1959 to 2008. Journal of Arid Land Resources and Environment, 28(5): 180-185. (in Chinese)
|
|
|
| [25] |
Niu S M, Li Z Q, Huai B J. 2014. Glacier changes in the Bogda region, Tianshan in the last 50 years. Journal of Arid Land Resources and Environment, 28(9): 134-138. (in Chinese)
|
|
|
| [26] |
Qian Y B, Wu S X, Wu Z N, et al. 2011. Changes of glacier resources in Karlik Mountain in recent 50 years and protection countermeasures. Arid Land Geography, 34(5): 719-725. (in Chinese)
|
|
|
| [27] |
Quirk B J, Mackey G N, Fernandez D P, et al. 2020. Speleothem and glacier records of latest Pleistocene-early Holocene climate change in the western North American interior. Journal of Quaternary Science, 35(6): 776-790.
doi: 10.1002/jqs.3221
|
|
|
| [28] |
Scherler D, Bookhagen B, Strecker M R. 2011. Spatially variable response of Himalayan glaciers to climate change affected by debris cover. Nature Geoscience, 4(3): 156-159.
doi: 10.1038/ngeo1068
|
|
|
| [29] |
Shi Y F. 1988. Introduction to Glaciers in China. Beijing: China Science Publishing, 138-170. (in Chinese)
|
|
|
| [30] |
Sorg A, Bolch T, Stoffel M, et al. 2012. Climate change impacts on glaciers and runoff in Tian Shan (Central Asia). Nature Climate Change, 2(10): 725-731.
doi: 10.1038/nclimate1592
|
|
|
| [31] |
Sun M P, Li Z Q, Yao X J, et al. 2015. Modeling the hydrological response to climate change in a glacierized high mountain region, northwest China. Journal of Glaciology, 61(225): 127-136.
doi: 10.3189/2015JoG14J033
|
|
|
| [32] |
Tian H Z, Yang T B, Liu Q P. 2012. Relationship between climate change and glacier retreat over the last 40 years in Lenglongling range of eastern Qilian Mountains. Research of Soil and Water Conservation, 19(5): 34-38. (in Chinese)
|
|
|
| [33] |
Walter W I, Ludovicus P H, et al. 2010. Climate change will affect the Asian water towers. Science, 328(5984): 1382-1385.
doi: 10.1126/science.1183188
|
|
|
| [34] |
Wang N L, Zhang X S. 1992. Mountain glacier fluctuations and climate change during the last 100 years. Journal of Glaciology and Geocryology, 14(3): 242-250. (in Chinese)
|
|
|
| [35] |
Wang P Y, Li Z Q, Zhou P, et al. 2014. Changes of representative glaciers in Xinjiang Hami and their impact to water resources. Advances in Water Science, 25(4): 518-525. (in Chinese)
|
|
|
| [36] |
Wang P Y, Li Z Q, Li H L, et al. 2020. Glaciers in Xinjiang, China: past changes and current status. Water, 12(9): 2367, doi: 10.3390/w12092367.
doi: 10.3390/w12092367
|
|
|
| [37] |
Wang X N, Yang T B, Tian H Z, et al. 2013. Response of glacier variation in the southern Altay Mountains to climate change during the last 40 years. Journal of Arid Land Resources and Environment, 27(2): 77-82. (in Chinese)
|
|
|
| [38] |
Wang Y L. 2020. Research on glacier extraction and long time series change based on remote sensing in Bogda region, Tianshan. MSc Thesis. Jiaozuo: Henan Polytechnic Univesity. (in Chinese)
|
|
|
| [39] |
Yang H A. 1987. General characteristics of the Yinsugaiti glacier. Journal of Glaciology and Geocryology, 9(1): 97-98. (in Chinese)
|
|
|
| [40] |
Yang K, Wu H, Qin J, et al. 2014. Recent climate changes over the Tibetan Plateau and their impacts on energy and water cycle: a review. Global and Planetary Change, 112: 79-91.
doi: 10.1016/j.gloplacha.2013.12.001
|
|
|
| [41] |
Yang X H, Zhao J D, Han H. 2019. Study on glacier mass balance in the Karlik Range, East Tianshan Mountains, 1972-2016. Journal of Glaciology and Geocryology, 41(1): 1-11. (in Chinese)
|
|
|
| [42] |
Yao T D, Thompson L, Yang W, et al. 2012. Different glacier status with atmospheric circulations in Tibetan Plateau and surroundings. Nature Climate Change, 2: 663-667.
doi: 10.1038/nclimate1580
|
|
|
| [43] |
Zhang G L, Wan J, Pan B T, et al. 2010. Progress in research on glacier changes using remote sensing. Journal of Lanzhou University (Natural Sciences), 46(6): 1-10. (in Chinese)
|
|
|
| [44] |
Zhang G L. 2012. The study of glacier changes in the Gongga Mountains. PhD Dissertation. Lanzhou: Lanzhou University. (in Chinese)
|
|
|
| [45] |
Zhang M J, Wang S J, Li Z Q, et al. 2012. Glacier area shrinkage in China and its climatic background during the past half century. Journal of Geographical Sciences, 22(1): 15-28.
doi: 10.1007/s11442-012-0908-3
|
|
|
| [46] |
Zhang Q F, Chen Y N, Li Z, et al. 2020. Recent changes in water discharge in snow and glacier melt-dominated rivers in the Tianshan Mountains, Central Asia. Remote Sensing, 12(17): 2704, doi: 10.3390/rs12172704.
doi: 10.3390/rs12172704
|
|
|
| [47] |
Zhao Y F, Zhu J, Xu Y. 2014. Establishment and assessment of the grid precipitation datasets in China for recent 50 years. Journal of the Meteorological Sciences, 34(4): 414-420. (in Chinese)
|
|
|
| [48] |
Zhao Y F, Zhu J. 2015. Assessing quality of grid daily precipitation datasets in China in recent 50 years. Plateau Meteorology, 34(1): 50-58. (in Chinese)
|
|
|
| [49] |
Zhou W M. 2013. Extraction of glacier area using optical remote sensing images. MSc Thesis. Changsha: Central South University. (in Chinese)
|
|
|
| [50] |
Zhu W W, Shangguan D H, Guo W Q, et al. 2014. Glaciers in some representative basins in the middle of the Tianshan Mountains: change and response to climate change. Journal of Glaciology and Geocryology, 36(6): 1376-1384. (in Chinese)
|
|
|
|
Viewed |
|
|
|
Full text
|
|
|
|
|
Abstract
|
|
|
|
|
Cited |
|
|
|
|
| |
Shared |
|
|
|
|
| |
Discussed |
|
|
|
|