| Research article |
|


|
|
|
| Monitoring fire regimes and assessing their driving factors in Central Asia |
YIN Hanmin1,2, Jiapaer GULI1,2,3,*( ), JIANG Liangliang1,2, YU Tao1,2, Jeanine UMUHOZA1,2, LI Xu1,2 ), JIANG Liangliang1,2, YU Tao1,2, Jeanine UMUHOZA1,2, LI Xu1,2 |
1State Key Laboratory of Desert and Oasis Ecology, Xinjiang Institute of Ecology and Geography, Chinese Academy of Sciences, Urumqi 830011, China
2University of Chinese Academy of Sciences, Beijing 100039, China
3Research Center for Ecology and Environment of Central Asia of Chinese Academy of Sciences, Urumqi 830011, China |
|
|
|
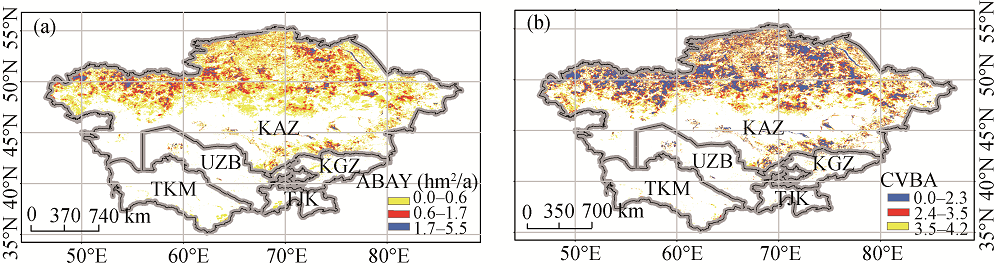
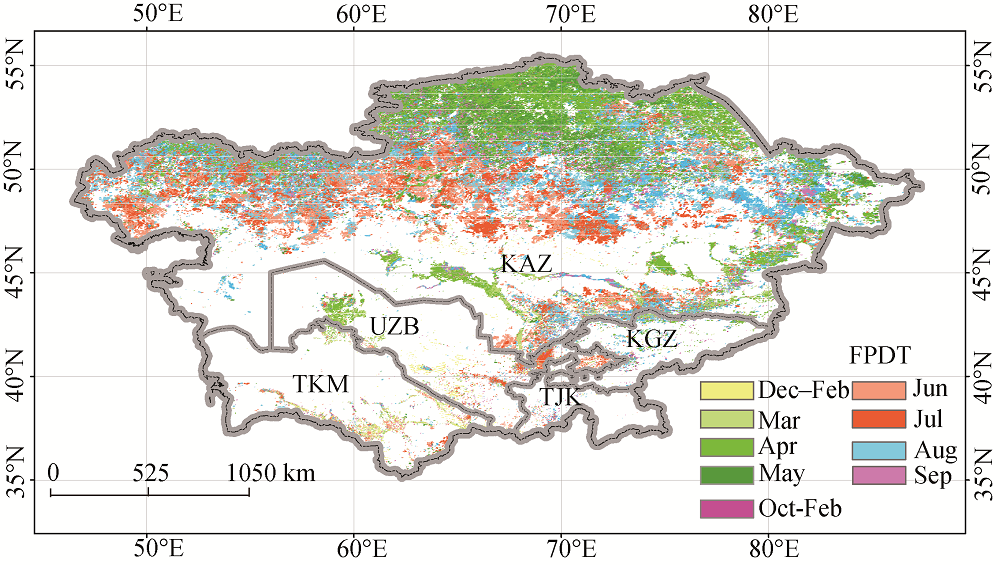
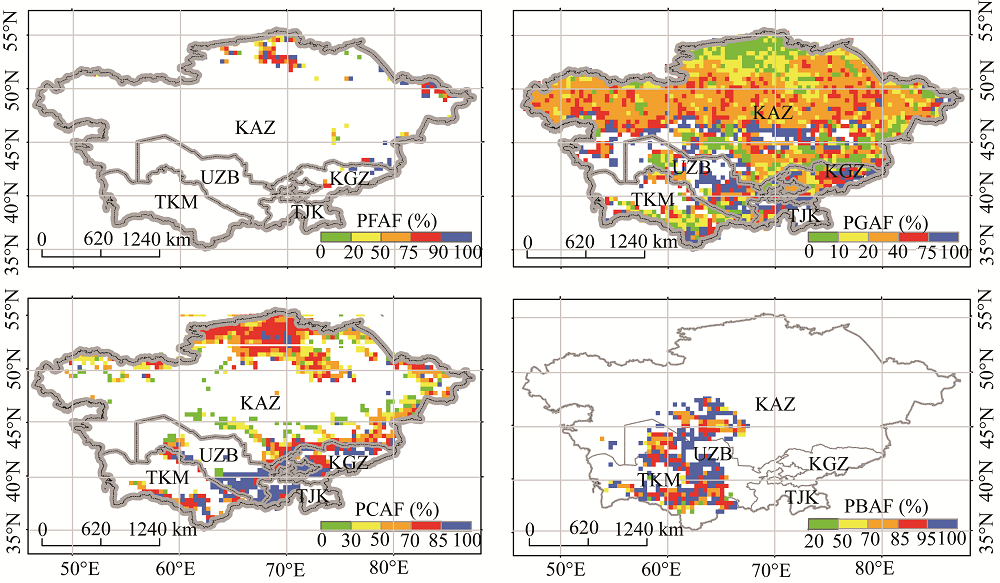
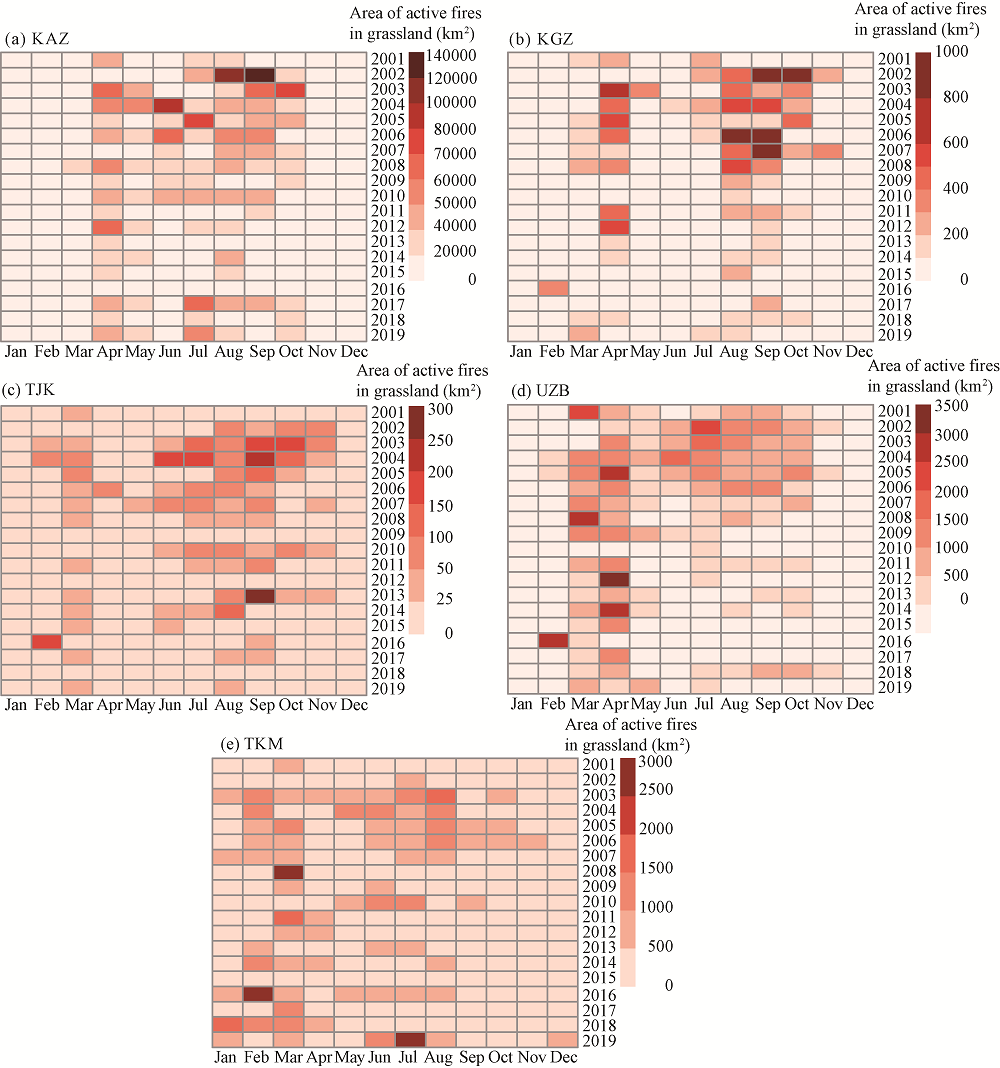
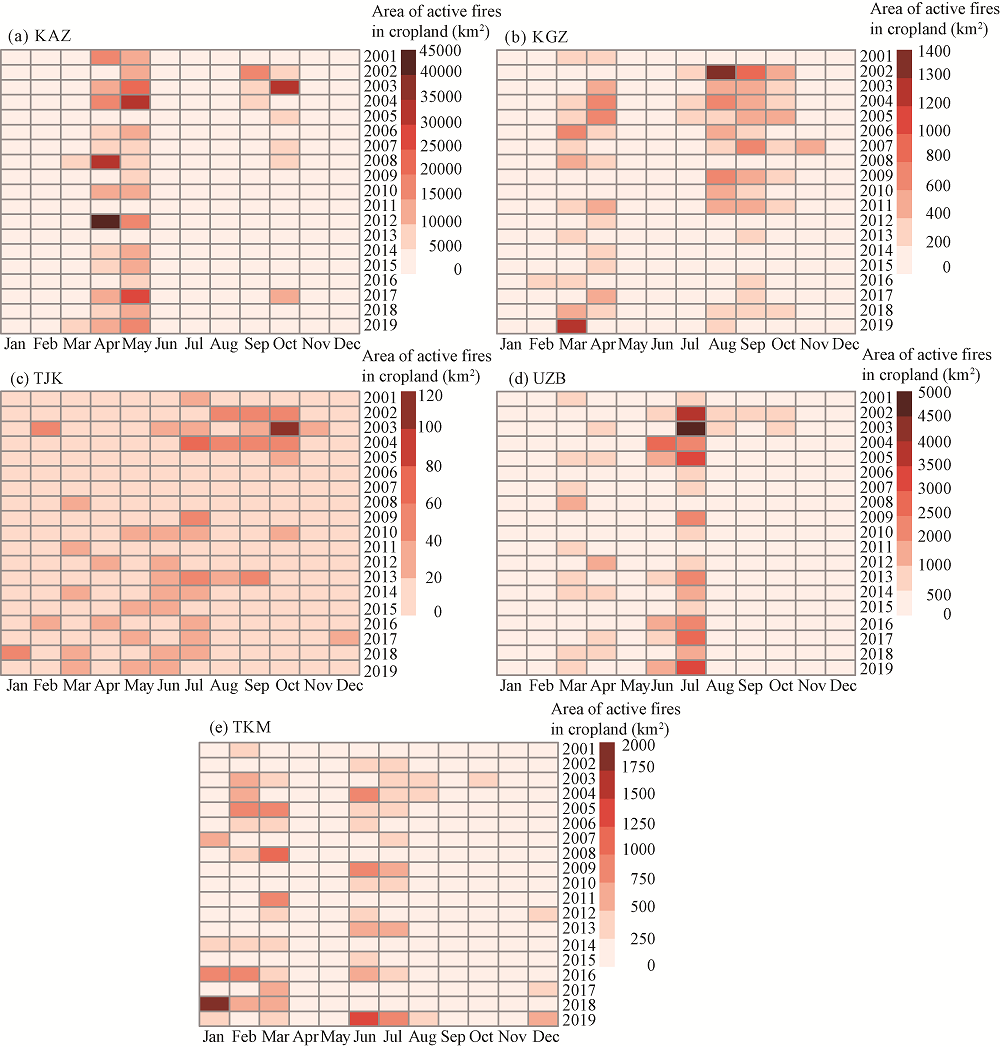
Abstract Relatively little is known about fire regimes in grassland and cropland in Central Asia. In this study, eleven variables of fire regimes were measured from 2001 to 2019 by utilizing the burned area and active fire product, which was obtained and processed from the GEE (Google Earth Engine) platform, to describe the incidence, inter-annual variability, peak month and size of fire in four land cover types (forest, grassland, cropland and bare land). Then all variables were clustered to define clusters of fire regimes with unique fire attributes using the K-means algorithm. Results showed that Kazakhstan (KAZ) was the most affected by fire in Central Asia. Fire regimes in cropland in KAZ had the frequent, large and intense characters, which covered large burned areas and had a long duration. Fires in grassland mainly occurred in central KAZ and had the small scale and high-intensity characters with different quarterly frequencies. Fires in forest were mainly distributed in northern KAZ and eastern KAZ. Although fires in grassland underwent a shift from more to less frequent from 2001 to 2019 in Central Asia, vigilance is needed because most fires in grassland occur suddenly and cause harm to humans and livestock.
|
|
Received: 22 September 2020
Published: 10 May 2021
|
|
Corresponding Authors:
|
About author: *Jiapaer GULI (E-mail: glmr@ms.xjb.ac.cn)
|
|
|
| [1] |
Andela N, Morton D C, Giglio L, et al. 2017. A human-driven decline in global burned area. Science, 356(6345):1356-1362.
doi: 10.1126/science.aal4108
|
|
|
| [2] |
Archibald S, Roy D P, van Wilgen B W, et al. 2009. What limits fire? An examination of drivers of burnt area in Southern Africa. Global Change Biology, 15(3):613-630.
doi: 10.1111/gcb.2009.15.issue-3
|
|
|
| [3] |
Argibay D S, Sparacino J, Espindola G M. 2020. A long-term assessment of fire regimes in a Brazilian ecotone between seasonally dry tropical forests and savannah. Ecological Indicators, 113:106151.
doi: 10.1016/j.ecolind.2020.106151
|
|
|
| [4] |
Bastarrika A, Chuvieco E, Martín M P. 2011. Mapping burned areas from Landsat TM/ETM+ data with a two-phase algorithm: Balancing omission and commission errors. Remote Sensing of Environment, 115(4):1003-1012.
doi: 10.1016/j.rse.2010.12.005
|
|
|
| [5] |
Benmouiza K, Cheknane A. 2013. Forecasting hourly global solar radiation using hybrid k-means and nonlinear autoregressive neural network models. Energy Conversion and Management, 75:561-569.
doi: 10.1016/j.enconman.2013.07.003
|
|
|
| [6] |
Calviño-Cancela M, Chas-Amil M L, García-Martínez E D, et al. 2017. Interacting effects of topography, vegetation, human activities and wildland-urban interfaces on wildfire ignition risk. Forest Ecology and Management, 397:10-17.
doi: 10.1016/j.foreco.2017.04.033
|
|
|
| [7] |
Chen D, Pereira J M C, Masiero A, et al. 2017. Mapping fire regimes in China using MODIS active fire and burned area data. Applied Geography, 85:14-26.
doi: 10.1016/j.apgeog.2017.05.013
|
|
|
| [8] |
Chen G, He Y, de Santis A, et al. 2017. Assessing the impact of emerging forest disease on wildfire using Landsat and KOMPSAT-2 data. Remote Sensing of Environment, 195:218-229.
doi: 10.1016/j.rse.2017.04.005
|
|
|
| [9] |
Chen Y, Morton D C, Andela N, et al. 2016. How much global burned area can be forecast on seasonal time scales using sea surface temperatures? Environmental Research Letters, 11(4):045001.
doi: 10.1088/1748-9326/11/4/045001
|
|
|
| [10] |
Chuvieco E, Martin M P, Palacios A. 2002. Assessment of different spectral indices in the red-near-infrared spectral domain for burned land discrimination. International Journal of Remote Sensing, 23(2):5103-5110.
doi: 10.1080/01431160210153129
|
|
|
| [11] |
Chuvieco E, Giglio L, Justice C. 2008. Global characterization of fire activity: toward defining fire regimes from Earth observation data. Global Change Biology, 14(7):1488-1502.
doi: 10.1111/gcb.2008.14.issue-7
|
|
|
| [12] |
Chuvieco E, Martínez S, Román M V, et al. 2014. Integration of ecological and socio-economic factors to assess global vulnerability to wildfire. Global Ecology and Biogeography, 23(2):245-258.
doi: 10.1111/geb.2014.23.issue-2
|
|
|
| [13] |
Davies D K, Ilavajhala S, Wong M M, et al. 2009. Fire Information for resource management system: archiving and distributing MODIS active fire data. IEEE Transactions on Geoscience and Remote Sensing, 47(1):72-79.
doi: 10.1109/TGRS.2008.2002076
|
|
|
| [14] |
Devineau J L, Fournier A, Nignan S. 2010. Savanna fire regimes assessment with MODIS fire data: Their relationship to land cover and plant species distribution in western Burkina Faso (West Africa). Journal of Arid Environments, 74(9):1092-1101.
doi: 10.1016/j.jaridenv.2010.03.009
|
|
|
| [15] |
Downing T A, Imo M, Kimanzi J. 2017. Fire occurrence on Mount Kenya and patterns of burning. GeoResJ, 13:17-26.
doi: 10.1016/j.grj.2016.12.003
|
|
|
| [16] |
Flannigan M D, Stocks B J, Wotton B M. 2000. Climate change and forest fires. Science of the Total Environment, 262(3):221-229.
pmid: 11087028
|
|
|
| [17] |
Flannigan M D, Amiro B D, Logan K A, et al. 2006. Forest fires and climate change in the 21st century. Mitigation and Adaptation Strategies for Global Change, 11:847-859.
doi: 10.1007/s11027-005-9020-7
|
|
|
| [18] |
Furihata S, Kasai A, Hidaka K, et al. 2019. Ecological risks of insecticide contamination in water and sediment around off-farm irrigated rice paddy fields. Environmental Pollution, 251:628-638.
doi: 10.1016/j.envpol.2019.05.009
|
|
|
| [19] |
Grégoire J M, Eva H D, Belward A S, et al. 2013. Effect of land-cover change on Africa's burnt area. International Journal of Wildland Fire, 22:107.
doi: 10.1071/WF11142
|
|
|
| [20] |
Guo H, Chen S, Bao A M, et al. 2015. Inter-comparison of high-resolution satellite precipitation products over Central Asia. Remote Sensing, 7(6):7181-7211.
doi: 10.3390/rs70607181
|
|
|
| [21] |
Guo H, Bao A M, Ndayisaba F, et al. 2017. Systematical evaluation of satellite precipitation estimates over central Asia using an improved error-component procedure. Journal of Geophysical Research: Atmospheres, 122(20):10906-10927.
doi: 10.1002/2017JD026877
|
|
|
| [22] |
Guo H, Bao A M, Felix N, et al. 2018a. Space-time characterization of drought events and their impacts on vegetation in Central Asia. Journal of Hydrology, 564:1165-1178.
doi: 10.1016/j.jhydrol.2018.07.081
|
|
|
| [23] |
Guo H, Bao A M, Liu T, et al. 2018b. Spatial and temporal characteristics of droughts in Central Asia during 1966-2015. Science of the Total Environment, 624:1523-1538.
doi: 10.1016/j.scitotenv.2017.12.120
|
|
|
| [24] |
Guo H, Bao A M, Liu T, et al. 2019. Determining variable weights for an Optimal Scaled Drought Condition Index (OSDCI): Evaluation in Central Asia. Remote Sensing of Environment, 231:111220.
doi: 10.1016/j.rse.2019.111220
|
|
|
| [25] |
Hantson S, Pueyo S, Chuvieco E. 2015. Global fire size distribution is driven by human impact and climate. Global Ecology and Biogeography, 24(1):77-86.
doi: 10.1111/geb.12246
|
|
|
| [26] |
Jiang L L, Guli J P, Bao A M, et al. 2017. Vegetation dynamics and responses to climate change and human activities in Central Asia. Science of the Total Environment, 599- 600:967-980.
|
|
|
| [27] |
Justice C O, Giglio L, Korontzi S, et al. 2002. The MODIS fire products. Remote Sensing of Environment, 83(1-2):244-262.
doi: 10.1016/S0034-4257(02)00076-7
|
|
|
| [28] |
Klein I, Gessner U, Kuenzer C. 2012. Regional land cover mapping and change detection in Central Asia using MODIS time-series. Applied Geography, 35(1-2):219-234.
doi: 10.1016/j.apgeog.2012.06.016
|
|
|
| [29] |
Krebs P, Pezzatti G B, Mazzoleni S, et al. 2010. Fire regime: history and definition of a key concept in disturbance ecology. Theory in Biosciences, 129:53-69.
doi: 10.1007/s12064-010-0082-z
|
|
|
| [30] |
Lehmann C E, Anderson T M, Sankaran M, et al. 2014. Savanna vegetation-fire-climate relationships differ among continents. Science, 343(6170):548-552.
doi: 10.1126/science.1247355
|
|
|
| [31] |
Levin N, Heimowitz A. 2012. Mapping spatial and temporal patterns of Mediterranean wildfires from MODIS. Remote Sensing of Environment, 126:12-26.
doi: 10.1016/j.rse.2012.08.003
|
|
|
| [32] |
Lizundia-Loiola J, Otón G, Ramo R, et al. 2020. A spatio-temporal active-fire clustering approach for global burned area mapping at 250 m from MODIS data. Remote Sensing of Environment, 236:111493.
doi: 10.1016/j.rse.2019.111493
|
|
|
| [33] |
Lletı́ R, Ortiz M C, Sarabia L A, et al. 2004. Selecting variables for k-means cluster analysis by using a genetic algorithm that optimizes the silhouettes. Analytica Chimica Acta, 515(1):87-100.
doi: 10.1016/j.aca.2003.12.020
|
|
|
| [34] |
Long X, Tie X X, Cao J L, et al. 2016. Impact of crop field burning and mountains on heavy haze in the North China Plain: a case study. Atmospheric Chemistry and Physics, 16:9675-9691.
doi: 10.5194/acp-16-9675-2016
|
|
|
| [35] |
Moreira F, Viedma O, Arianoutsou M, et al. 2011. Landscape-wildfire interactions in southern Europe: Implications for landscape management. Journal of Environmental Management, 92(10):2389-2402.
doi: 10.1016/j.jenvman.2011.06.028
|
|
|
| [36] |
Morgan P, Hardy C C, Swetnam T W, et al. 2001. Mapping fire regimes across time and space: Understanding coarse and fine-scale fire patterns. International Journal of Wildland Fire, 10(3-4):329-342.
doi: 10.1071/WF01032
|
|
|
| [37] |
Musyimi Z, Said M Y, Zida D, et al. 2017. Evaluating fire severity in Sudanian ecosystems of Burkina Faso using Landsat 8 satellite images. Journal of Arid Environments, 139, 95-109.
doi: 10.1016/j.jaridenv.2016.11.005
|
|
|
| [38] |
Oliveras I, Anderson L O, Malhi Y. 2014. Application of remote sensing to understanding fire regimes and biomass burning emissions of the tropical Andes. Global Biogeochemical Cycles, 28(4):480-496.
doi: 10.1002/gbc.v28.4
|
|
|
| [39] |
Palmer W C. 1965. Meteorological Drought. U.S. Department of Commerce: Weather Bureau Research Paper, 45:45-58.
|
|
|
| [40] |
Pausas J G, Fernández-Muñoz S. 2012. Fire regime changes in the Western Mediterranean Basin: from fuel-limited to drought-driven fire regime. Climatic Change, 110:215-226.
doi: 10.1007/s10584-011-0060-6
|
|
|
| [41] |
Pereira P, Cerda A, Jordan A, et al. 2013. Spatio-temporal vegetation recuperation after a grassland fire in Lithuania. Procedia Environmental Sciences, 19:856-864.
doi: 10.1016/j.proenv.2013.06.095
|
|
|
| [42] |
Petrenko M, Kahn R, Chin M, et al. 2012. The use of satellite-measured aerosol optical depth to constrain biomass burning emissions source strength in the global model GOCART. Journal of Geophysical Research: Atmospheres, 117(D18):23-24.
|
|
|
| [43] |
Qi J, Bobushev T S, Kulmatov R, et al. 2012. Addressing global change challenges for Central Asian socio-ecosystems. Frontiers of Earth Science, 6(2):115-121.
doi: 10.1007/s11707-012-0320-4
|
|
|
| [44] |
Roy D P, Boschetti L, Smith A M S. 2013. Satellite remote sensing of fires. Fire Phenomena and the Earth System, 77-93.
|
|
|
| [45] |
Schepers L, Haest B, Veraverbeke S, et al. 2014. Burned area detection and burn severity assessment of a heathland fire in Belgium using airborne imaging spectroscopy (APEX). Remote Sensing, 6(3):1803-1826.
doi: 10.3390/rs6031803
|
|
|
| [46] |
Stavi I. 2019. Wildfires in grasslands and shrublands: A review of impacts on vegetation, soil, hydrology, and geomorphology. Water, 11(5):1042.
doi: 10.3390/w11051042
|
|
|
| [47] |
Steinley D. 2006. K-means clustering: a half-century synthesis. The British Journal of Mathematical and Statistical Psychology, 59:1-34.
doi: 10.1348/000711005X48266
|
|
|
| [48] |
Tibshirani R, Walther G, Hastie T. 2001. Estimating the number of clusters in a data set via the gap statistic. Journal of the Royal Statistical Society: Series B (Statistical Methodology), 63(2):411-423.
|
|
|
| [49] |
Vadrevu K P, Ellicott E, Giglio L, et al. 2012. Vegetation fires in the himalayan region-Aerosol load, black carbon emissions and smoke plume heights. Atmospheric Environment, 47:241-251.
doi: 10.1016/j.atmosenv.2011.11.009
|
|
|
| [50] |
Wang H J, Chen Y N, Pan Y P, et al. 2015. Spatial and temporal variability of drought in the arid region of China and its relationships to teleconnection indices. Journal of Hydrology, 523:283-296.
doi: 10.1016/j.jhydrol.2015.01.055
|
|
|
| [51] |
Yang J, Tian H Q, Tao B, et al. 2014. Spatial and temporal patterns of global burned area in response to anthropogenic and environmental factors: Reconstructing global fire history for the 20th and early 21st centuries. Journal of Geophysical Research: Biogeosciences, 119(3):249-263.
doi: 10.1002/2013JG002532
|
|
|
| [52] |
Zavala L M M, de Celis Silvia R, et al . 2014. How wildfires affect soil properties. A brief review. Cuadernos de investigación geográfica/ Geographical Research Letters, 40(2):311-331.
|
|
|
| [53] |
Zeng Y, Yang X K, Fang N F, et al. 2020. Large-scale afforestation significantly increases permanent surface water in China's vegetation restoration regions. Agricultural and Forest Meteorology, 290:108001.
doi: 10.1016/j.agrformet.2020.108001
|
|
|
| [54] |
Zhang H X, Chen T X, Jiang X D, et al. 2019. Asymmetric interannual variation trend of NDVI in two-cropping farmland in eastern China and its potential climatic causes. Journal of Jiangsu Agricultural Sciences, 47:242-247. (in Chinese)
|
|
|
|
Viewed |
|
|
|
Full text
|
|
|
|
|
Abstract
|
|
|
|
|
Cited |
|
|
|
|
| |
Shared |
|
|
|
|
| |
Discussed |
|
|
|
|