| Research article |
|


|
|
|
| Transformation among precipitation, surface water, groundwater, and mine water in the Hailiutu River Basin under mining activity |
LI Qian, MA Long( ), LIU Tingxi ), LIU Tingxi |
| College of Water Conservancy and Civil Engineering College, Inner Mongolia Agricultural University, Hohhot 010018, China |
|
|
|
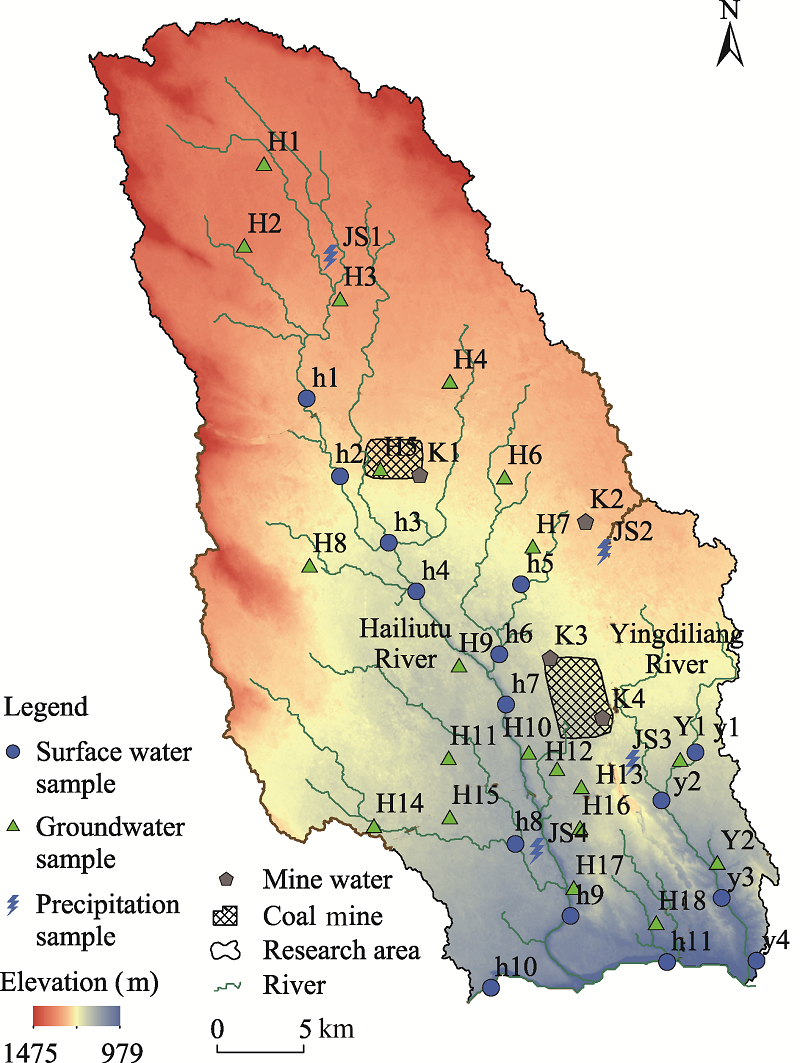
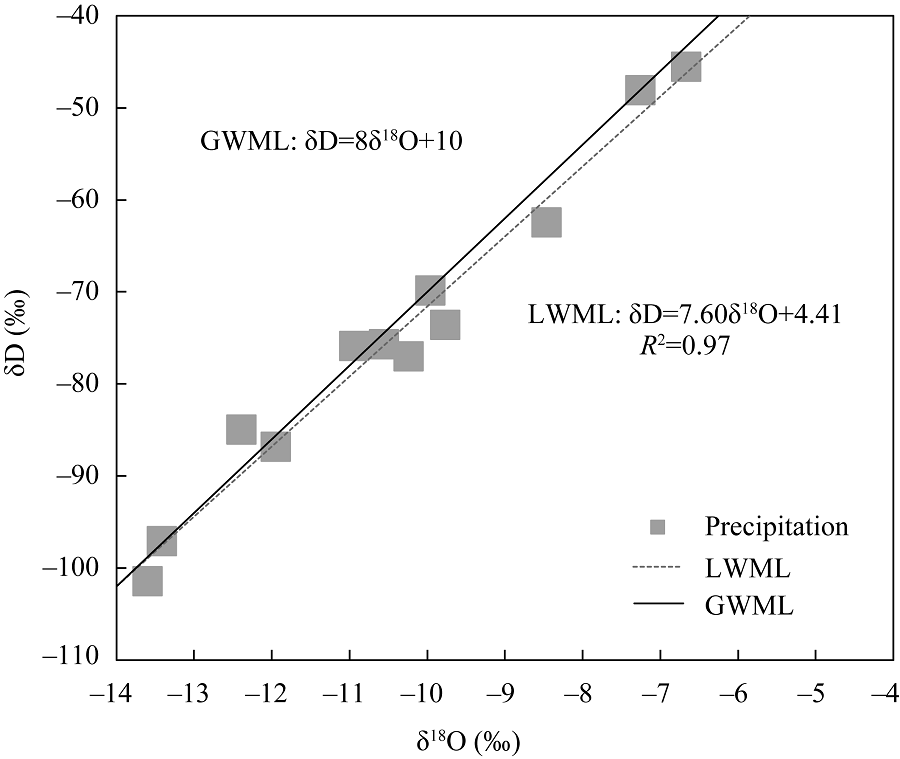
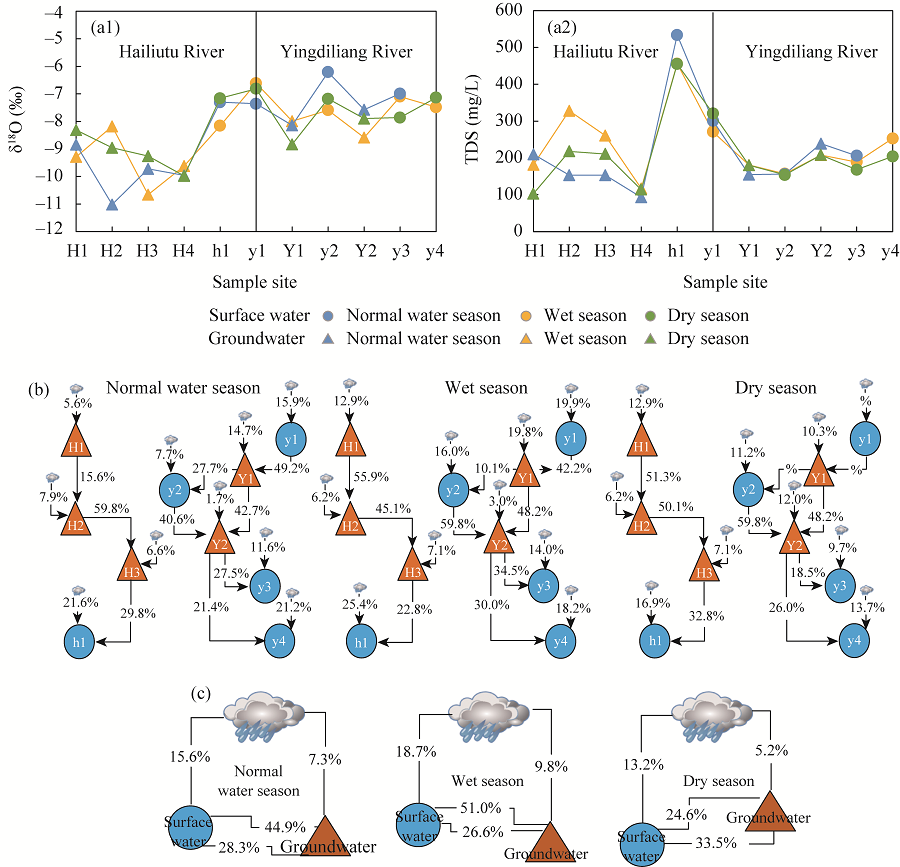
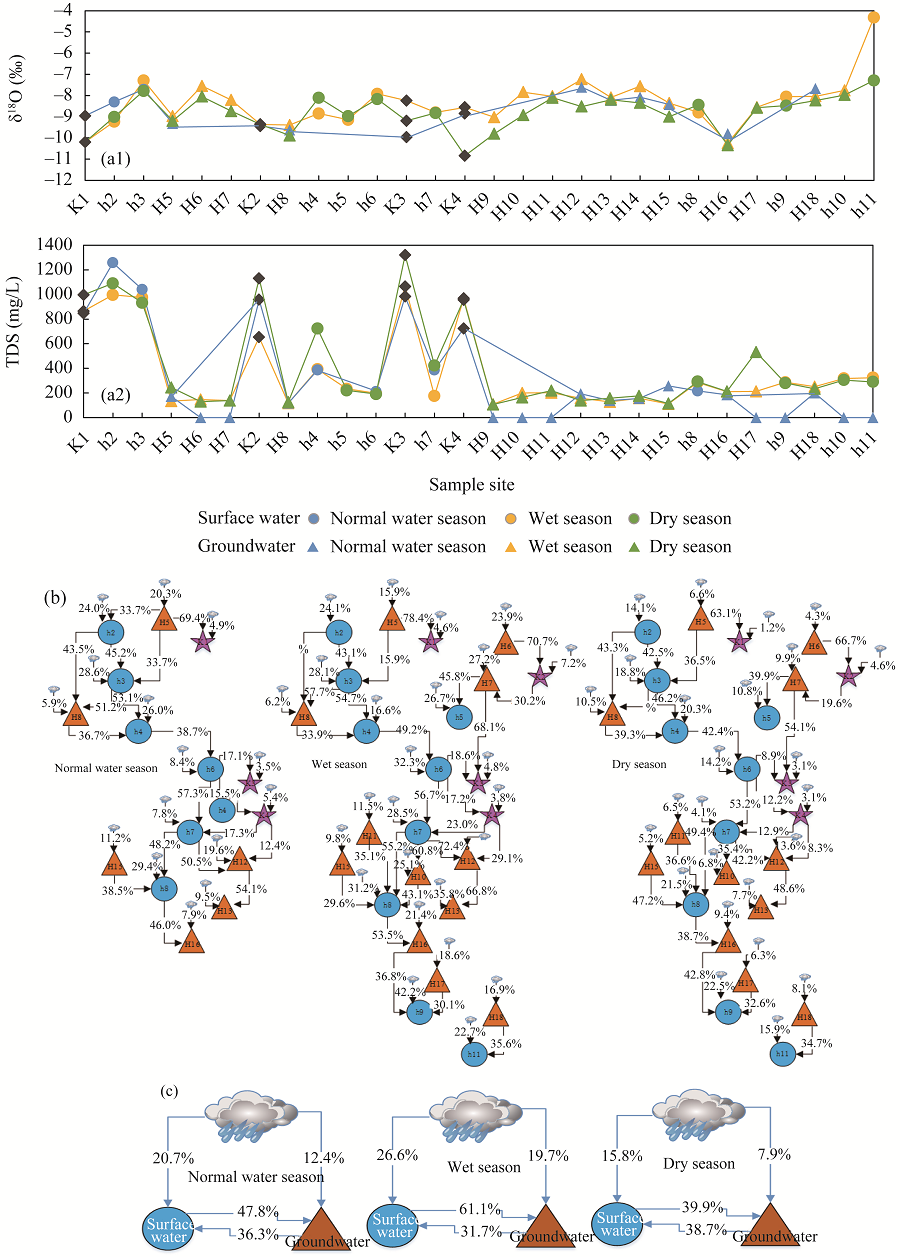
Abstract Coal mining has changed the hydrogeological conditions of river basins, and studying how the relationship among different types of water body has changed under the influence of coal mining is of great significance for understanding the regional hydrological cycle. We analyzed the temporal and spatial distribution of hydrochemical properties and environmental isotopes in the Hailiutu River Basin (HRB), China with a mixed model. The results showed that: (1) human activity (e.g., coal mining and agricultural production) causes considerable changes in the hydrochemical properties of surface water in and around the mining areas, and leads to significant increases in the concentrations of Na+ and SO2- 4; (2) precipitation is the main source of water vapour in the HRB. The transformation between surface water and groundwater in the natural watershed is mainly affected by precipitation; and (3) in the mining areas, the average contribution rates of precipitation to the recharge of surface water and groundwater increased by 2.6%-7.9% and 2.7%-9.9%, respectively. Groundwater in the Salawusu Formation constitutes up to 61.3%-72.4% of mine water. Overall, this study is beneficial for quantifying the effects of coal mining on local hydrological cycles. The research results can provide a reference for local water resources management and ecological environment improvement.
|
|
Received: 18 February 2022
Published: 30 June 2022
|
|
Corresponding Authors:
* MA Long (E-mail: malong4444333@163.com)
|
|
|
| [1] |
Ayadi Y, Mokadem N, Besser H, et al. 2018. Hydrochemistry and stable isotopes (δ18O and δ2H) tools applied to the study of Karst aquifers in southern Mediterranean basin (Teboursouk area, NW Tunisia). Journal of African Earth Sciences, 137: 208-217.
doi: 10.1016/j.jafrearsci.2017.10.018
|
|
|
| [2] |
Batsaikhan B, Kwon J S, Kim K H, et al. 2017 Hydrochemical evaluation of the influences of mining activities on river water chemistry in central northern Mongolia. Environmental Science and Pollution Research, 24(2): 2019-2034.
doi: 10.1007/s11356-016-7895-3
|
|
|
| [3] |
Bouzekri S, Fadili H, Hachimi M L, et al. 2020. Assessment of trace metals contamination in sediment and surface water of quarry lakes from the abandoned Pb mine Zaida, High Moulouya-Morocco. Environment, Development and Sustainability, 22(7): 7013-7031.
doi: 10.1007/s10668-019-00525-y
|
|
|
| [4] |
Chai Y, Xiao C, Li M, et al. 2021. Conversion relationship between groundwater and surface water in the Taizi River Basin in China based on geochemical and isotopic characteristics. Environmental Science and Pollution Research, 28(16): 20045-20057.
doi: 10.1007/s11356-020-11896-5
|
|
|
| [5] |
Chen J, Qian H, Gao Y Y, et al. 2020. Insights into hydrological and hydrochemical processes in response to water replenishment for lakes in arid regions. Journal of Hydrology, 581: 124386, doi: 10.1016/j.jhydrol.2019.124386.
doi: 10.1016/j.jhydrol.2019.124386
|
|
|
| [6] |
Du K, Zhang B Y, Li K, et al. 2021. Characteristics of hydrogen and oxygen isotopes in different water bodies in the typical loess hilly region. Earth and Environment, 49(3): 270-276. (in Chinese)
|
|
|
| [7] |
Gavrishin A I. 2018. Mine waters of the eastern Donbass and their effect on the chemistry of groundwater and surface water in the region. Water Resources, 45(5): 785-794.
doi: 10.1134/S0097807818050081
|
|
|
| [8] |
Guan Z, Jia Z, Zhao Z, et al. 2019. Identification of inrush water recharge sources using hydrochemistry and stable isotopes: A case study of Mindong No. 1 coal mine in north-east Inner Mongolia, China. Journal of Earth System Science, 128(7): 1-12.
doi: 10.1007/s12040-018-1037-x
|
|
|
| [9] |
Guo Q, Yang Y, Han Y, et al. 2019. Assessment of surface-groundwater interactions using hydrochemical and isotopic techniques in a coal mine watershed, NW China. Environmental Earth Sciences, 78(3): 91.
doi: 10.1007/s12665-019-8053-2
|
|
|
| [10] |
Han J M, Gao J, Du K, et al. 2020. Analysis of hydrochemical characteristics and formation mechanism in coal mine underground reservoir. Coal Science and Technology, 48(11): 223-231. (in Chinese)
|
|
|
| [11] |
Hao S, Li F, Li Y, et al. 2019. Stable isotope evidence for identifying the recharge mechanisms of precipitation, surface water, and groundwater in the Ebinur Lake basin. Science of the Total Environment, 657: 1041-1050.
doi: 10.1016/j.scitotenv.2018.12.102
|
|
|
| [12] |
Hao C, Huang Y, He P, et al. 2019. Isotope drift characteristics in Ordovician Limestone Karst water caused by coal mining in northern China. Mine Water and the Environment, 38(3): 507-516.
doi: 10.1007/s10230-019-00606-4
|
|
|
| [13] |
He X, Lucatero D, Ridler M E, et al. 2019 Real-time simulation of surface water and groundwater with data assimilation. Advances in Water Resources, 127: 13-25.
doi: 10.1016/j.advwatres.2019.03.004
|
|
|
| [14] |
Huang X, Wang G, Liang X, et al. 2018. Hydrochemical and stable isotope (δD and δ18O) characteristics of groundwater and hydrogeochemical processes in the Ningtiaota Coalfield, Northwest China. Mine Water and the Environment, 37(1): 119-136.
doi: 10.1007/s10230-017-0477-x
|
|
|
| [15] |
Jampani M, Liedl R, Hülsmann S, et al. 2020. Hydrochemical and mixing processes controlling groundwater chemistry in a wastewater irrigated agricultural system of India. Chemosphere, 239: 124741, doi: 10.1016/j.chemosphere.2019.124741.
doi: 10.1016/j.chemosphere.2019.124741
|
|
|
| [16] |
Jayawardana J. 2020. Geochemical and isotope evidence for groundwater mineralization in a semi-arid river basin, Sri Lanka. Applied Geochemistry, 124(1-2): 104799, doi: 10.1016/j.apgeochem.2020.104799.
doi: 10.1016/j.apgeochem.2020.104799
|
|
|
| [17] |
Jhariya D C, Khan R, Thakur G S. 2016. Impact of mining activity on water resource:An overview study. In: National Seminar on Recent Practices & Innovations in Mining Industry (RPIMI), Raipur: RPIMI, 271-277.
|
|
|
| [18] |
Kadam A, Wagh V, Patil S, et al. 2021a. Seasonal variation in groundwater quality and beneficial use for drinking, irrigation, and industrial purposes from Deccan Basaltic Region, Western India. Environmental Science and Pollution Research, 28(20): 26082-26104.
doi: 10.1007/s11356-020-12115-x
|
|
|
| [19] |
Kadam A, Wagh V, James J, et al. 2021b. Integrated approach for the evaluation of groundwater quality through hydro geochemistry and human health risk from Shivganga river basin, Pune, Maharashtra, India. Environmental Science and Pollution Research, 29(2), 4311-4333.
doi: 10.1007/s11356-021-15554-2
|
|
|
| [20] |
Lei Y Z, Cao S K, Cao G C, et al. 2021. Hydrological process tracing study of the alpine inland basin of the Tibetan Plateau based on hydrogen and oxygen stable isotopes and hydrochemistry. Geographical Research, 40(5): 1239-1252. (in Chinese)
|
|
|
| [21] |
Li S J, Han X, Wang W H, et al. 2022. Hydrochemical characteristics and controlling factors of surface water and groundwater in Wuding River Basin. Environmental Science, 43(1): 220-229. (in Chinese)
|
|
|
| [22] |
Miao L T, Xiao C Y, Duan Z H, et al. 2021. Coupling characteristics and intelligent integration technology of coal-overlying rock-groundwater-ecological environment in Yu-Shen-Fu mining area in the middle reaches of the Yellow River. Journal of China Coal Society, 46(5): 1521-1531. (in Chinese)
|
|
|
| [23] |
Mirzavand M, Ghasemieh H, Javad S, et al. 2020. Delineating the source and mechanism of groundwater salinization in crucial declining aquifer using multichemo-isotopes approaches. Journal of Hydrology, 586: 124877, doi: 10.1016/j.jhydrol.2020.124877.
doi: 10.1016/j.jhydrol.2020.124877
|
|
|
| [24] |
Nofal S, Travi Y, Cognard-Plancq A L, et al. 2019. Impact of infiltrating irrigation and surface water on a Mediterranean alluvial aquifer in France using stable isotopes and hydrochemistry, in the context of urbanization and climate change. Hydrogeology Journal, 27(6): 2211-2229.
doi: 10.1007/s10040-019-01989-y
|
|
|
| [25] |
Qu S, Wang G, Shi Z, et al. 2018. Using stable isotopes (δD, δ18O, δ34S, and 87Sr/86Sr) to identify sources of water in abandoned mines in the Fengfeng coal mining district, northern China. Hydrogeology Journal, 26(5): 1443-1453.
doi: 10.1007/s10040-018-1803-5
|
|
|
| [26] |
Rezaei A, Javadi H, Rezaeian M, et al. 2018. Heating mechanism of the Abgarm-Avaj geothermal system observed with hydrochemistry, geothermometry, and stable isotopes of thermal spring waters, Iran. Environmental Earth Sciences, 77(18): 1-16.
doi: 10.1007/s12665-017-7169-5
|
|
|
| [27] |
Singh U K, Ramanathan A L, Subramanian V. 2018. Groundwater chemistry and human health risk assessment in the mining region of East Singhbhum, Jharkhand, India. Chemosphere, 204: 501-513.
doi: 10.1016/j.chemosphere.2018.04.060
|
|
|
| [28] |
Song H W, Meng Y C, Jiang F T, et al. 2021. Isotope characteristics of surface water and groundwater in the middle reaches of Yarlung Zangbo River and their indicators. Journal of Arid Land Resources and Environment, 35(7): 122-128. (in Chinese)
|
|
|
| [29] |
Sun C, Chen W. 2018. Relationship between groundwater and surface water based on environmental isotope and hydro-chemistry in upperstream of the Haihe River Basin. Scientia Geographica Sinica, 38(5): 790-799. (in Chinese)
|
|
|
| [30] |
Sun P F, Yi Q T, Xu G Q. 2014. Characteristics of water chemistry and their influencing factors in subsidence waters in the Huainan and Huaibei mining areas, Anhui Province. Journal of China Coal Society, 39(7): 1345-1353. (in Chinese)
|
|
|
| [31] |
Svobodova K, Yellishetty M, Vojar J. 2019. Coal mining in Australia: Understanding stakeholder knowledge of mining and mine rehabilitation. Energy Policy, 126: 421-430.
doi: 10.1016/j.enpol.2018.11.042
|
|
|
| [32] |
Wagh V M, Mukate S, Muley A, et al. 2020. Study of groundwater contamination and drinking suitability in basaltic terrain of Maharashtra, India through PIG and multivariate statistical techniques. Journal of Water Supply: Research and Technology, 69(4): 398-414.
doi: 10.2166/aqua.2020.108
|
|
|
| [33] |
Wang H, Wu Q, Chen X, et al. 2020. The chemical characteristics and hydrogen and oxygen isotopic compositions of the Zhonghu mining area in Huaibei. Arabian Journal of Geosciences, 13(17): 1967-1979.
|
|
|
| [34] |
Wang L, Dong Y, Xie Y, et al. 2016. Distinct groundwater recharge sources and geochemical evolution of two adjacent sub-basins in the lower Shule River Basin, Northwest China. Hydrogeology Journal, 24(8): 1-13.
doi: 10.1007/s10040-015-1360-0
|
|
|
| [35] |
Wu X J, Li H E, Dong Y. 2016. Quantitative recognition of coal mining on water resources influence: A case of Kuye River in northern Shaanxi. Arid Land Geography, 39(2): 246-253. (in Chinese)
|
|
|
| [36] |
Yang Z, Zhou Y, Wenninger J, et al. 2017. Groundwater and surface-water interactions and impacts of human activities in the Hailiutu catchment, northwest China. Hydrogeology Journal, 25(5): 1341-1355.
doi: 10.1007/s10040-017-1541-0
|
|
|
| [37] |
Zeng D, Wu J K, Li H Y, et al. 2020. Hydrogen and oxygen isotopes in precipitation in the arid regions of Northwest China: A review. Arid Zone Research, 37(4): 857-869. (in Chinese)
|
|
|
|
Viewed |
|
|
|
Full text
|
|
|
|
|
Abstract
|
|
|
|
|
Cited |
|
|
|
|
| |
Shared |
|
|
|
|
| |
Discussed |
|
|
|
|