| Research article |
|


|
|
|
| Probability and spatiotemporal dynamics of active fire occurrence in Inner Mongolia, China from 2000 to 2022 |
JIA Xu1, WEI Baocheng2,3,*( ), ZHANG Zhijie4, CHEN Lulu2, LIU Mengna2, ZHAO Yiming2, WANG Jing1 ), ZHANG Zhijie4, CHEN Lulu2, LIU Mengna2, ZHAO Yiming2, WANG Jing1 |
1College of Resources and Environmental Economics, Inner Mongolia University of Finance and Economics, Hohhot 010051, China
2College of Geographical Science, Inner Mongolia Normal University, Hohhot 010022, China
3Key Laboratory of Mongolian Plateau's Climate System at Universities of Inner Mongolia Autonomous Region, Inner Mongolia Normal University, Hohhot 010022, China
4Hohhot Meteorological Observatory, Hohhot 010020, China |
|
|
|
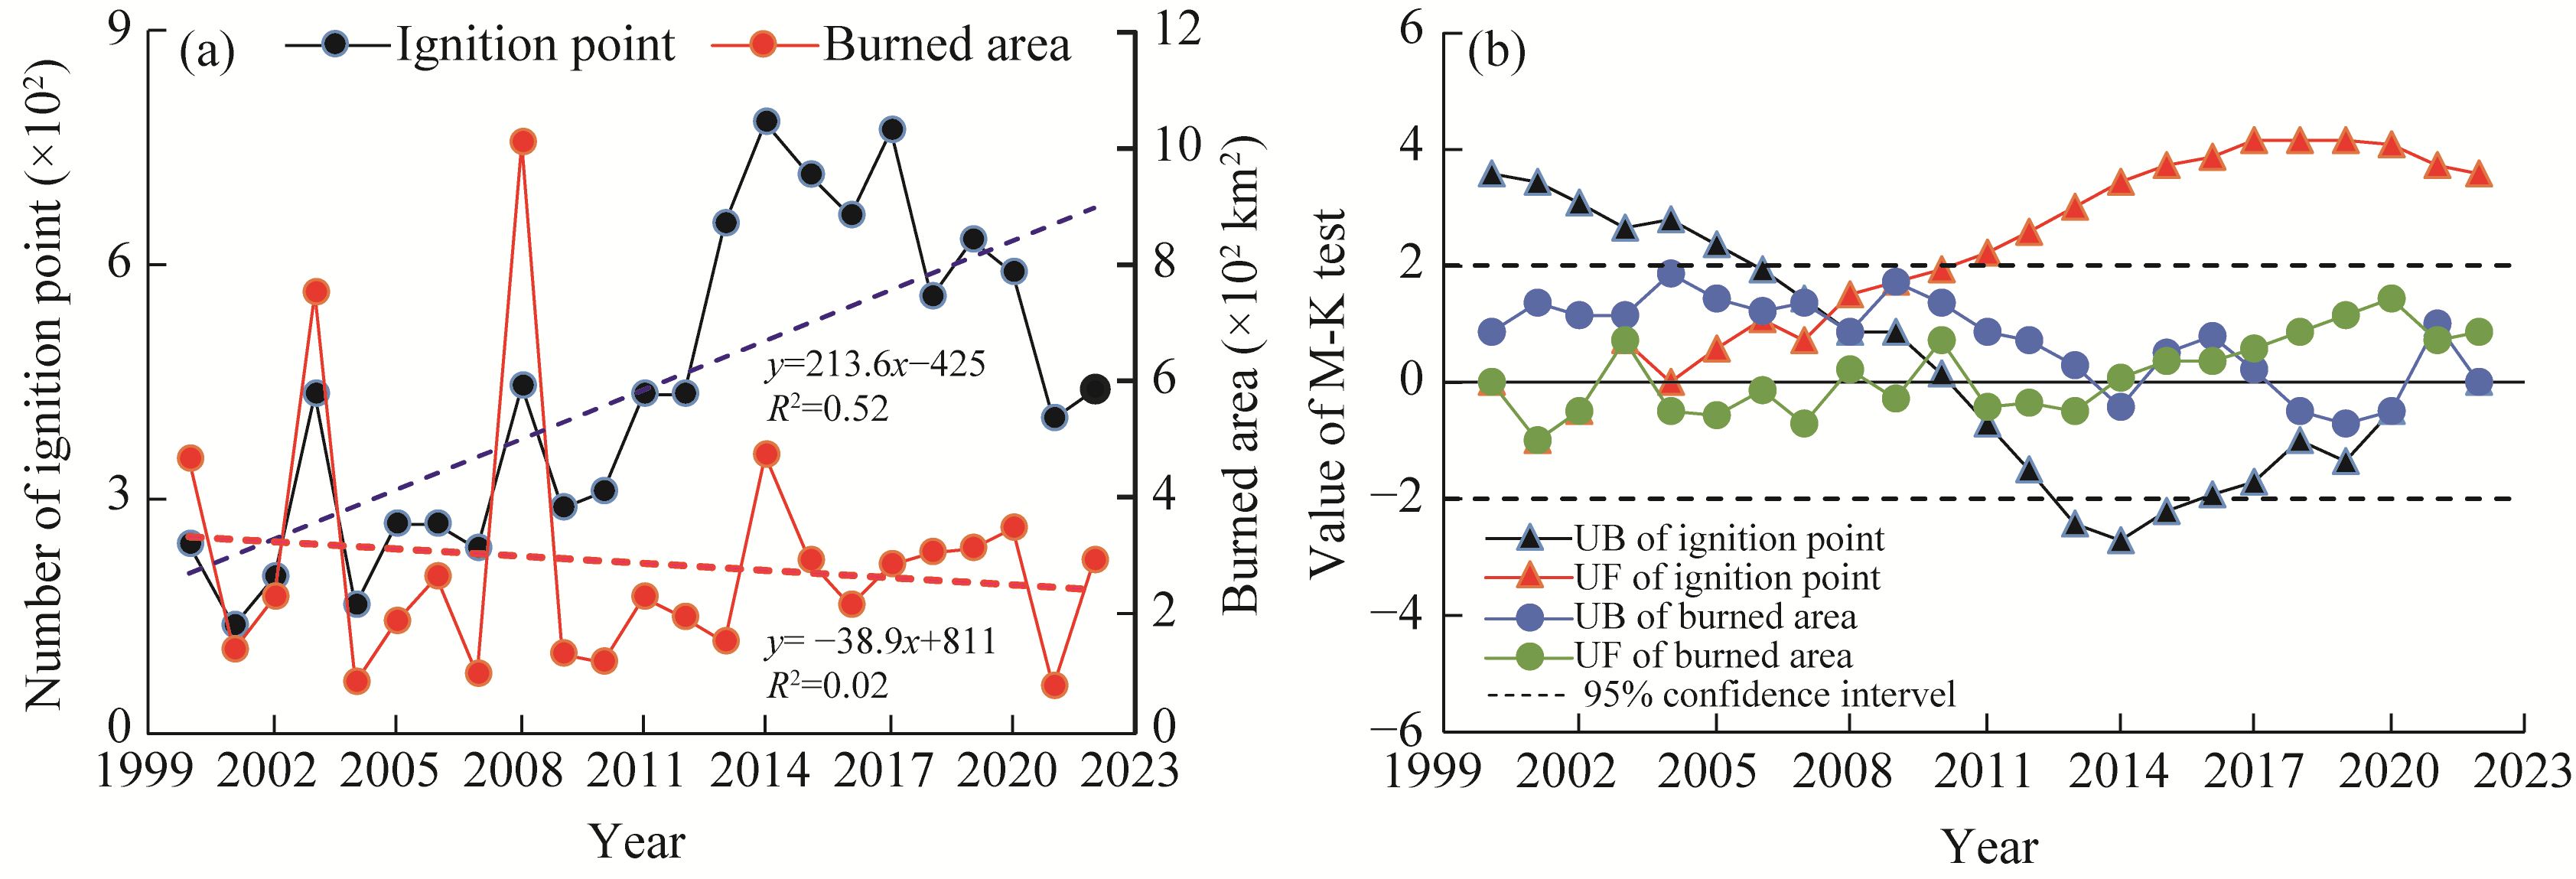
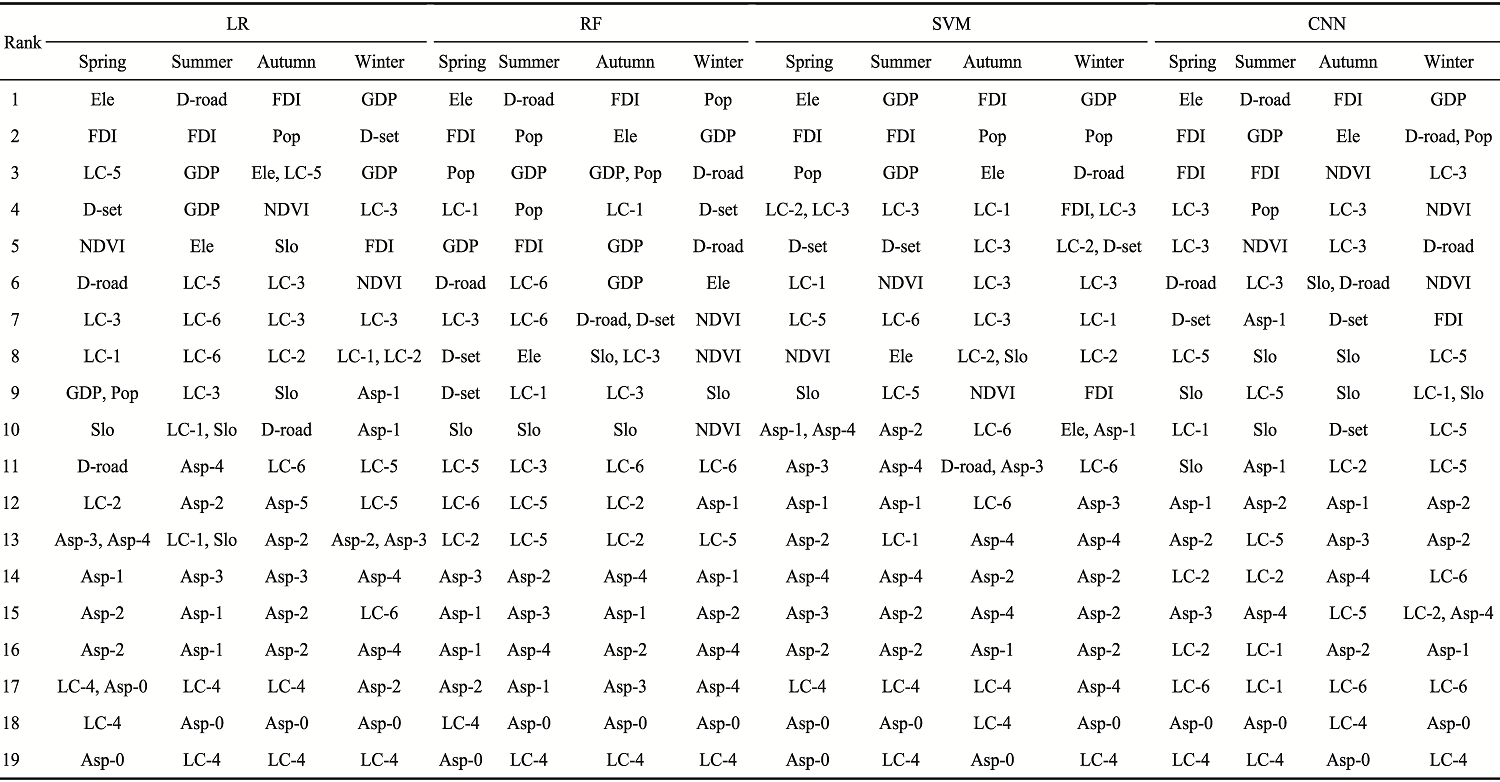
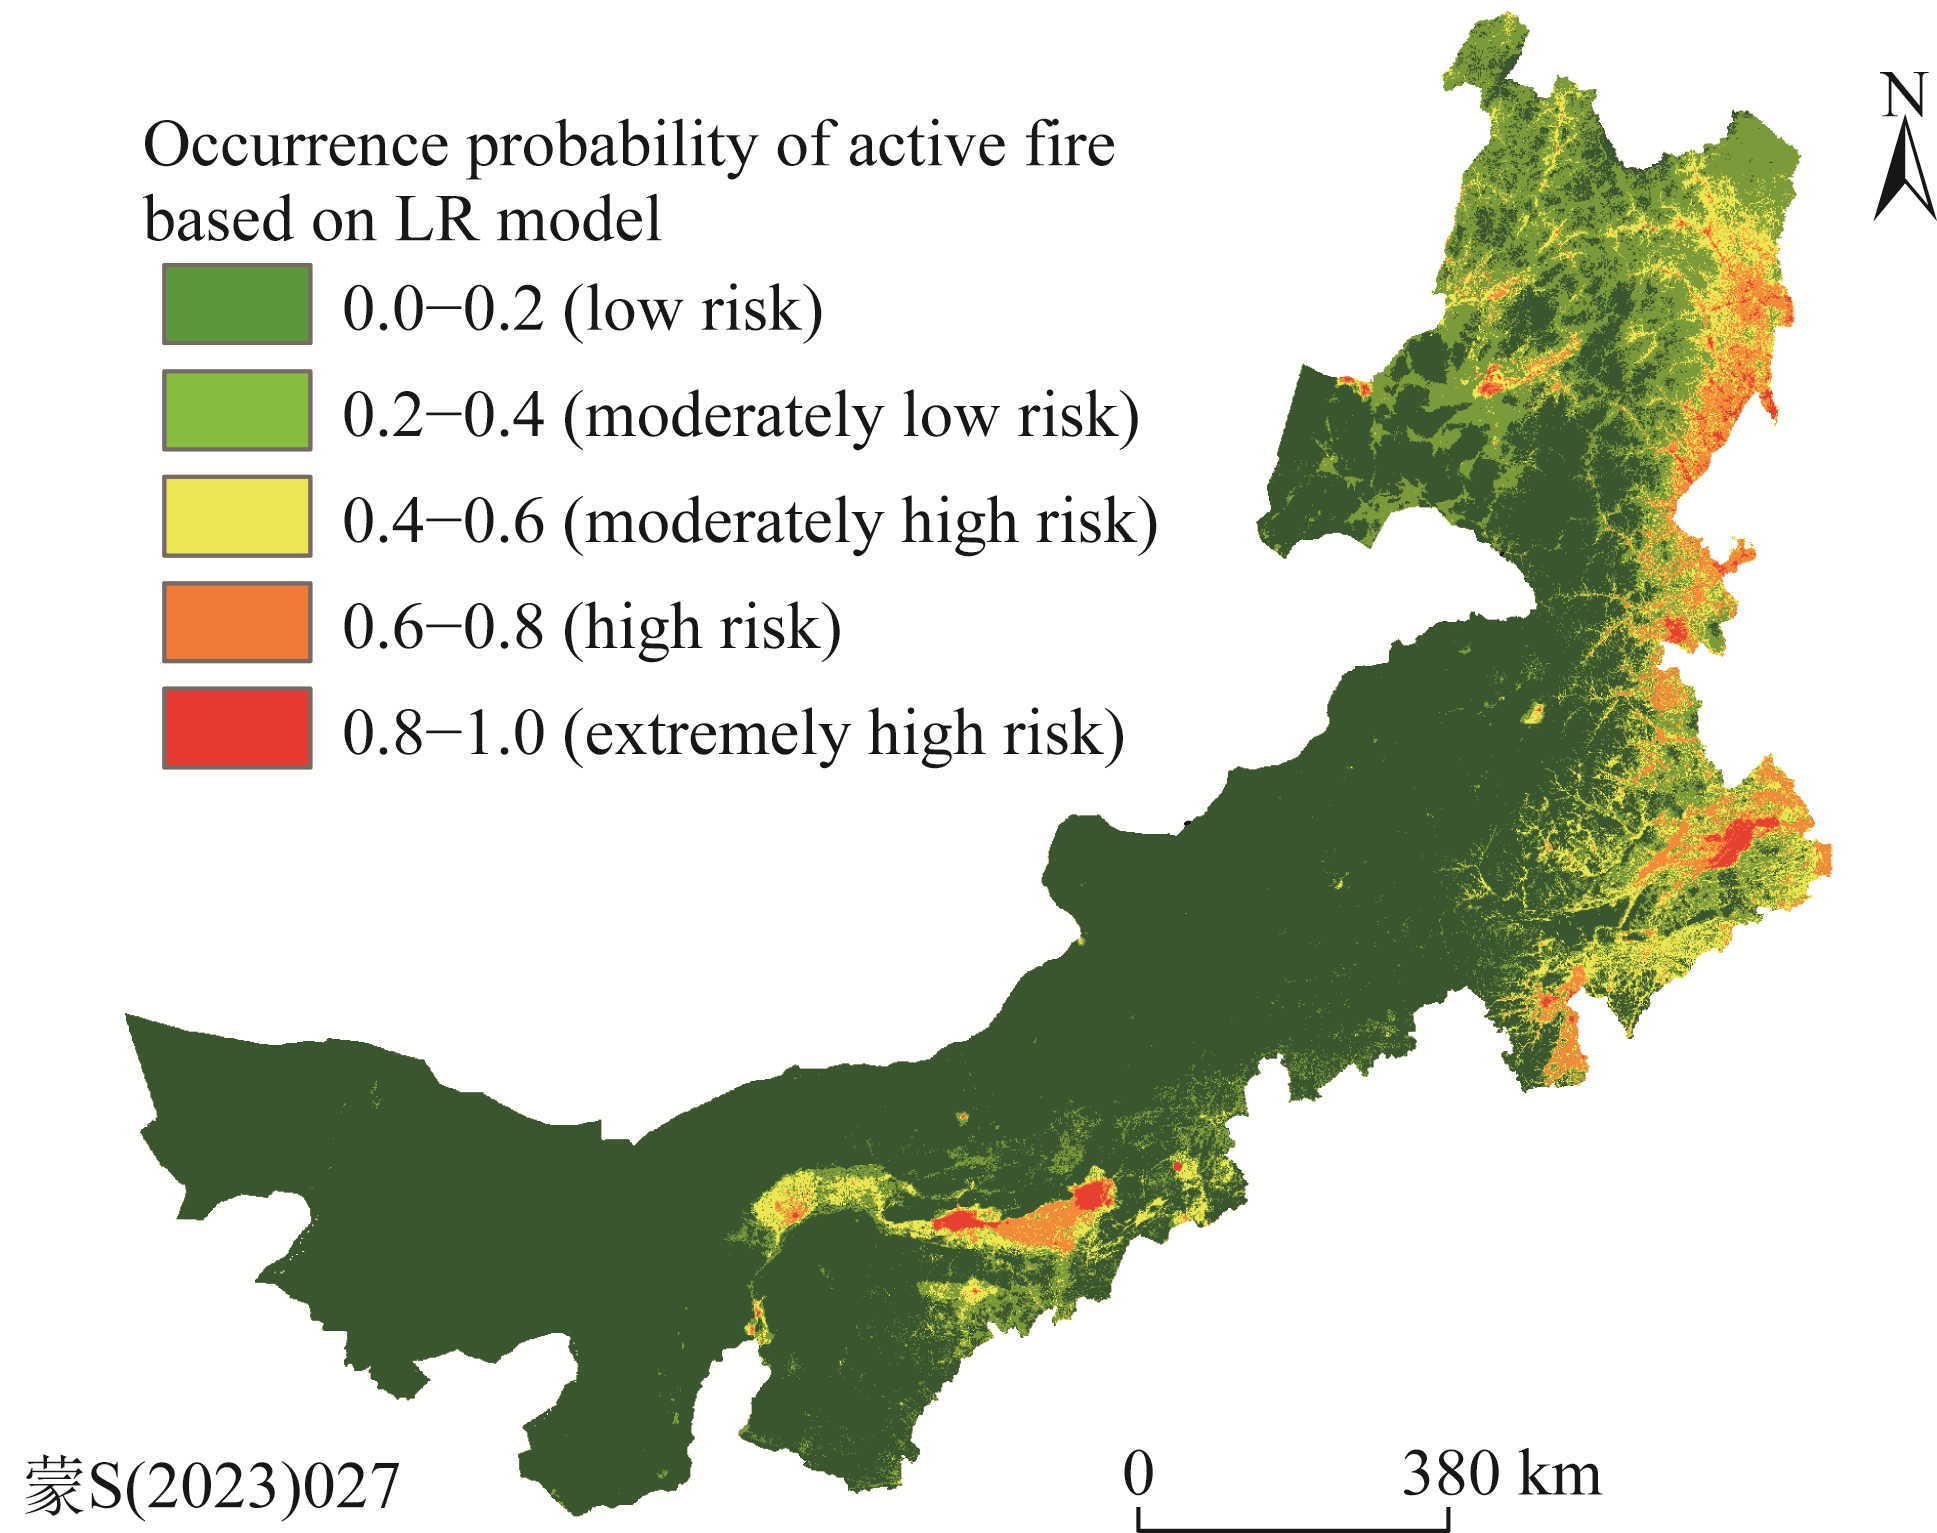
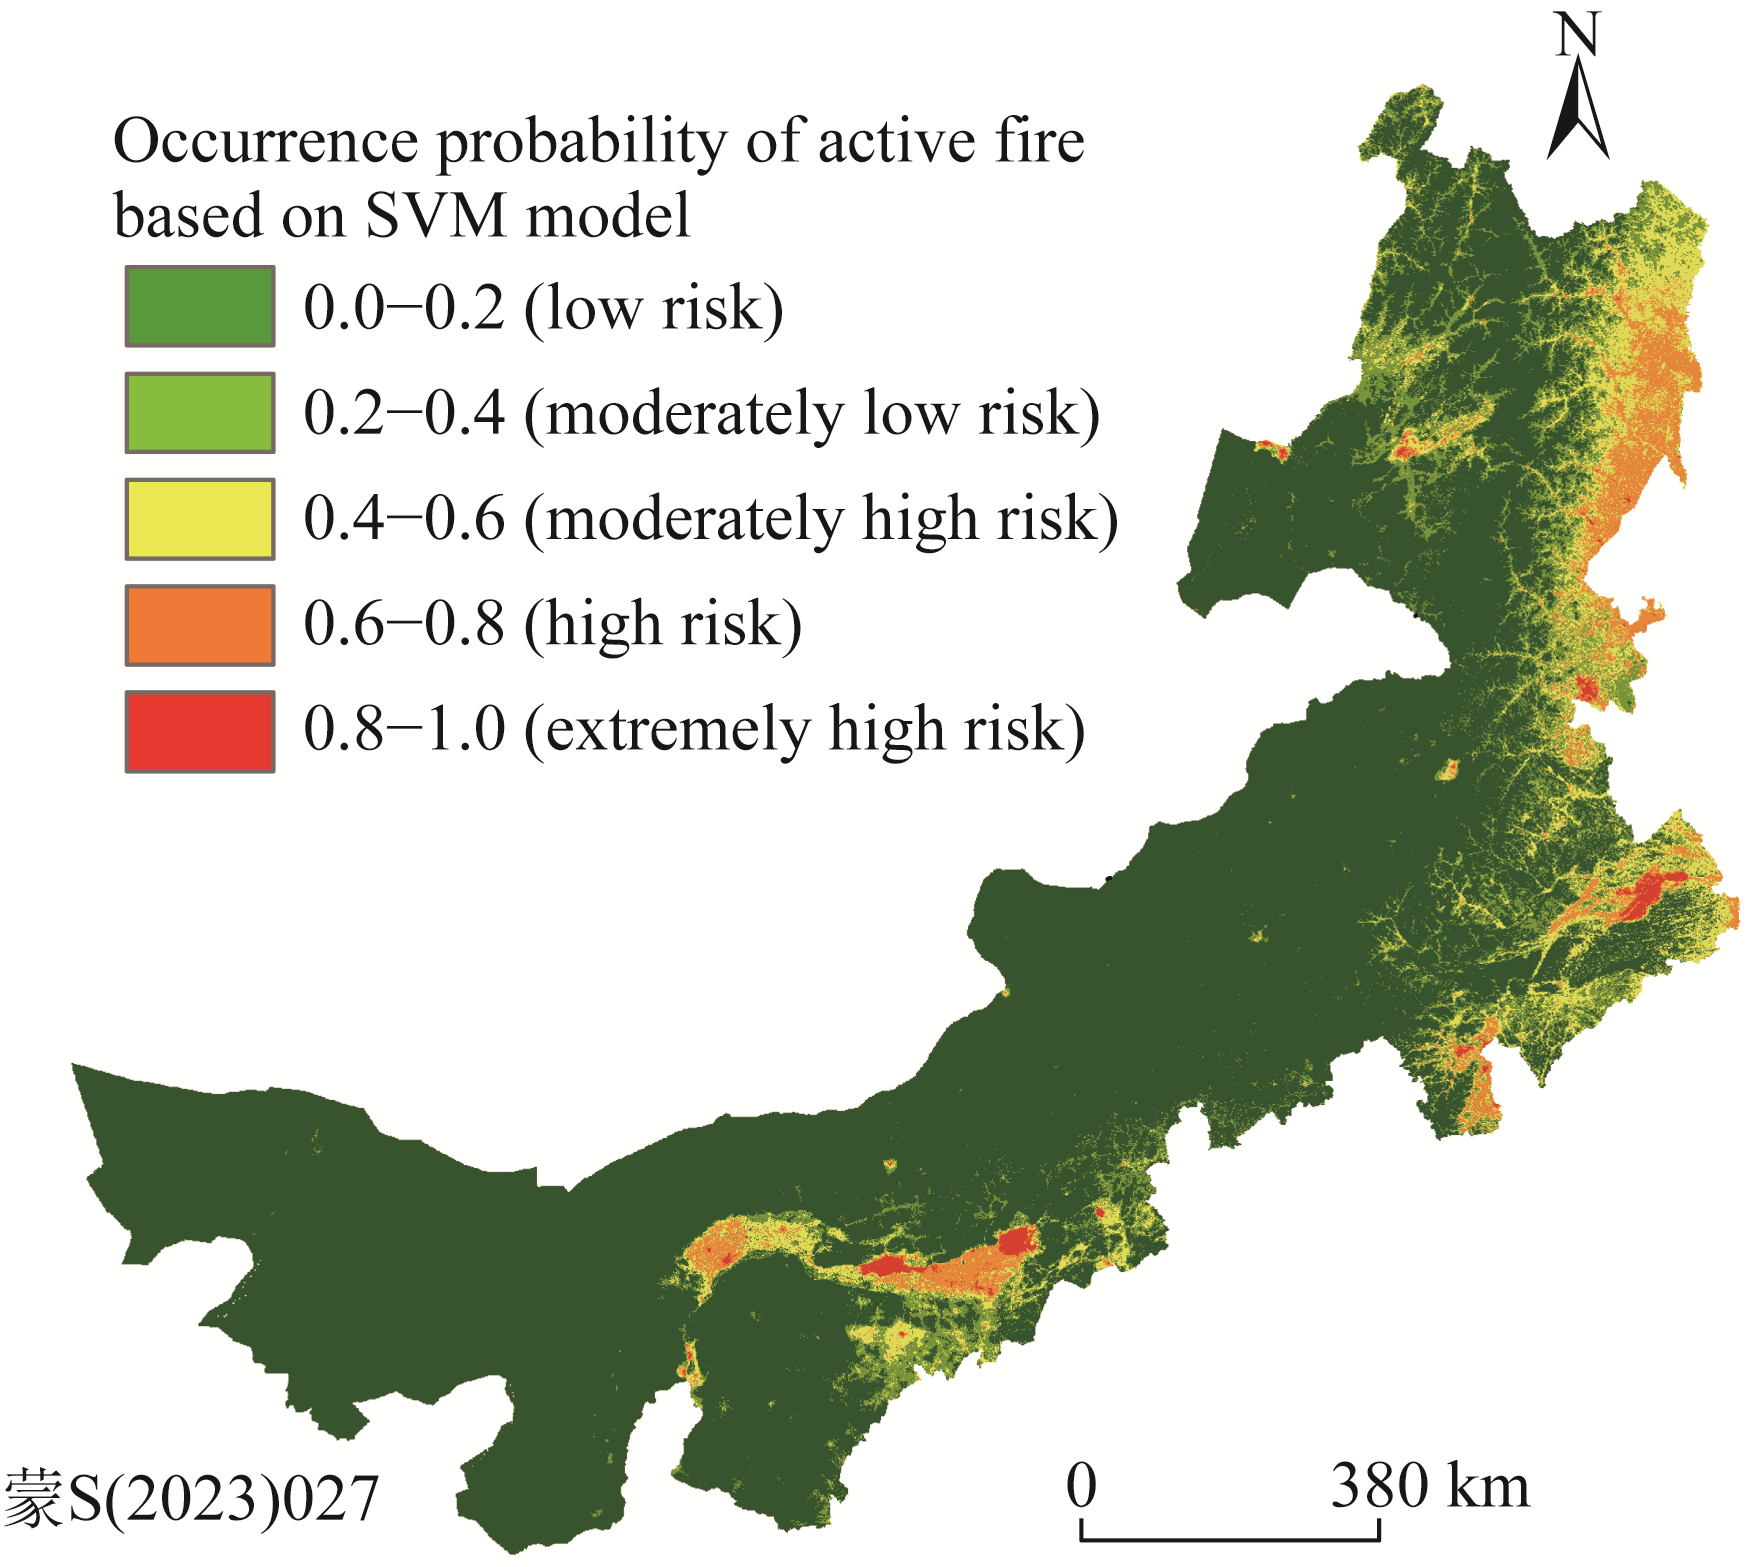
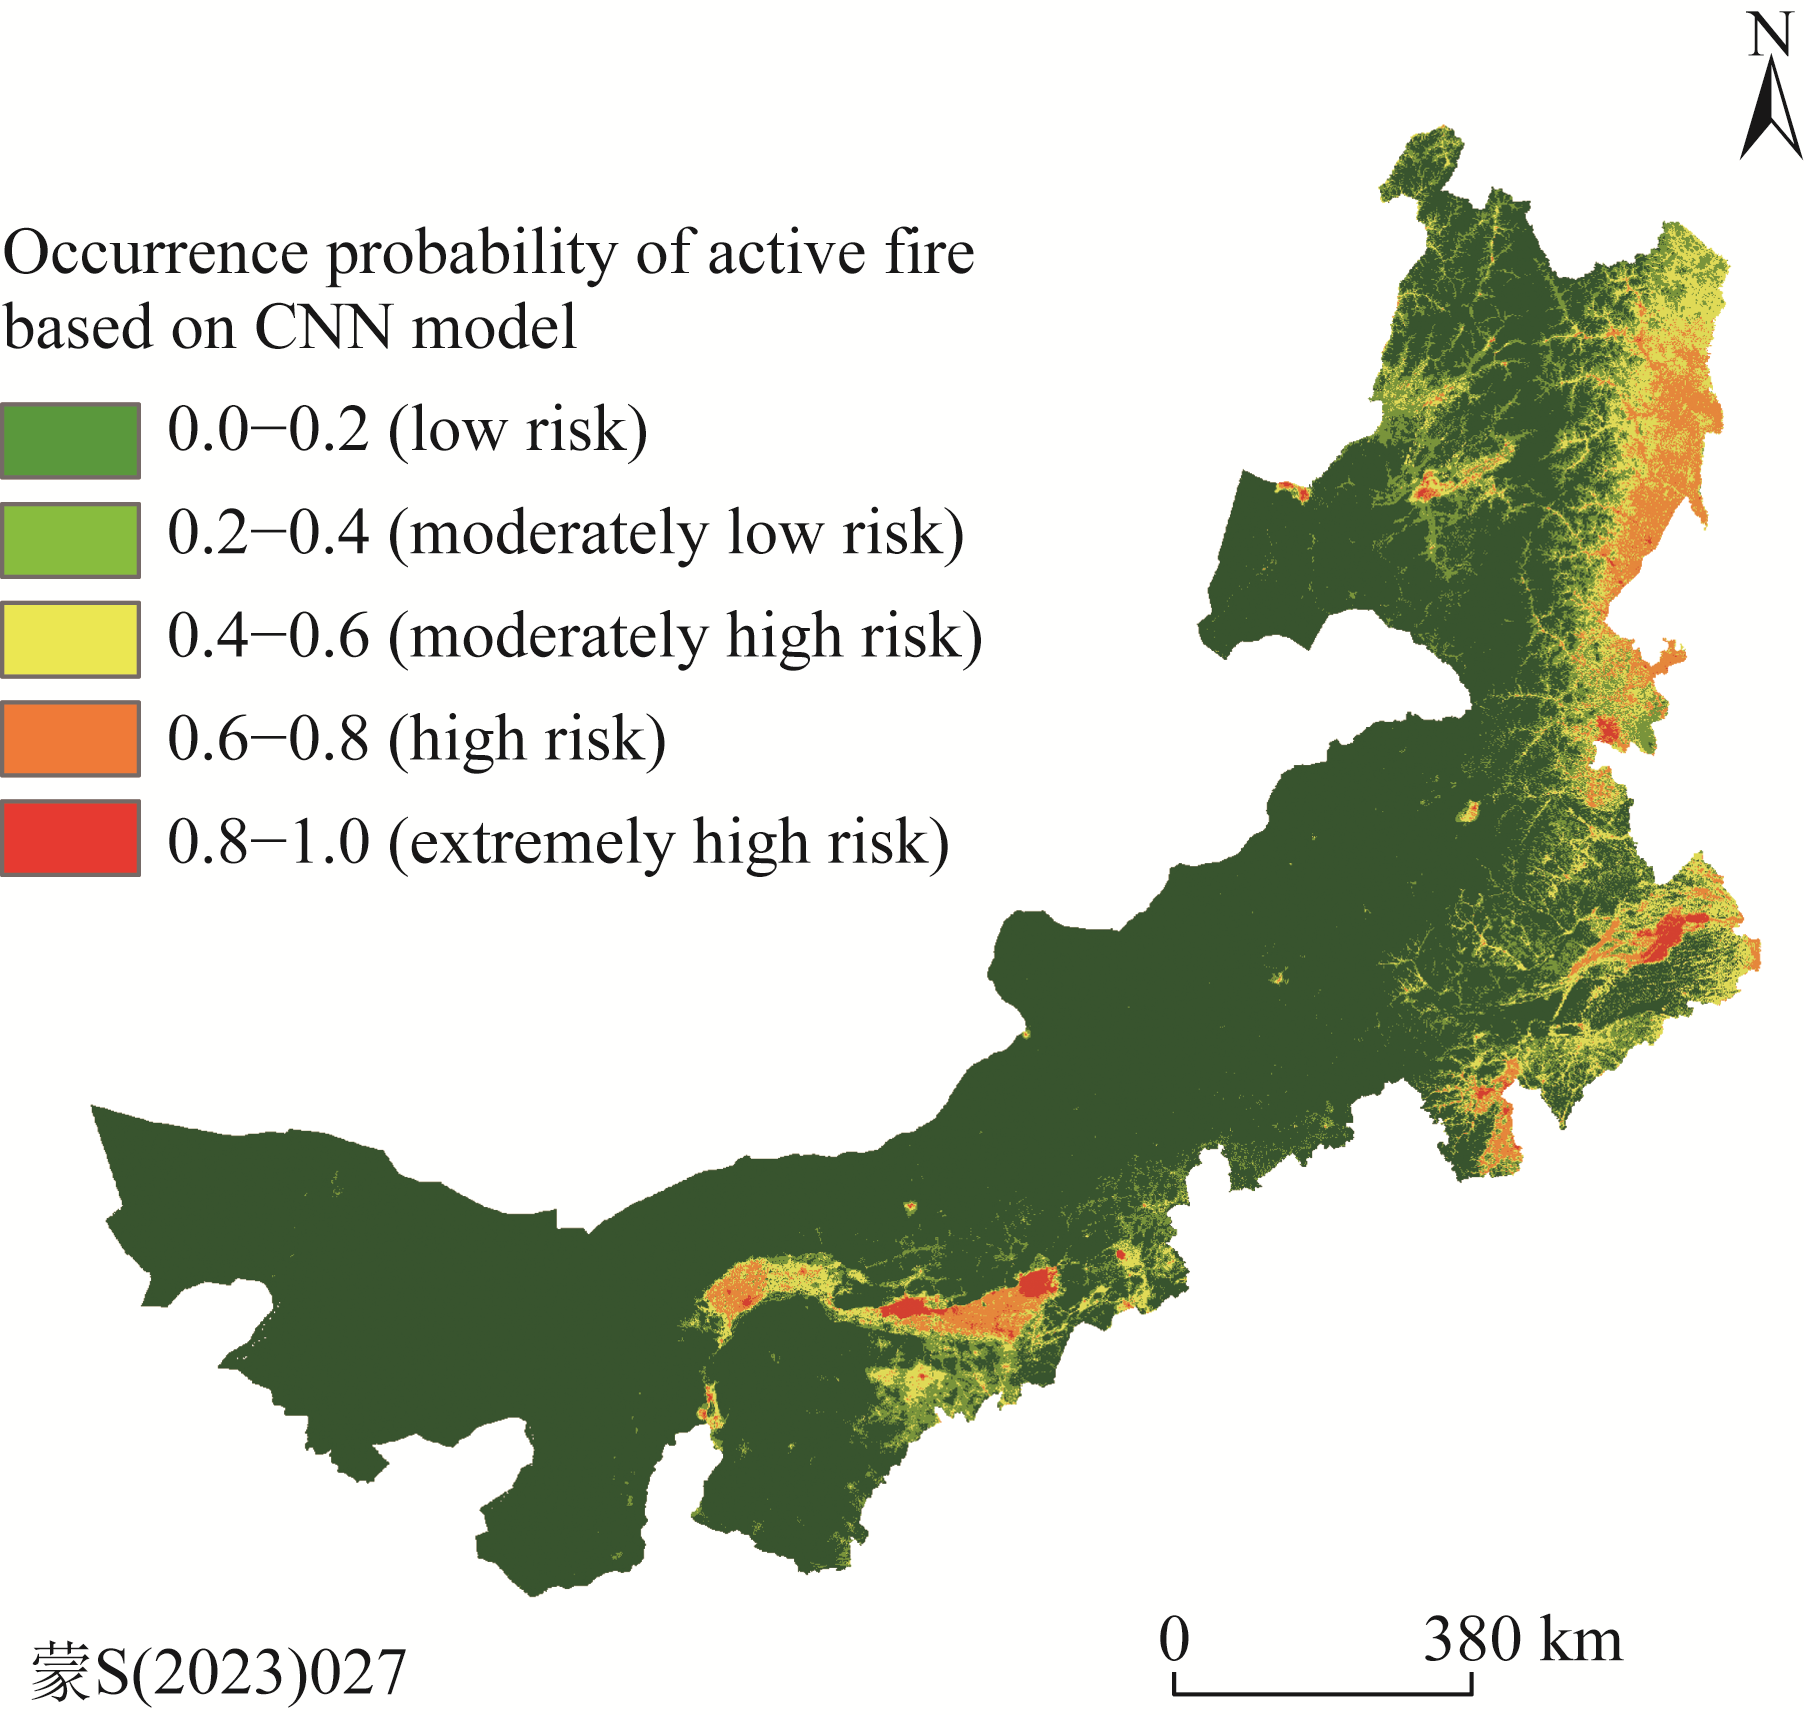
Abstract Fires are one of the most destructive natural disasters and have serious long-term effects on the environment, economy, and human health. In Inner Mongolia Autonomous Region, China, frequent fire disturbance occurs due to the intensification of climate change and human activities. It is crucial to understand the fire regime and estimate the probability of regional fire occurrence and reducing fire losses. However, most studies have primarily focused on the dynamic changes, probability of occurrence, and driving mechanisms of wildfires in the grassland and forest land ecosystems in Inner Mongolia, while insufficient research has been conducted on the spatiotemporal variations in active fires and their impact on the wildfire risk in forest land and grassland. Therefore, in this study, we analyzed the active fire regime based on Moderate Resolution Imaging Spectroradiometer (MODIS) thermal anomalies and burned area products from 2000 to 2022. Combined with climate, topographic, landscape, anthropogenic, and vegetation datasets, logistic regression (LR), support vector machine (SVM), random forest (RF), and convolutional neural network (CNN) models were chosen to estimate the probability of active fire occurrence at the seasonal timescale. The results revealed that: (1) a total of 100,343 active fires occurred in Inner Mongolia and the burned area reached 6.59×10⁴ km². The number of ignition point exhibited a significant increasing trend, while the burned area exhibited a nonsignificant decreasing trend; (2) four active fire belts were detected, namely, the Hetao-Tumochuan Plain fire belt, Xiliao River Plain fire belt, Songnen Plain fire belt, and Hailar River Eroded Plain fire belt. The centroid of the active fires has shifted 456.4 km toward the southwest; (3) RF model achieved the highest accuracy in estimating the probability of active fire occurrence, followed by CNN, and LR and SVM models had lower accuracies; and (4) the distribution of the high and extremely high fire risk areas largely aligned with the four fire belts. The probability of active fire occurrence was the highest in spring, followed by that in autumn, and it gradually decreased in summer and winter. Our results revealed active fires migrated to the southwest and ignition sources increased, despite reduction of the burned area was not significant. The RF model outperformed the other models in predicting the probability of active fire occurrence. These findings contribute to future fire prevention and prediction in Inner Mongolia.
|
|
Received: 01 March 2025
Published: 31 August 2025
|
|
Corresponding Authors:
*WEI Baocheng (E-mail: nsdwbc@126.com)
|
|
|
| [1] |
Aldersley A, Murray S J, Cornell S E. 2011. Global and regional analysis of climate and human drivers of wildfire. Science of the Total Environment, 409(18): 3472-3481.
|
|
|
| [2] |
Andela N, Morton D, Giglio L, et al. 2017. A human-driven decline in global burned area. Science, 356(6345): 1356-1362.
doi: 10.1126/science.aal4108
pmid: 28663495
|
|
|
| [3] |
Belarbi F, Hassini A, Benamara N K. 2024. A novel approach based on convolutional neural networks ensemble for fire detection. Signal, Image and Video Processing, 18: 8805-8818.
|
|
|
| [4] |
Chang C, Chang Y, Xiong Z P, et al. 2023. Predicting grassland fire-occurrence probability in Inner Mongolia Autonomous Region, China. Remote Sensing, 15(12): 2999, doi: 10.3390/rs15122999.
|
|
|
| [5] |
Chao L M, Bao Y L, Zhang J Q, et al. 2023. Quantitative assessment of fire occurrence dead fuel index threshold and spatio-temporal variation in different grassland types of China-Mongolia border area. Journal of Geographical Sciences, 33(8): 1631-1659.
doi: 10.1007/s11442-023-2146-2
|
|
|
| [6] |
Chao Y, Luo C F, Shu L F, et al. 2020. A review on wildfire studies in the context of global change. Acta Ecologica Sinica, 40(2): 385-401. (in Chinese)
|
|
|
| [7] |
Chen K, Ge G, Bao G, et al. 2022. Impact of extreme climate on the NDVI of different steppe areas in Inner Mongolia, China. Remote Sensing, 14(7): 1530, doi: 10.3390/rs14071530.
|
|
|
| [8] |
Chen X T, Kang S C, Hu Y L, et al. 2023. Temporal and spatial analysis of vegetation fire activity in the circum-Arctic during 2001-2020. Research in Cold and Arid Regions, 15(1): 48-56.
|
|
|
| [9] |
Duan Q, Liu R G, Chen J L, et al. 2024. Burned area detection from a single satellite image using an adaptive thresholds algorithm. International Journal of Digital Earth, 17(1): 2376275, doi: 10.1080/17538947.2024.2376275.
|
|
|
| [10] |
Earl N, Simmonds I. 2018. Spatial and temporal variability and trends in 2001-2016 global fire activity. Journal of Geophysical Research: Atmospheres, 123(5): 2524-2536.
|
|
|
| [11] |
Elia M, D'Este M, Ascoli D, et al. 2020. Estimating the probability of wildfire occurrence in Mediterranean landscapes using Artificial Neural Networks. Environmental Impact Assessment Review, 85: 106474, doi: 10.1016/j.eiar.2020.106474.
|
|
|
| [12] |
Ellis T M, Bowman D M J S, Jain P, et al. 2021. Global increase in wildfire risk due to climate-driven declines in fuel moisture. Global Change Biology, 28(4): 1544-1559.
|
|
|
| [13] |
Fawagreh K, Gaber M M, Elyan E. 2014. Random forests: from early developments to recent advancements. Systems Science & Control Engineering, 2(1): 602-609.
|
|
|
| [14] |
Gao B, Shan Y L, Liu X Y, et al. 2024. Prediction and driving factors of forest fire occurrence in Jilin Province, China. Journal of Forestry Research, 35(1): 21, doi: 10.1007/s11676-023-01663-w.
|
|
|
| [15] |
Giglio L, Humber M, Hall J V, et al. 2022. Collection 6.1 MODIS burned area product user's guide version 1.1. In: NASA Technical Report. University of Maryland, Maryland, USA.
|
|
|
| [16] |
Giglio L, Schroeder W, Hall J V, et al. 2021. MODIS collection 6 and collection 6.1 active fire product user's guide version 1.0. In: NASA Technical Report. University of Maryland. Maryland, USA.
|
|
|
| [17] |
Guan R H, Jiao K W, Chang Y, et al. 2025. Spatiotemporal dynamics of wildland urban interface distribution patterns and high fire occurrence areas in Heilongjiang Province. Acta Ecologica Sinica, 45(13): 1-11. (in Chinese)
|
|
|
| [18] |
Haas O, Prentice I C, Harrison S P. 2022. Global environmental controls on wildfire burnt area, size, and intensity. Environmental Research Letters, 17(6): 065004, doi: 10.1088/1748-9326/ac6a69.
|
|
|
| [19] |
Hayes J P. 2020. Fire suppression and the wildfire paradox in contemporary china: Policies, resilience, and effects in Chinese fire regimes. Human Ecology, 49(1): 19-32.
|
|
|
| [20] |
He R, Lu H, Jin Z Z, et al. 2023. Construction of forest fire prediction model and driving factors analysis based on random forests algorithm in Southwest China. Acta Ecologica Sinica, 43(22): 9356-9370. (in Chinese)
|
|
|
| [21] |
Jain P, Barber Q E, Taylor S W, et al. 2024. Drivers and impacts of the record breaking 2023 wildfire season in Canada. Nature Communications, 15(1): 6764, doi: 10.1038/s41467-024-51154-7.
|
|
|
| [22] |
Jia X, Gao Y, Wei B C, et al. 2019. Risk assessment and regionalization of fire disaster based on analytic hierarchy process and MODIS data: A case study of Inner Mongolia, China. Sustainability, 11(22): 6263-6279.
|
|
|
| [23] |
Jones M W, Kelley D I, Burton C A, et al. 2024. State of wildfires 2023-2024. Earth System Science Data, 16(8): 3601-3685.
|
|
|
| [24] |
Kiely L, Neyestani S E, Binte-Shahid S, et al. 2024. California case study of wildfires and prescribed burns: PM2.5 emissions, concentrations, and implications for human health. Environmental Science & Technology, 58(12): 5210-5219.
|
|
|
| [25] |
Li M L, Wu Y D, Liu Y L, et al. 2024. Study on the driving factors of the spatiotemporal pattern in forest lightning fires and 3D fire simulation based on cellular automata. Forests, 15(11): 1857, doi: 10.3390/f15111857.
|
|
|
| [26] |
Li S X, Zhang F Q, Lin H F. 2023. Research on forest fire risk evaluation based on machine learning algorithm. Journal of Nanjing Forestry University, 47(5): 49-56. (in Chinese)
|
|
|
| [27] |
Li Y P, Zhao J J, Guo X Y, et al. 2017. The influence of land use on the grassland fire occurrence in the northeastern Inner Mongolia Autonomous Region, China. Sensors, 17(3): 437, doi: 10.3390/s17030437.
|
|
|
| [28] |
Liu H X, Qian Y L, Kong J J, et al. 2023a. Temporal and spatial variations of vegetation fires in Inner Mongolia from 2003 to 2019 based on FIRMS_MODIS. Forestry Science and Technology Information, 55(1): 1-8. (in Chinese)
|
|
|
| [29] |
Liu L Y, Miao Z L, Wu L X. 2022. Spatial-temporal variability of amazon tropical rainforest fire based on MODIS data. Remote Sensing Technology and Application, 37(3): 721-730. (in Chinese)
|
|
|
| [30] |
Liu W J, Guan H D, Hesp P A, et al. 2023b. Remote sensing delineation of wildfire spatial extents and post-fire recovery along a semi-arid climate gradient. Ecological Informatics, 78: 102304, doi: 10.1016/j.ecoinf.2023.102304.
|
|
|
| [31] |
MacCarthy J, Tyukavina A, Weisse M J, et al. 2024. Extreme wildfires in Canada and their contribution to global loss in tree cover and carbon emissions in 2023. Global Change Biology, 30(6): e17392, doi: 10.1111/gcb.17392.
|
|
|
| [32] |
McNorton J R, Di Giuseppe F. 2024. A global fuel characteristic model and dataset for wildfire prediction. Biogeosciences, 21(1): 279-300.
|
|
|
| [33] |
Milanović S, Marković N, Pamučar D, et al. 2020. Forest fire probability mapping in eastern Serbia: Logistic regression versus random forest method. Forests, 12(1): 5, doi: 10.3390/f12010005.
|
|
|
| [34] |
Monjaras-Vega N A, Briones-Herrera C I, Vega-Nieva D J, et al. 2020. Predicting forest fire kernel density at multiple scales with geographically weighted regression in Mexico. Science of the Total Environment, 718: 137313, doi: 10.1016/j.scitotenv.2020.137313.
|
|
|
| [35] |
Pang Y Q, Li Y D, Feng Z K, et al. 2022. Forest fire occurrence prediction in China based on machine learning methods. Remote Sensing, 14(21): 5546, doi: 10.3390/rs14215546.
|
|
|
| [36] |
Pausas J G, Keeley J E. 2021. Wildfires and global change. Frontiers in Ecology and the Environment, 19(7): 387-395.
doi: 10.1002/fee.2359
|
|
|
| [37] |
Qarallah B, Othman Y A, Al-Ajlouni M, et al. 2022. Assessment of small-extent forest fires in semi-arid environment in Jordan using Sentinel-2 and Landsat sensors data. Forests, 14(1): 41, doi: 10.3390/f14010041.
|
|
|
| [38] |
Qin X L, Li X T, Liu S C, et al. 2020. Forest fire early warning and monitoring techniques using satellite remote sensing in China. Journal of Remote Sensing, 24(5): 511-520. (in Chinese)
|
|
|
| [39] |
Ren X H, Yu R H, Liu X Y, et al. 2022. Spatial changes and driving factors of lake water quality in Inner Mongolia, China. Journal of Arid Land, 15(2): 164-179.
|
|
|
| [40] |
Senande-Rivera M, Insua-Costa D, Miguez-Macho G. 2022. Spatial and temporal expansion of global wildland fire activity in response to climate change. Nature Communications, 13(1): 1208, doi: 10.1038/s41467-022-28835-2.
pmid: 35260561
|
|
|
| [41] |
Sharples J J, McRae R H D, Weber R O, et al. 2009. A simple index for assessing fire danger rating. Environmental Modelling & Software, 24(6): 764-774.
|
|
|
| [42] |
Sun H C, Wang W J, Liu Z H, et al. 2021. The relative importance of driving factors of wildfire occurrence across climatic gradients in the Inner Mongolia, China. Ecological Indicators, 131: 108249, doi: 10.1016/j.ecolind.2021.108249.
|
|
|
| [43] |
Touge Y, Shi K, Nishino T, et al. 2024. Spatial temporal characteristics of more than 50,000 wildfires in Japan from 1995 to 2020. Fire Safety Journal, 142: 104025, doi: 10.1016/j.firesaf.2023.104025.
|
|
|
| [44] |
Vouzoglanis C K, Reinke K J, Berelov S M, et al. 2024. Are fire intensity and burn severity associated? Advancing our understanding of FRP and NBR metrics from Himawari-8/9 and Sentinel-2. International Journal of Applied Earth Observation and Geoinformation, 127: 103673, doi: 10.1016/j.jag.2024.103673.
|
|
|
| [45] |
Wang W J, Qian C, Zhang Y, et al. 2022. Multi-time scale features of fire weather in two major forests in China during 1961-2020. Climatic and Environmental Research, 27(5): 559-577. (in Chinese)
|
|
|
| [46] |
Wei X K, Wang G J, Chen T X, et al. 2020. A spatiotemporal analysis of active fires over China during 2003-2016. Remote Sensing, 12(11): 1787, doi: 10.3390/rs12111787.
|
|
|
| [47] |
Yang J, Huang X. 2021. The 30 m annual land cover dataset and its dynamics in China from 1990 to 2019. Earth System Science Data, 13(8): 3907-3925.
doi: 10.5194/essd-13-3907-2021
|
|
|
| [48] |
Zhai J X, Li Y, Zhang B, et al. 2022. Analysis of forest fires and lightning fires in representative fire-prone countries over the world. Journal of Subtropical Resources and Environment, 17(4): 72-79. (in Chinese)
|
|
|
| [49] |
Zhang H, Jia W F, Wang Y N. 2024a. The spatiotemporal dynamics of wildfires in Inner Mongolia based on global fire atlas remote sensing data. Journal of Wildland Fire Science, 42(3): 9-15. (in Chinese)
|
|
|
| [50] |
Zhang H, Li H, Zhao P W. 2024b. Risk of forest fire occurrence in Inner Mongolia and the impact of its drivers. Acta Ecologica Sinica, 44(13): 5669-5683. (in Chinese)
|
|
|
| [51] |
Zhang H, Zhou Z D, Wang Y X. 2024c. Temporal and spatial distribution characteristics of forest fires caused by 3 main fire sources in Daxing'an Mountains, Inner Mongolia. Journal of Southwest Forestry University, 44(3): 166-174. (in Chinese)
|
|
|
| [52] |
Zhang H, Liang Y S, Ren H Y, et al. 2025. Comparing grassland fire drivers and models in Inner Mongolia using field and remote sensing data. Fire, 8(3): 93, doi: 10.3390/fire8030093.
|
|
|
| [53] |
Zhang J Y, Peng D L, Zhan C J, et al. 2024d. Deep learning based forest fire prediction model research in the Daxing'anling Mountains, Inner Mongolia. Forest Research, 37(1): 31-40. (in Chinese)
|
|
|
| [54] |
Zheng X X, Sun N, Luo F. 2024. Spatiotemporal feature of active fire occurrence on the Loess Plateau from 2001 to 2020 based on MODIS. Quaternary Sciences, 44(1): 191-200. (in Chinese)
|
|
|
|
Viewed |
|
|
|
Full text
|
|
|
|
|
Abstract
|
|
|
|
|
Cited |
|
|
|
|
| |
Shared |
|
|
|
|
| |
Discussed |
|
|
|
|