| Research article |
|


|
|
|
| Spatiotemporal variation of drought and its influential factors in the Yellow River Basin, China based on vegetation health index |
Haoriwa1,2, Zhalagahu3, ZHOU Ruiping1,2,*( ) ) |
1College of Geographical Science, Inner Mongolia Normal University, Hohhot 010022, China
2Inner Mongolia Land Use and Improvement Project Research Center, Hohhot 010022, China
3College of Desert Control Science and Engineering, Inner Mongolia Agricultural University, Hohhot 010022, China |
|
|
|
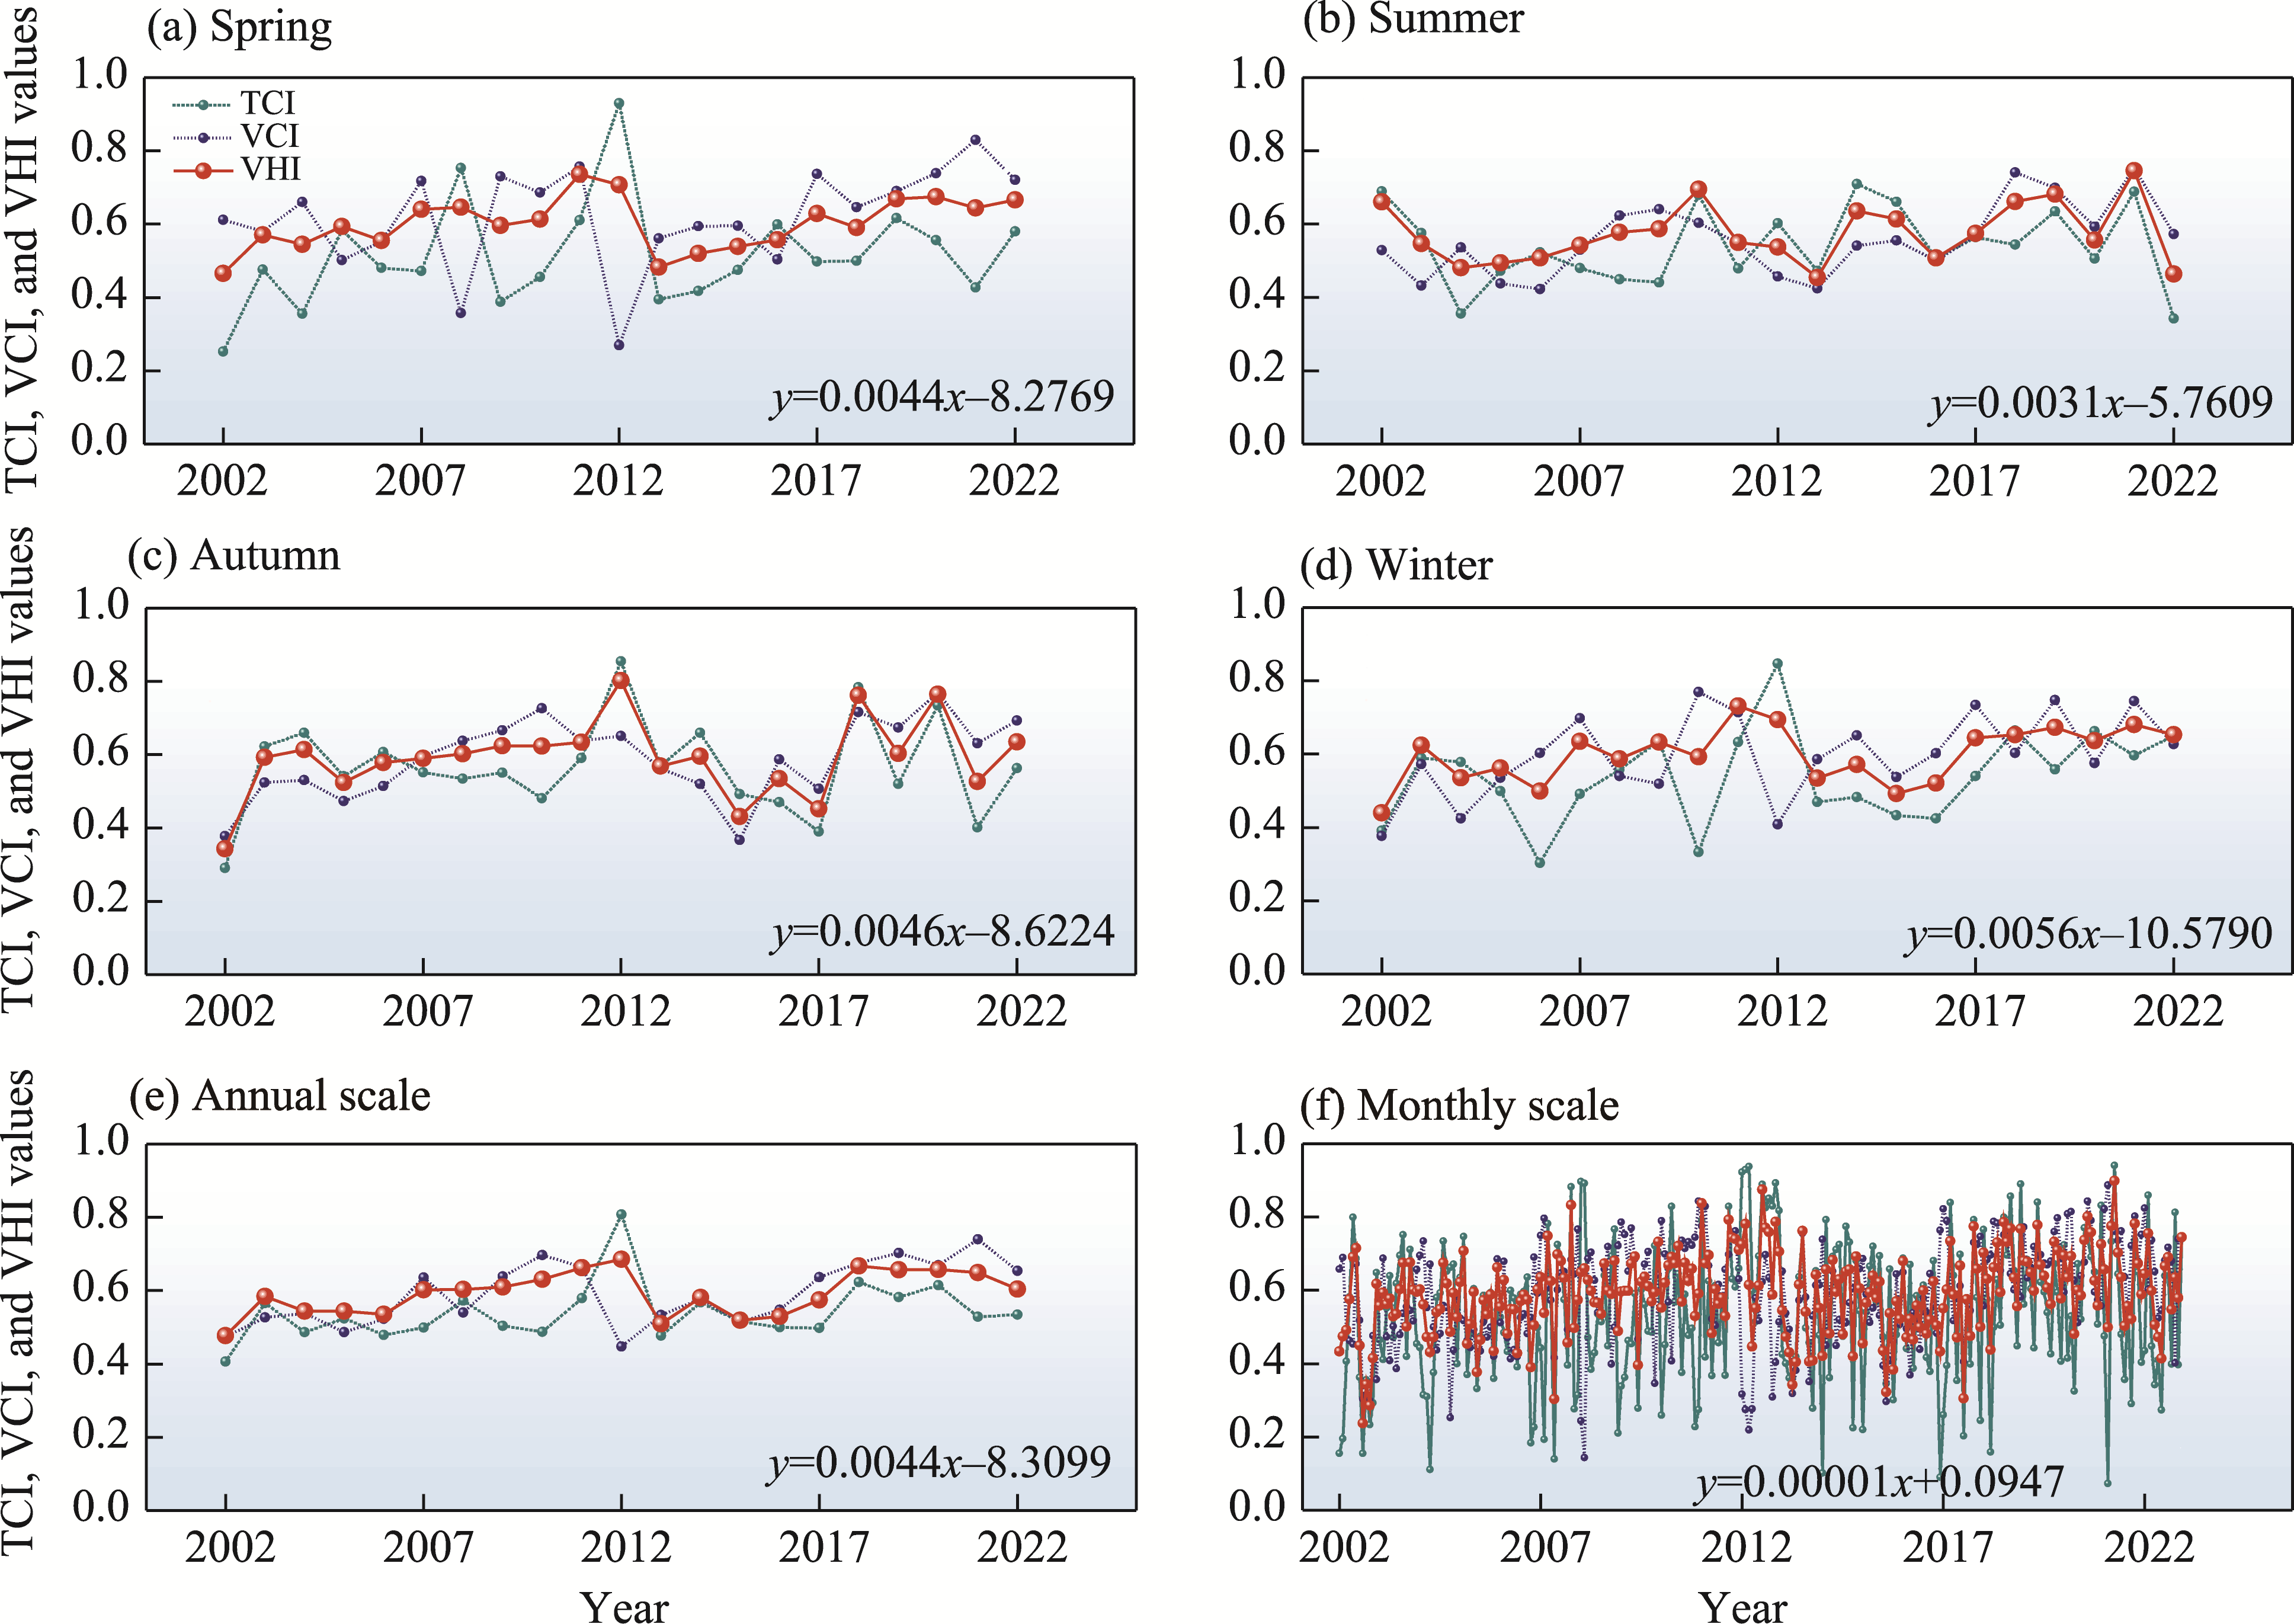
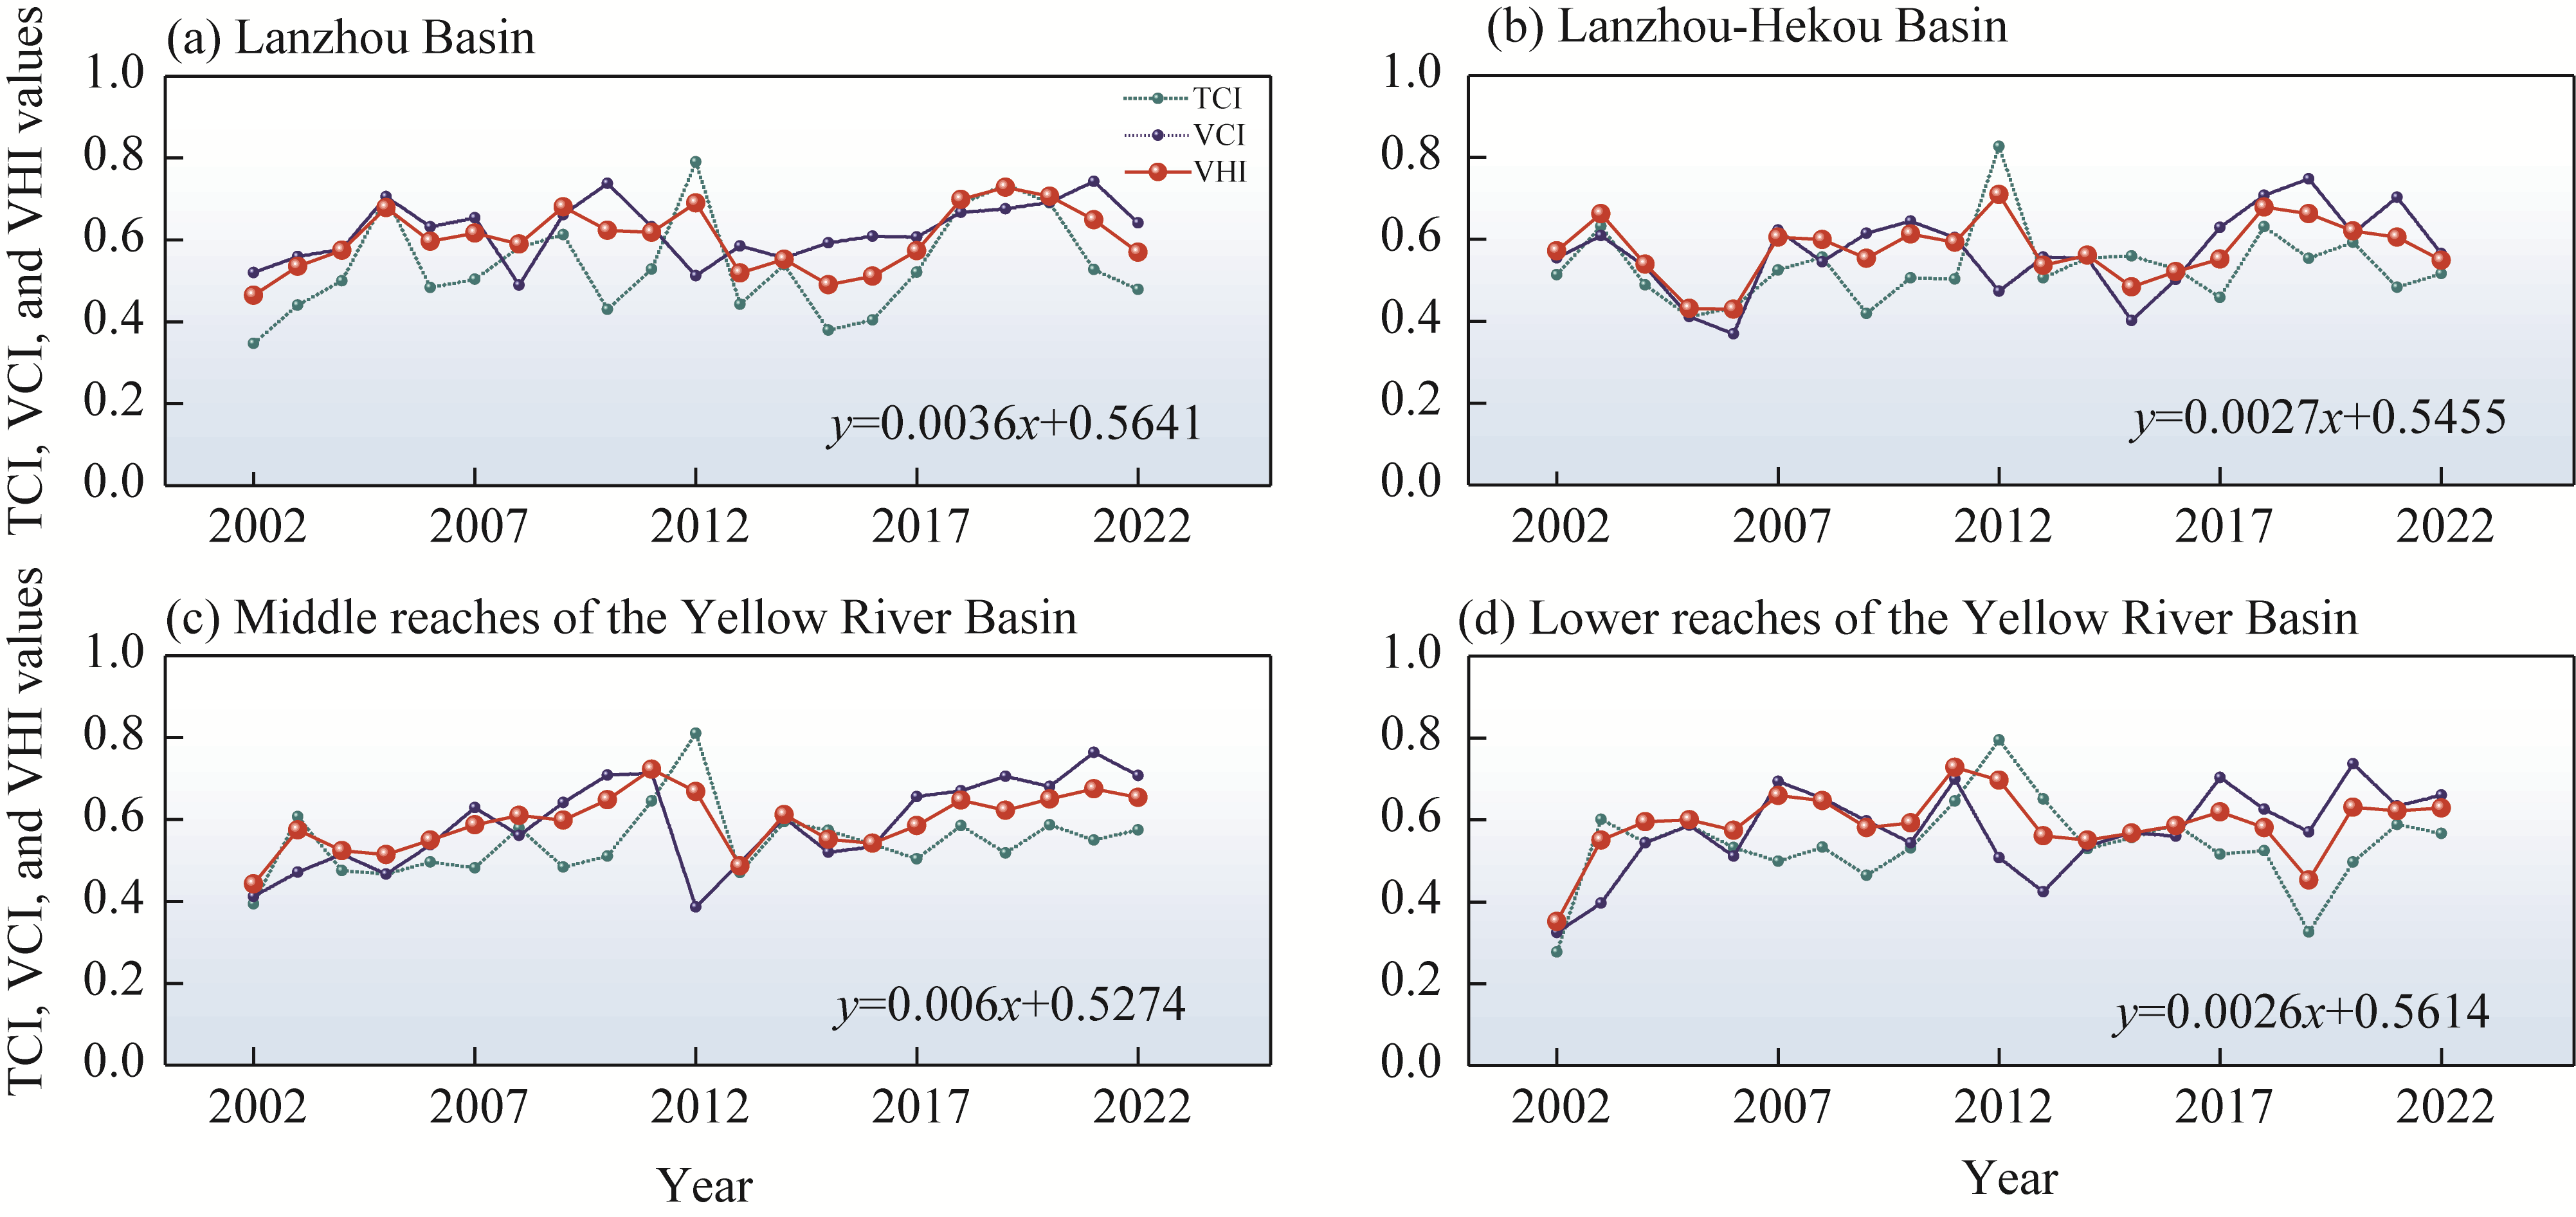
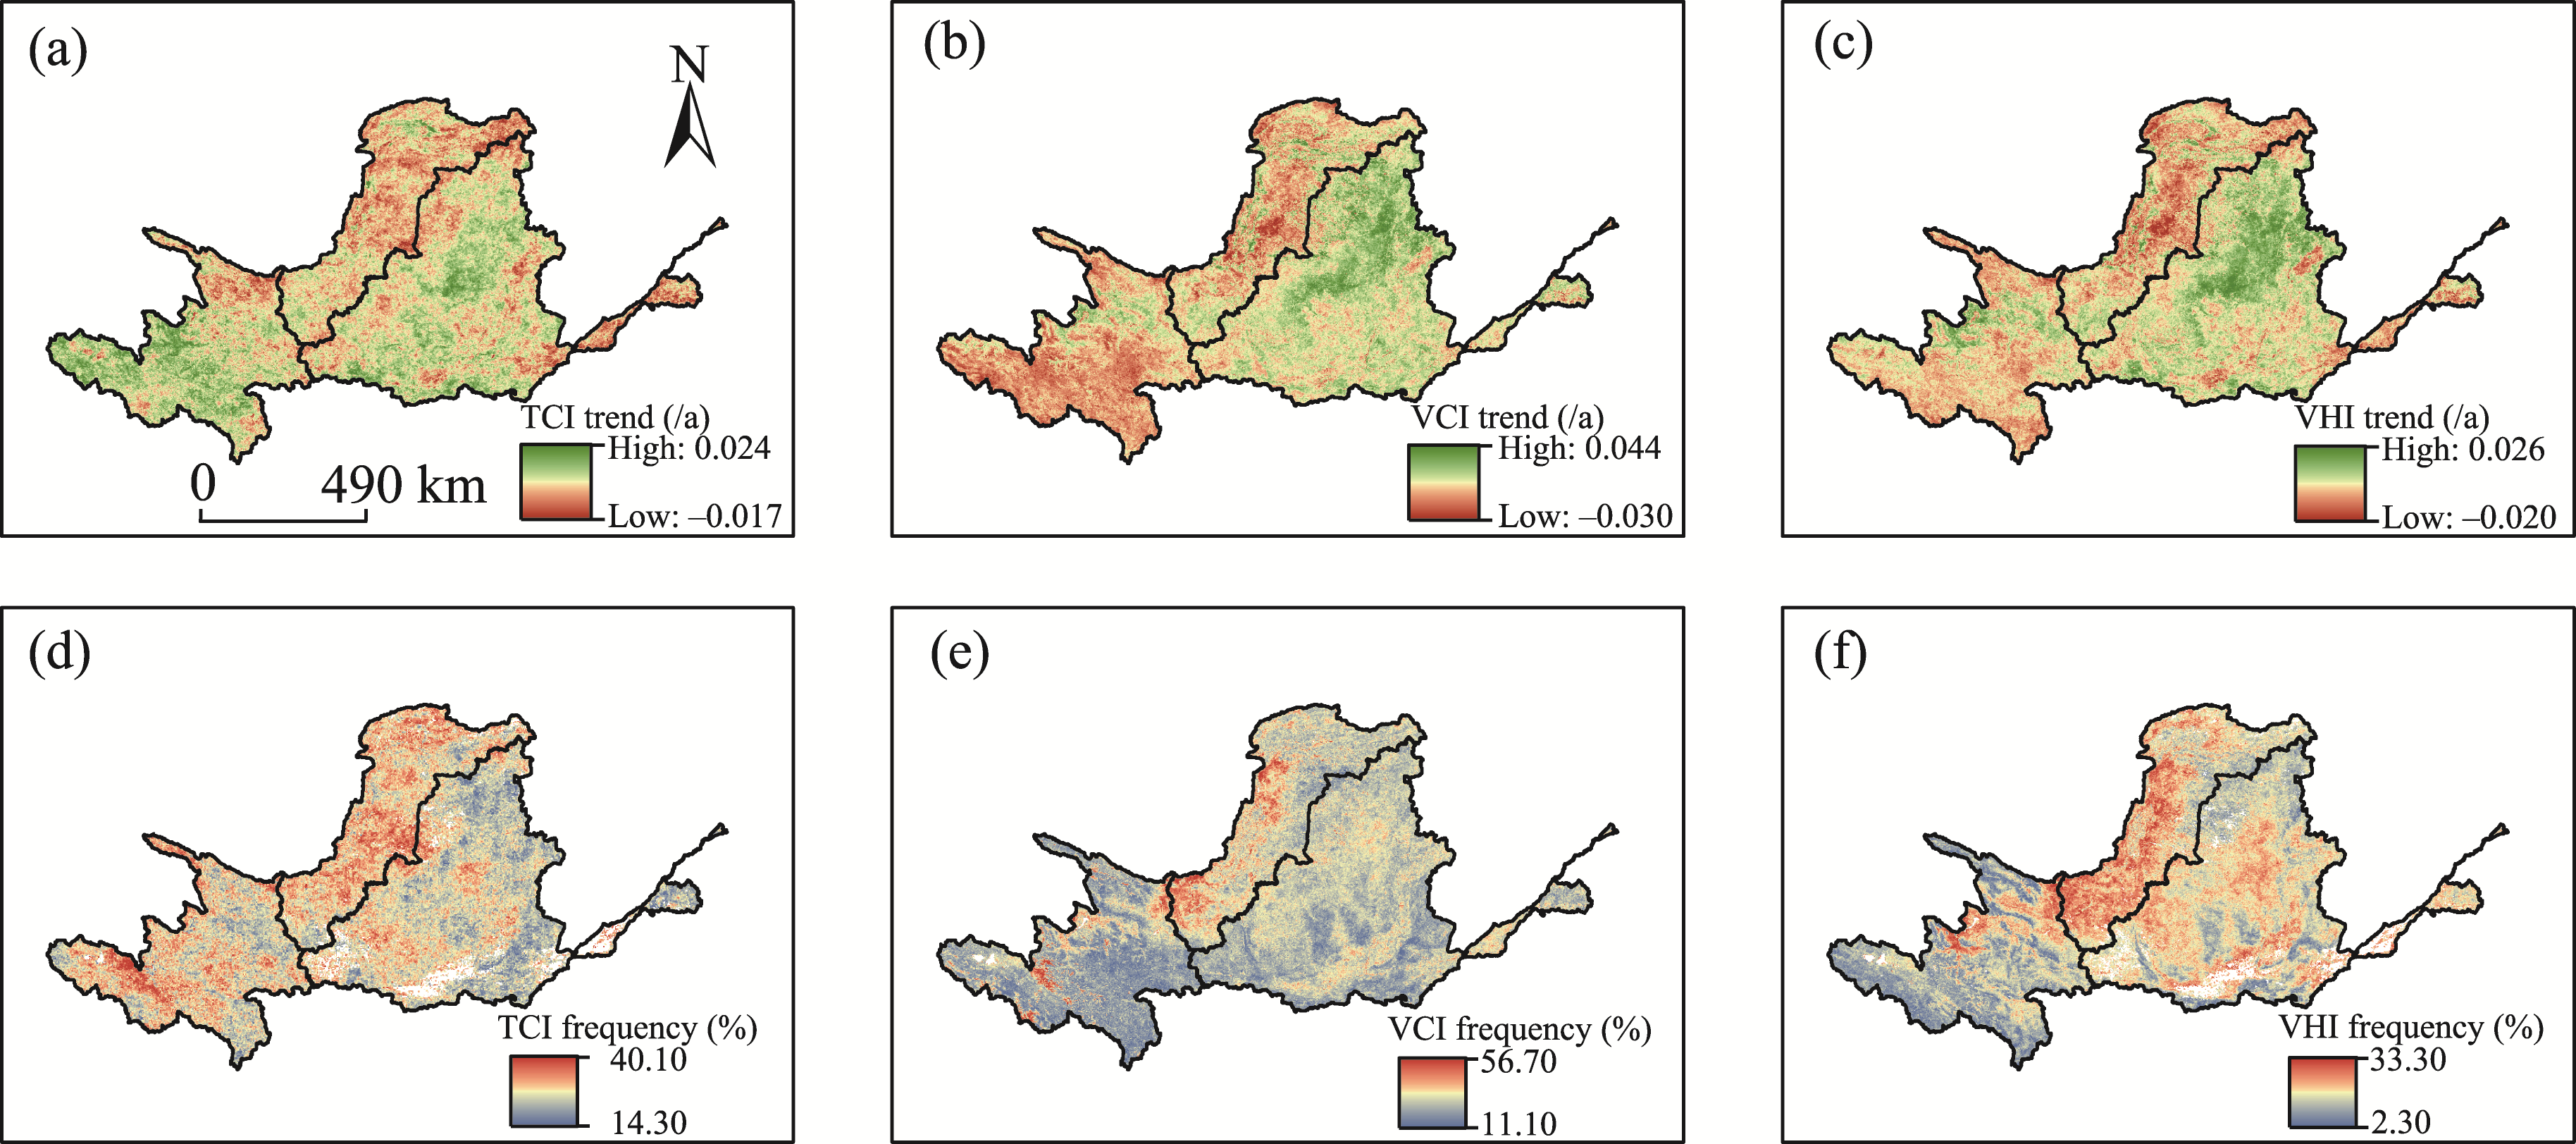
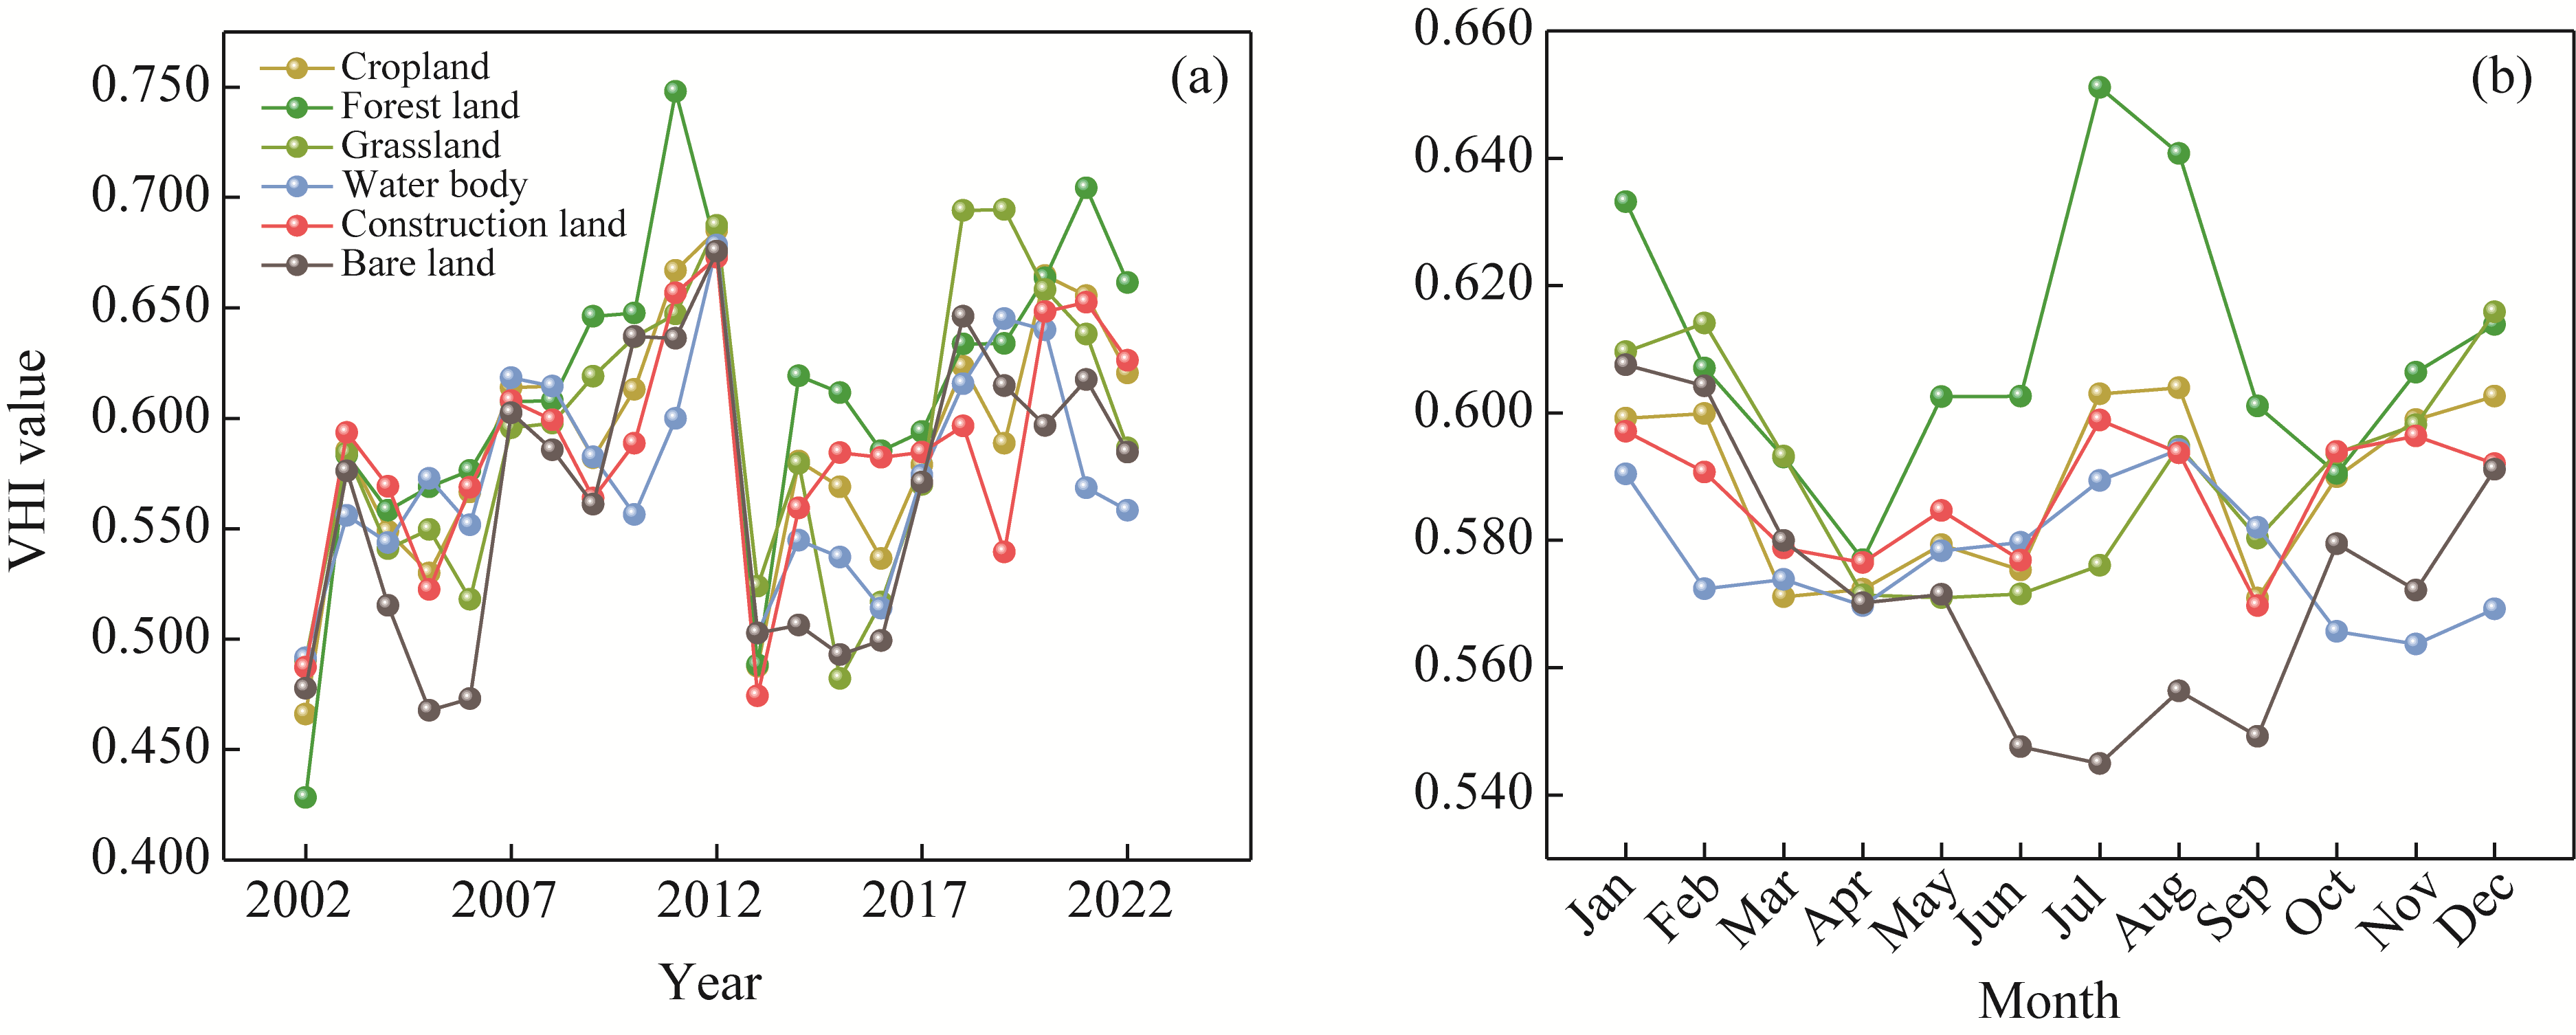
Abstract Drought is a natural disaster that significantly impacts the Earth's ecological environment, especially in arid and semi-arid areas. However, drought at a large watershed scale, which plays an important role in sustainable environmental development, has received limited attention. In this study, we analyzed the spatial and temporal variations in drought in the Yellow River Basin, China from 2002 to 2022 and its driving factors using a vegetation health index (VHI). Results showed that average VHI in the Yellow River Basin from 2002 to 2022 was 0.581, with the most severe drought occurring in summer and autumn. The basin showed a slow decreasing trend in drought during the study period. Regarding spatial distribution of monthly drought frequency and trend of VHI, the mean of the frequency was 13.00%, and 78.00% had a drought frequency of 10.00%-20.00%, with moderate drought generally prevailing. Regarding land use types, forest land, grassland, agricultural land, construction land, water body, and wasteland showed a descending order for the annual average VHI. VHI of each land use type was the lowest in summer and autumn, with pronounced seasonal characteristics. The uneven distribution of drought in the Yellow River Basin was primarily influenced by annual precipitation, solar-induced chlorophyll fluorescence, and relative humidity. VHI effectively quantified drought conditions at a regional scale and proved to be highly applicable in the Yellow River Basin. The results clarify the effectiveness of VHI for drought monitoring in the Yellow River Basin and can provide a reference for drought monitoring across the basin.
|
|
Received: 17 December 2024
Published: 31 October 2025
|
|
Corresponding Authors:
*ZHOU Ruiping (E-mail: 20041310@imnu.edu.cn)
|
|
|
| [1] |
Almeida-Ñauñay A F, Villeta M, Quemada M, et al. 2022. Assessment of drought indexes on different time scales: A case in semiarid Mediterranean Grasslands. Remote Sensing, 14(3): 565, doi: 10.3390/rs14030565.
|
|
|
| [2] |
Bento V A, Gouveia C M, DaCamara C C, et al. 2020. The roles of NDVI and land surface temperature when using the vegetation health index over dry regions. Global and Planetary Change, 190: 103198, doi: 10.1016/j.gloplacha.2020.103198.
|
|
|
| [3] |
Berg A, Findell K, Lintner B, et al. 2016. Land-atmosphere feedbacks amplify aridity increase over land under global warming. Nature Climate Change, 6: 869-784.
|
|
|
| [4] |
Cheng Q P, Zhong F L, Wang P. 2021. Potential linkages of extreme climate events with vegetation and large-scale circulation indices in an endorheic river basin in Northwest China. Atmospheric Research, 247: 105256, doi: 10.1016/j.atmosres.2020.105256.
|
|
|
| [5] |
Chikabvumbwa S R, Salehnia N, Gholami A, et al. 2023. Characterization of hydro-meteorological droughts based on dynamic future scenarios and effective rainfall over Central Malawi. Theoretical and Applied Climatology, 155: 1959-1975.
|
|
|
| [6] |
Choat B, Brodribb T J, Brodersen C R, et al. 2018. Triggers of tree mortality under drought. Nature, 558: 531-539.
|
|
|
| [7] |
Cochard H. 2021. A new mechanism for tree mortality due to drought and heatwaves. Peer Community Journal, 1: e36, doi: 10.24072/pcjournal.45.
|
|
|
| [8] |
Doblas-Miranda E, Alonso R, Arnan X, et al. 2017. A review of the combination among global change factors in forests, shrublands and pastures of the Mediterranean region: Beyond drought effects. Global and Planetary Change, 148: 42-54.
|
|
|
| [9] |
Frank S D. 2021. Review of the direct and indirect effects of warming and drought on scale insect pests of forest systems. Forestry: An International Journal of Forest Research, 94(2): 167-180.
|
|
|
| [10] |
Hao L, Sun G, Huang X L, et al. 2023. Urbanization alters atmospheric dryness through land evapotranspiration. npj Climate and Atmospheric Science, 6: 149, doi: 10.1038/s41612-023-00479-z.
|
|
|
| [11] |
He B, Wang S R, Guo L L, et al. 2019. Aridity change and its correlation with greening over drylands. Agricultural and Forest Meteorology, 278: 107663, doi: 10.1016/j.agrformet.2019.107663.
|
|
|
| [12] |
Hu T, Renzullo L J, van Dijk A I J M, et al. 2020. Monitoring agricultural drought in Australia using MTSAT-2 land surface temperature retrievals. Remote Sensing of Environment, 236: 111419, doi: 10.1016/j.rse.2019.111419.
|
|
|
| [13] |
Javed T, Li Y, Rashid S, et al. 2021. Performance and relationship of four different agricultural drought indices for drought monitoring in China using remote sensing data. Science of the Total Environment, 759: 143530, doi: 10.1016/j.scitotenv.2020.143530.
|
|
|
| [14] |
Jin L, Chen S D, Liu M F. 2024. Multiscale spatiotemporal dynamics of drought within the Yellow River Basin (YRB): An examination of regional variability and trends. Water, 16(5): 791, doi: 10.3390/w16050791.
|
|
|
| [15] |
Kloos S, Yuan Y, Castelli M, et al. 2021. Agricultural drought detection with MODIS based vegetation health indices in Southeast Germany. Remote Sensing, 13(19): 3907, doi: 10.3390/rs13193907.
|
|
|
| [16] |
Li C, Fultz L M, Moore-Kucera J, et al. 2018. Soil microbial community restoration in conservation reserve program semi-arid grasslands. Soil Biology and Biochemistry, 118: 166-177.
|
|
|
| [17] |
Li M M, Liu A T, Zou C J, et al. 2012. An overview of the ''Three-North'' Shelterbelt project in China. Forestry Studies in China, 14: 70-79.
|
|
|
| [18] |
Li S D, Liu M C. 2022. The development process, current situation and prospects of the conversion of farmland to forests and grasses project in China. Journal of Resources and Ecology, 13(1): 120-128.
doi: 10.5814/j.issn.1674-764x.2022.01.014
|
|
|
| [19] |
Li X Y, Jiao Y, Liu J Y. 2024. Changes in drought characteristics in the Yellow River basin during the carbon-neutral period under low-emission scenarios. Water, 16(7): 1045, doi: 10.3390/w16071045.
|
|
|
| [20] |
Liang L, Zhao S H, Qin Z H, et al. 2014. Drought change trend using MODIS TVDI and its relationship with climate factors in China from 2001 to 2010. Journal of Integrative Agriculture, 13(7): 1501-1508.
doi: 10.1016/S2095-3119(14)60813-3
|
|
|
| [21] |
Liu B X, Shao M A. 2015. Response of soil water dynamics to precipitation years under different vegetation types on the northern Loess Plateau, China. Journal of Arid Land, 8(1): 47-59.
|
|
|
| [22] |
Liu H W, Zhou T J, Zhu Y X, et al. 2012. The strengthening East Asia summer monsoon since the early 1990s. Chinese Science Bulletin, 57: 1553-1558.
|
|
|
| [23] |
Liu Y, Ni Z Y, Zhao Y B, et al. 2022. Spatial-temporal evolution and driving forces of drying trends on the Qinghai-Tibet Plateau based on geomorphological division. International Journal of Environmental Research and Public Health, 19(13): 7909, doi: 10.3390/ijerph19137909.
|
|
|
| [24] |
Lu J Y, Carbone G J, Huang X, et al. 2020. Mapping the sensitivity of agriculture to drought and estimating the effect of irrigation in the United States, 1950-2016. Agricultural and Forest Meteorology, 292-293: 108124, doi: 10.1016/j.agrformet.2020.108124.
|
|
|
| [25] |
Masroor M, Sajjad H, Rehman S, et al. 2022. Analysing the relationship between drought and soil erosion using vegetation health index and RUSLE models in Godavari middle sub-basin, India. Geoscience Frontiers, 13(2): 101312, doi: 10.1016/j.gsf.2021.101312.
|
|
|
| [26] |
Neilson J W, Califf K, Cardona C, et al. 2017. Significant impacts of increasing aridity on the arid soil microbiome. MSystems, 2(3): e00195-16, doi: 10.1128/mSystems.00195-16.
|
|
|
| [27] |
Neinavaz E, Schlerf M, Darvishzadeh R, et al. 2021. Thermal infrared remote sensing of vegetation: Current status and perspectives. International Journal of Applied Earth Observation and Geoinformation, 102: 102415, doi: 10.1016/j.jag.2021.102415.
|
|
|
| [28] |
Noor N A M, Noor N M, Alias R, et al. 2020. Drought indices monitoring using SPI and Z index score for Gua Musang, Kelantan. IOP Conference Series: Materials Science and Engineering, 932: 012050, doi: 10.1088/1757-899X/932/1/012050.
|
|
|
| [29] |
Prăvălie R. 2016. Drylands extent and environmental issues: A global approach. Earth-Science Reviews, 161: 259-278.
|
|
|
| [30] |
Qian W H, Shan X L, Zhu Y F. 2011. Ranking regional drought events in China for 1960-2009. Advances in Atmospheric Sciences, 28: 310-321.
|
|
|
| [31] |
Qin D H, Stocker T. 2014. Highlights of the IPCC working group I fifth assessment report. Advances in Climate Change Research, 10: 1-6.
|
|
|
| [32] |
Quiring S M, Ganesh S. 2010. Evaluating the utility of the Vegetation Condition Index (VCI) for monitoring meteorological drought in Texas. Agricultural and Forest Meteorology, 150(3): 330-339.
|
|
|
| [33] |
Raphael M W, Benedict M M, James M R. 2017. Analysis of spatial and temporal drought variability in a tropical river basin using Palmer Drought Severity Index (PDSI). International Journal of Water Resources and Environmental Engineering, 9(8): 178-190.
|
|
|
| [34] |
Shen Q, Liang L, Luo X, et al. 2017. Analysis of the spatial-temporal variation characteristics of vegetative drought and its relationship with meteorological factors in China from 1982 to 2010. Environmental Monitoring and Assessment, 189: 471, doi: 10.1007/s10661-017-6187-9.
pmid: 28842794
|
|
|
| [35] |
Shi P R, Hou P, Gao J X, et al. 2021. Spatial-temporal variation characteristics and influencing factors of vegetation in the Yellow River Basin from 2000 to 2019. Atmosphere, 12(12): 1576, doi: 10.3390/atmos12121576.
|
|
|
| [36] |
Stewart I T, Rogers J, Graham A. 2020. Water security under severe drought and climate change: Disparate impacts of the recent severe drought on environmental flows and water supplies in Central California. Journal of Hydrology, 7: 100054, doi: 10.1016/j.hydroa.2020.100054.
|
|
|
| [37] |
Sun D, Kafatos M. 2007. Note on the NDVI-LST relationship and the use of temperature-related drought indices over North America. Geophyscal Research Letters, 34(24): L24406, doi: 10.1029/2007GL031485.
|
|
|
| [38] |
Tadesse T, Champagne C, Wardlow B D, et al. 2017. Building the vegetation drought response index for Canada (VegDRI-Canada) to monitor agricultural drought: First results. GIScience & Remote Sensing, 54(2): 230-257.
|
|
|
| [39] |
Tigkas D, Vangelis H, Tsakiris G. 2018. Drought characterization based on an agriculture-oriented standardised precipitation index. Theoretical and Applied Climatology, 135: 1435-1447.
|
|
|
| [40] |
van Loon A F. 2015. Hydrological drought explained. WIREs Water, 2: 359-392.
|
|
|
| [41] |
Wang F, Wang Z M, Yang H B, et al. 2018. Study of the temporal and spatial patterns of drought in the Yellow River basin based on SPEI. Science China Earth Sciences, 61(8): 1098-1111.
|
|
|
| [42] |
Wang H Y, Qin F, Xu C D, et al. 2021. Evaluating the suitability of urban development land with a Geodetector. Ecological Indicators, 123: 107339, doi: 10.1016/j.ecolind.2021.107339.
|
|
|
| [43] |
Wei W, Zhang J, Zhou L, et al. 2021. Comparative evaluation of drought indices for monitoring drought based on remote sensing data. Environmental Science and Pollution Research, 28: 20408-20425.
|
|
|
| [44] |
Weilnhammer V, Schmid J, Mittermeier I, et al. 2021. Extreme weather events in Europe and their health consequences-A systematic review. International Journal of Hygiene and Environmental Health, 233: 113688, doi: 10.1016/j.ijheh.2021.113688.
|
|
|
| [45] |
Xing P, Bai M X, Zhang Q B, et al. 2024. Tree-ring inferred drought variations in the source region of the Yangtze, Yellow, and Mekong Rivers over the past five centuries. Water, 16(8): 1186, doi: 10.3390/w16081186.
|
|
|
| [46] |
Younis A M, Jasim H M. 2024. Regional drought assessment based on the standard precipitation index (SPI) and precipitation concentration index (PCI) in middle part of Iraq by using GIS. IOP Conference Series: Earth and Environmental Science, 1371: 082021, doi: 10.1088/1755-1315/1371/8/082021.
|
|
|
| [47] |
Yuan S, Xing X L, Ju W M. 2023. Temporal and spatial patterns of remote sensing drought indices and their responses to climate and land use changes in China. Acta Ecologica Sinica, 43(16): 6691-6705. (in Chinese)
|
|
|
| [48] |
Zargar A, Sadiq R, Naser B, et al. 2011. A review of drought indices. Environmental Reviews, 19: 333-349.
|
|
|
| [49] |
Zhang A Z, Jia G S. 2013. Monitoring meteorological drought in semiarid regions using multi-sensor microwave remote sensing data. Remote Sensing of Environment, 134: 12-23.
|
|
|
| [50] |
Zhu L, Gong H L, Dai Z X, et al. 2015. An integrated assessment of the impact of precipitation and groundwater on vegetation growth in arid and semiarid areas. Environmental Earth Sciences, 74: 5009-5021.
|
|
|
| [51] |
Zuhro A, Tambunan M P, Marko K. 2020. Application of vegetation health index (VHI) to identify distribution of agricultural drought in Indramayu Regency, West Java Province. IOP Conference Series: Earth and Environmental Science, 500: 012047, doi: 10.1088/1755-1315/500/1/012047.
|
|
|
|
Viewed |
|
|
|
Full text
|
|
|
|
|
Abstract
|
|
|
|
|
Cited |
|
|
|
|
| |
Shared |
|
|
|
|
| |
Discussed |
|
|
|
|