| Research article |
|


|
|
|
| Enhancing urban resilience through water ecosystem services in the arid region of Northwest China |
ZHOU Yuxuan1, HE Jia1,2,*( ), WANG Shoufeng1 ), WANG Shoufeng1 |
1College of Geographic Science and Tourism, Xinjiang Normal University, Urumqi 830054, China
2Xinjiang Laboratory of Lake Environment and Resources in Arid Zone, Xinjiang Normal University, Urumqi 830054, China |
|
|
|
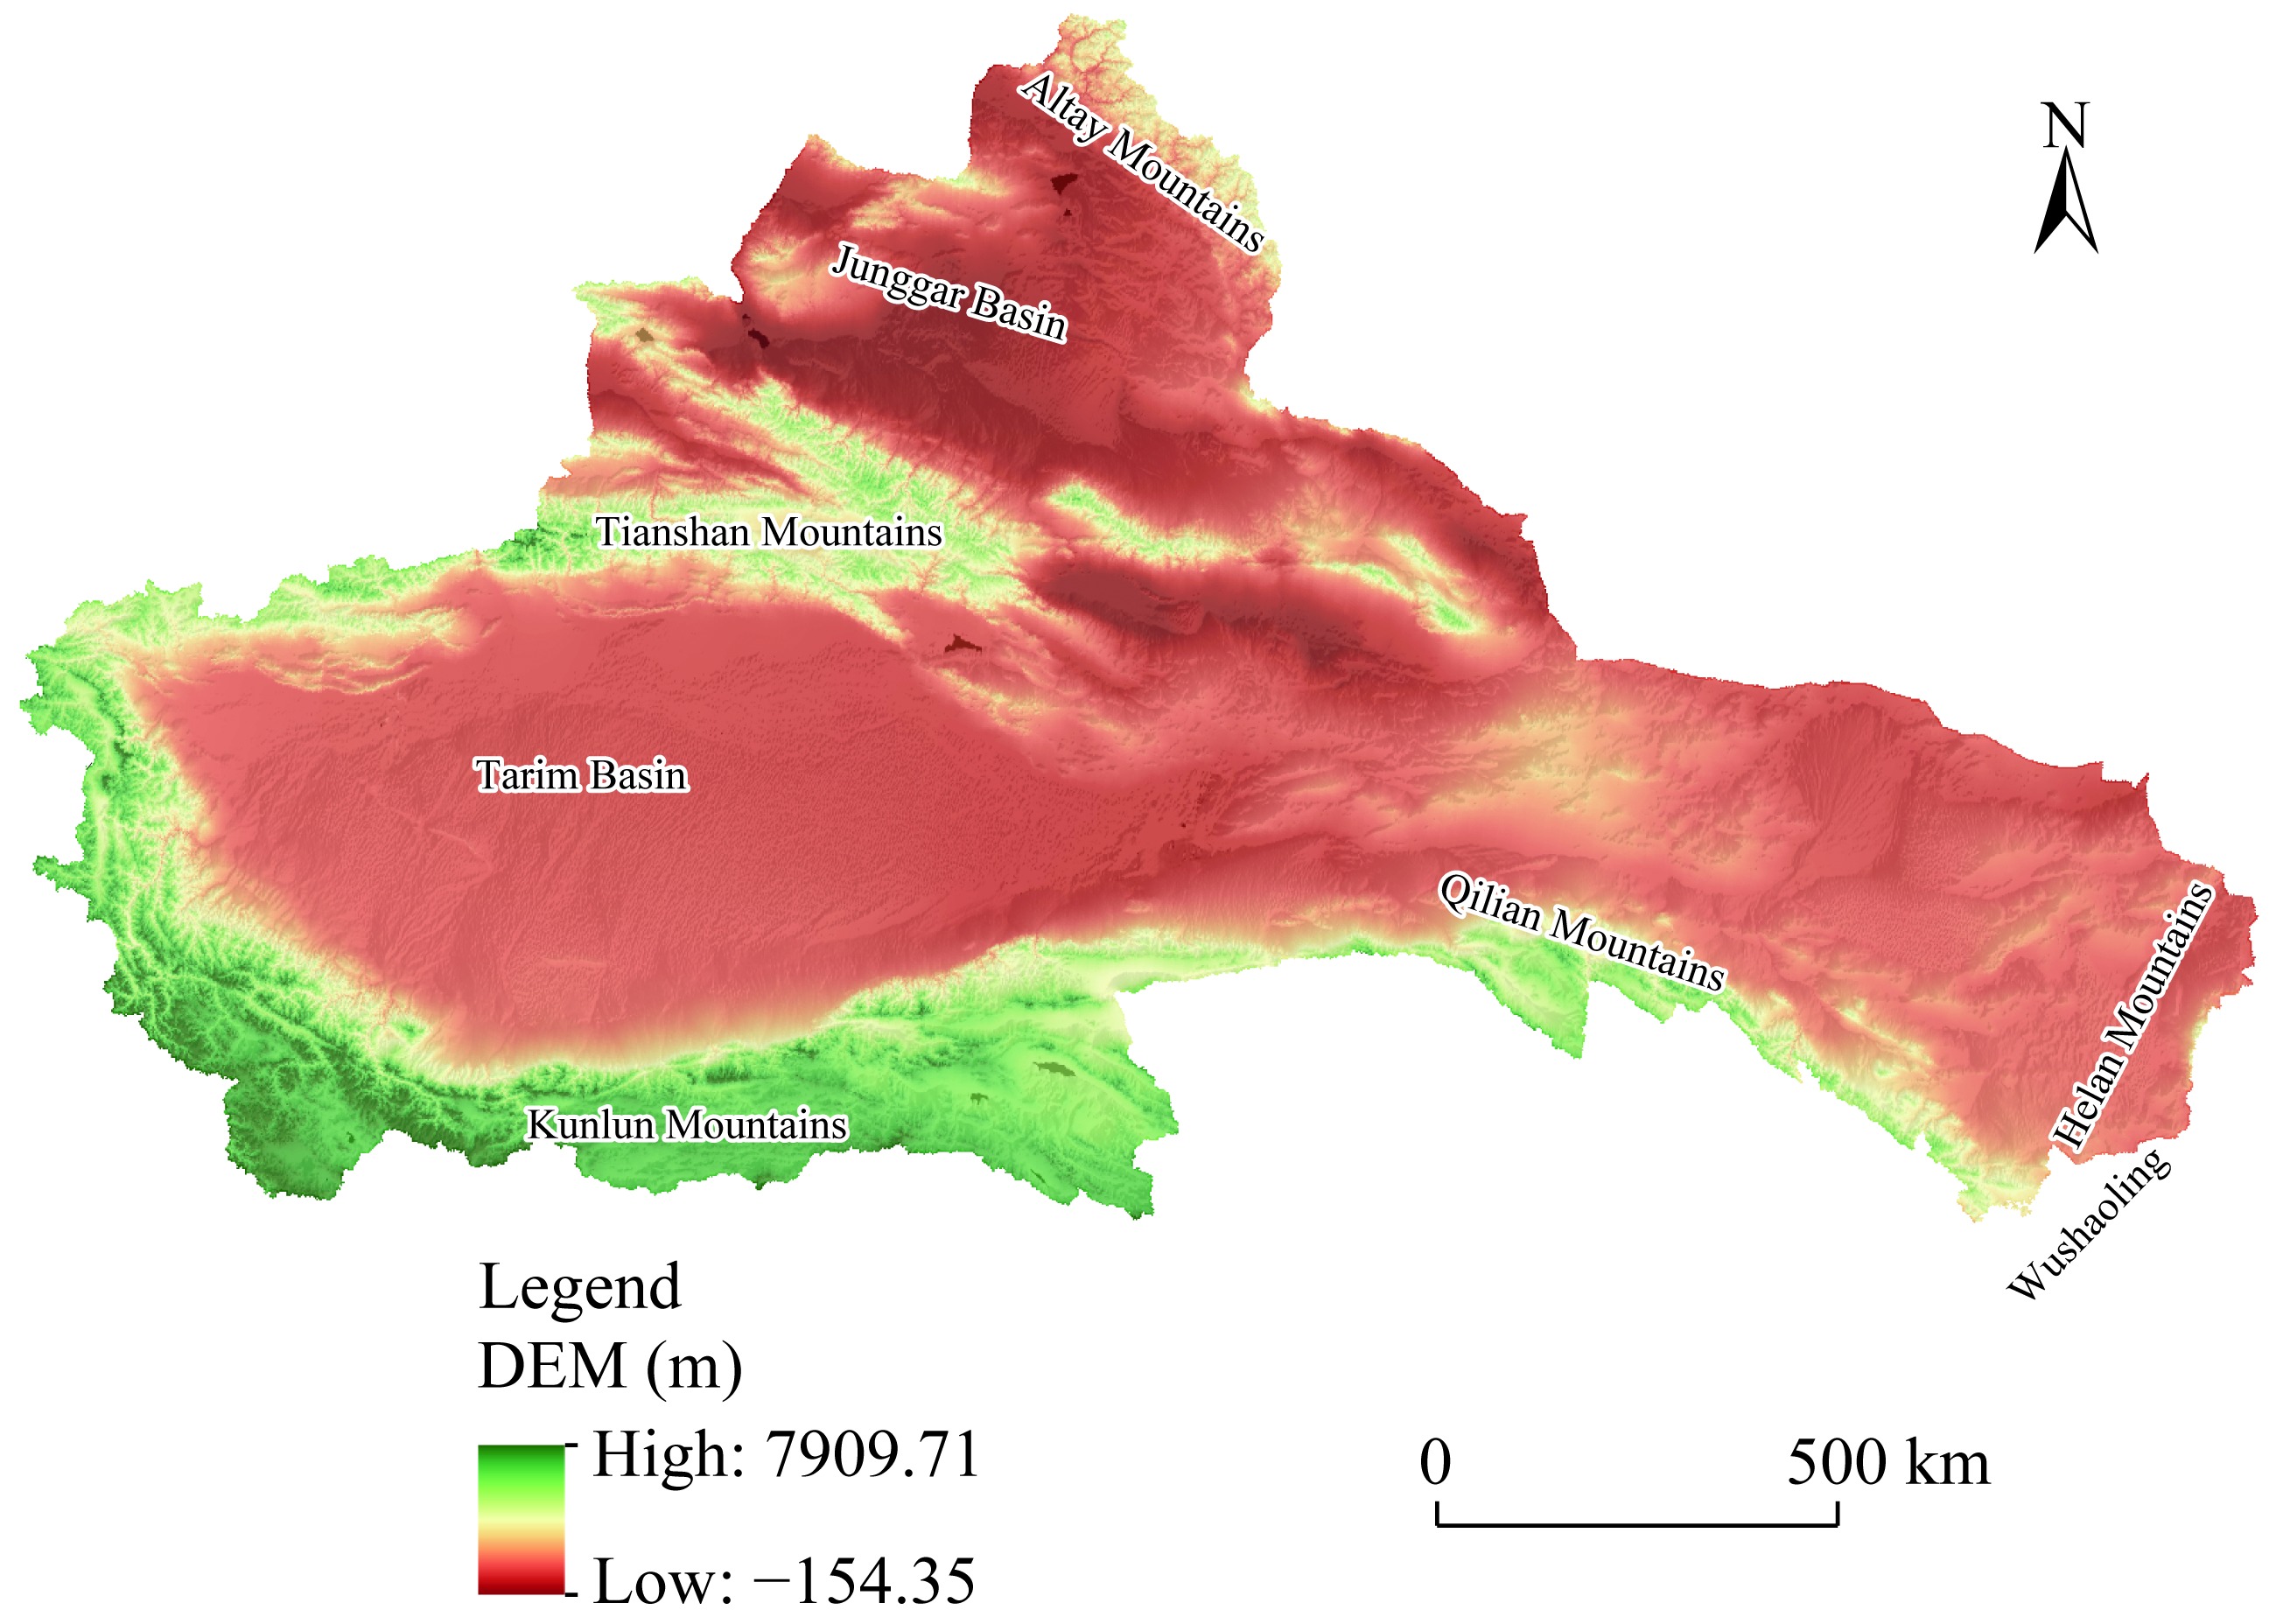
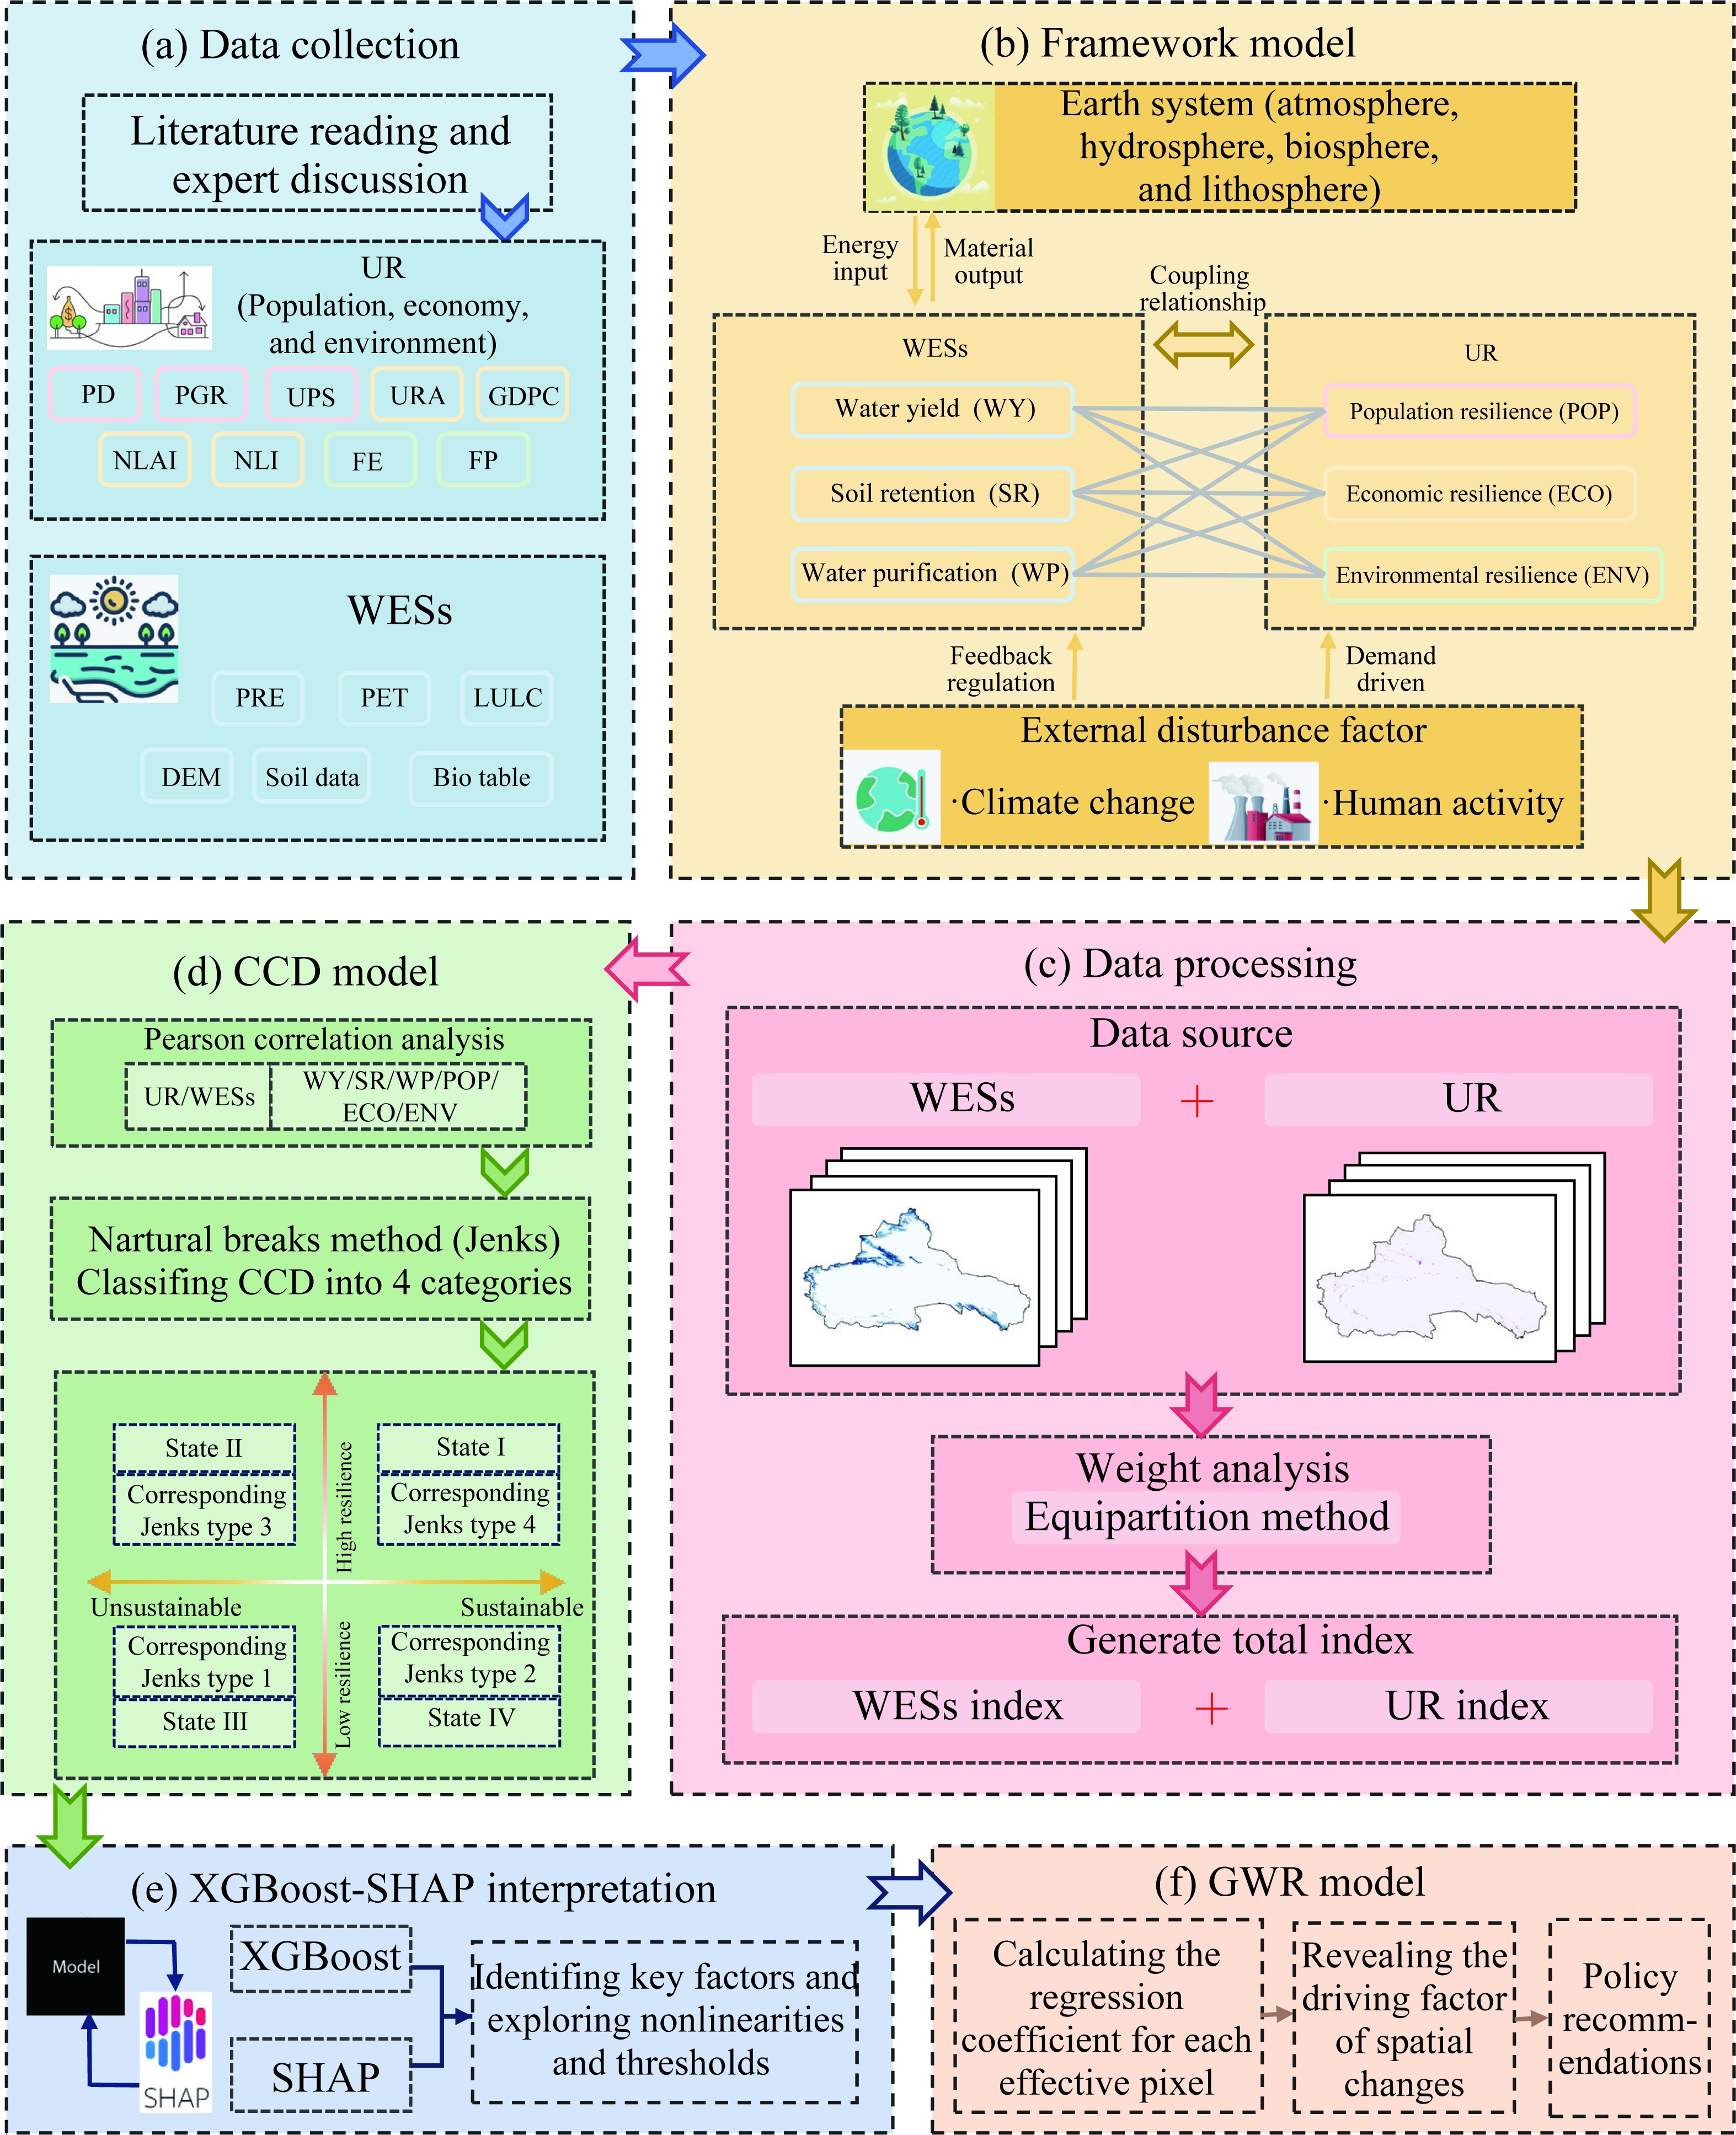
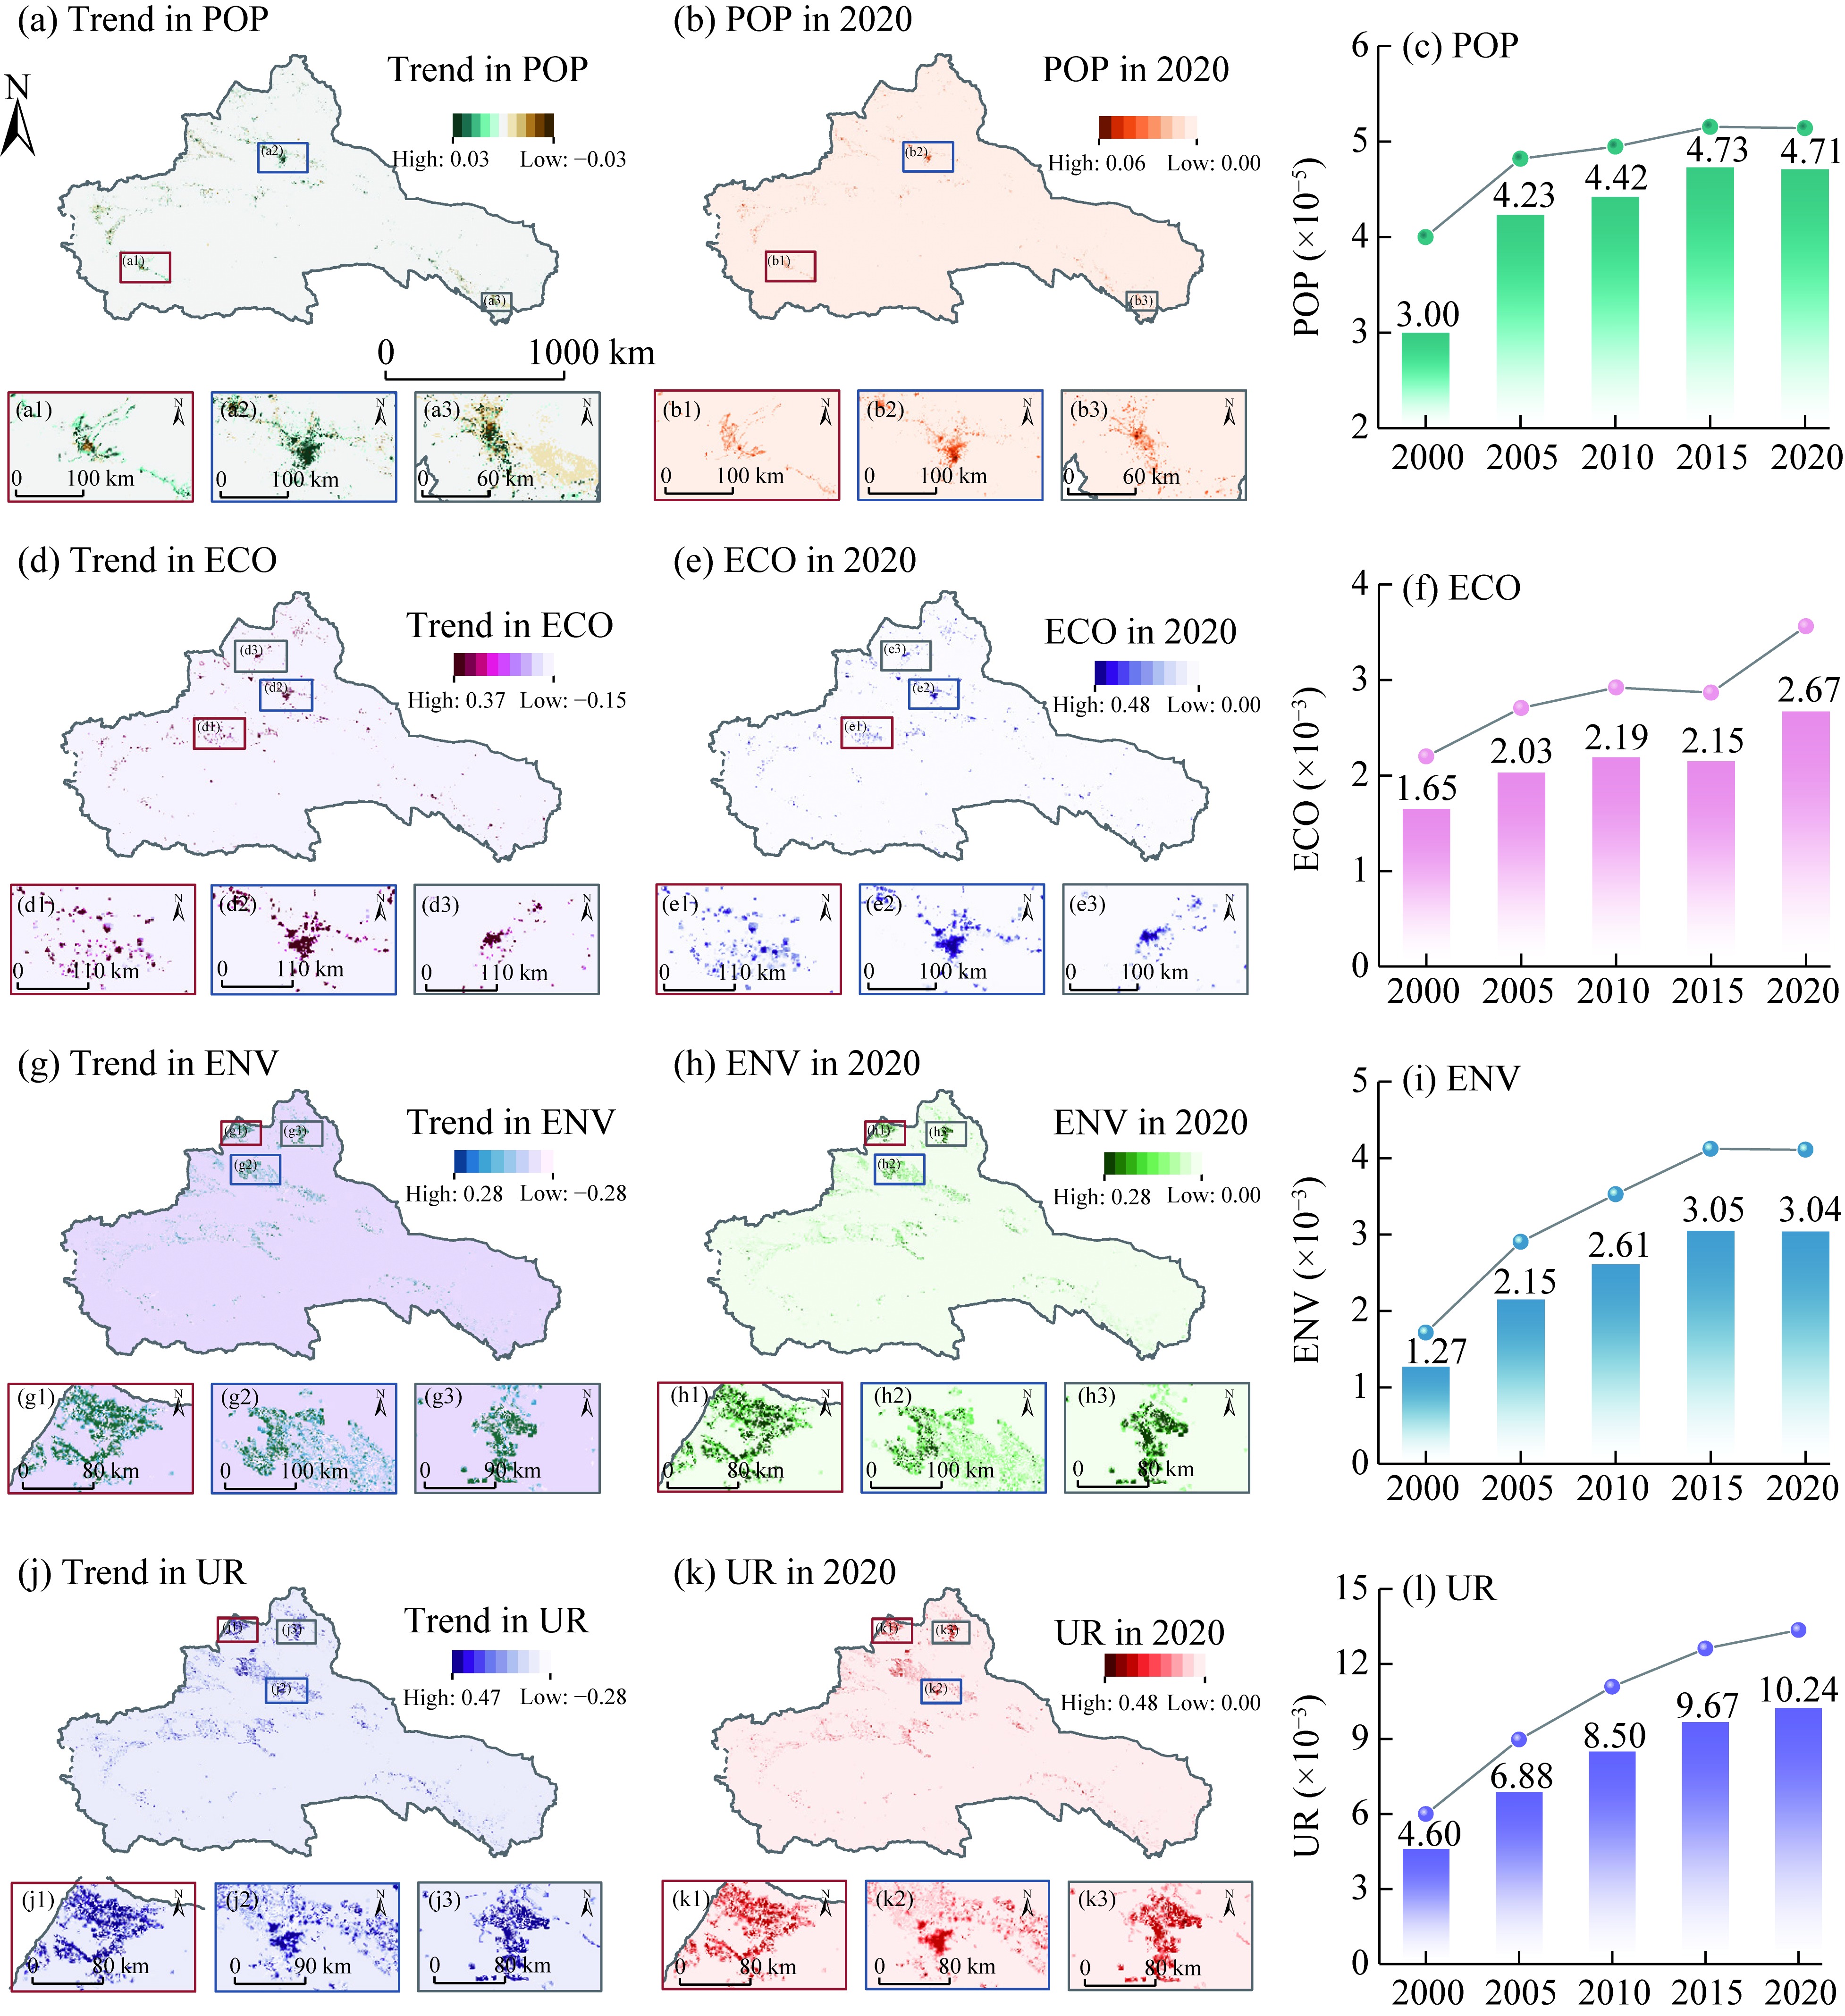
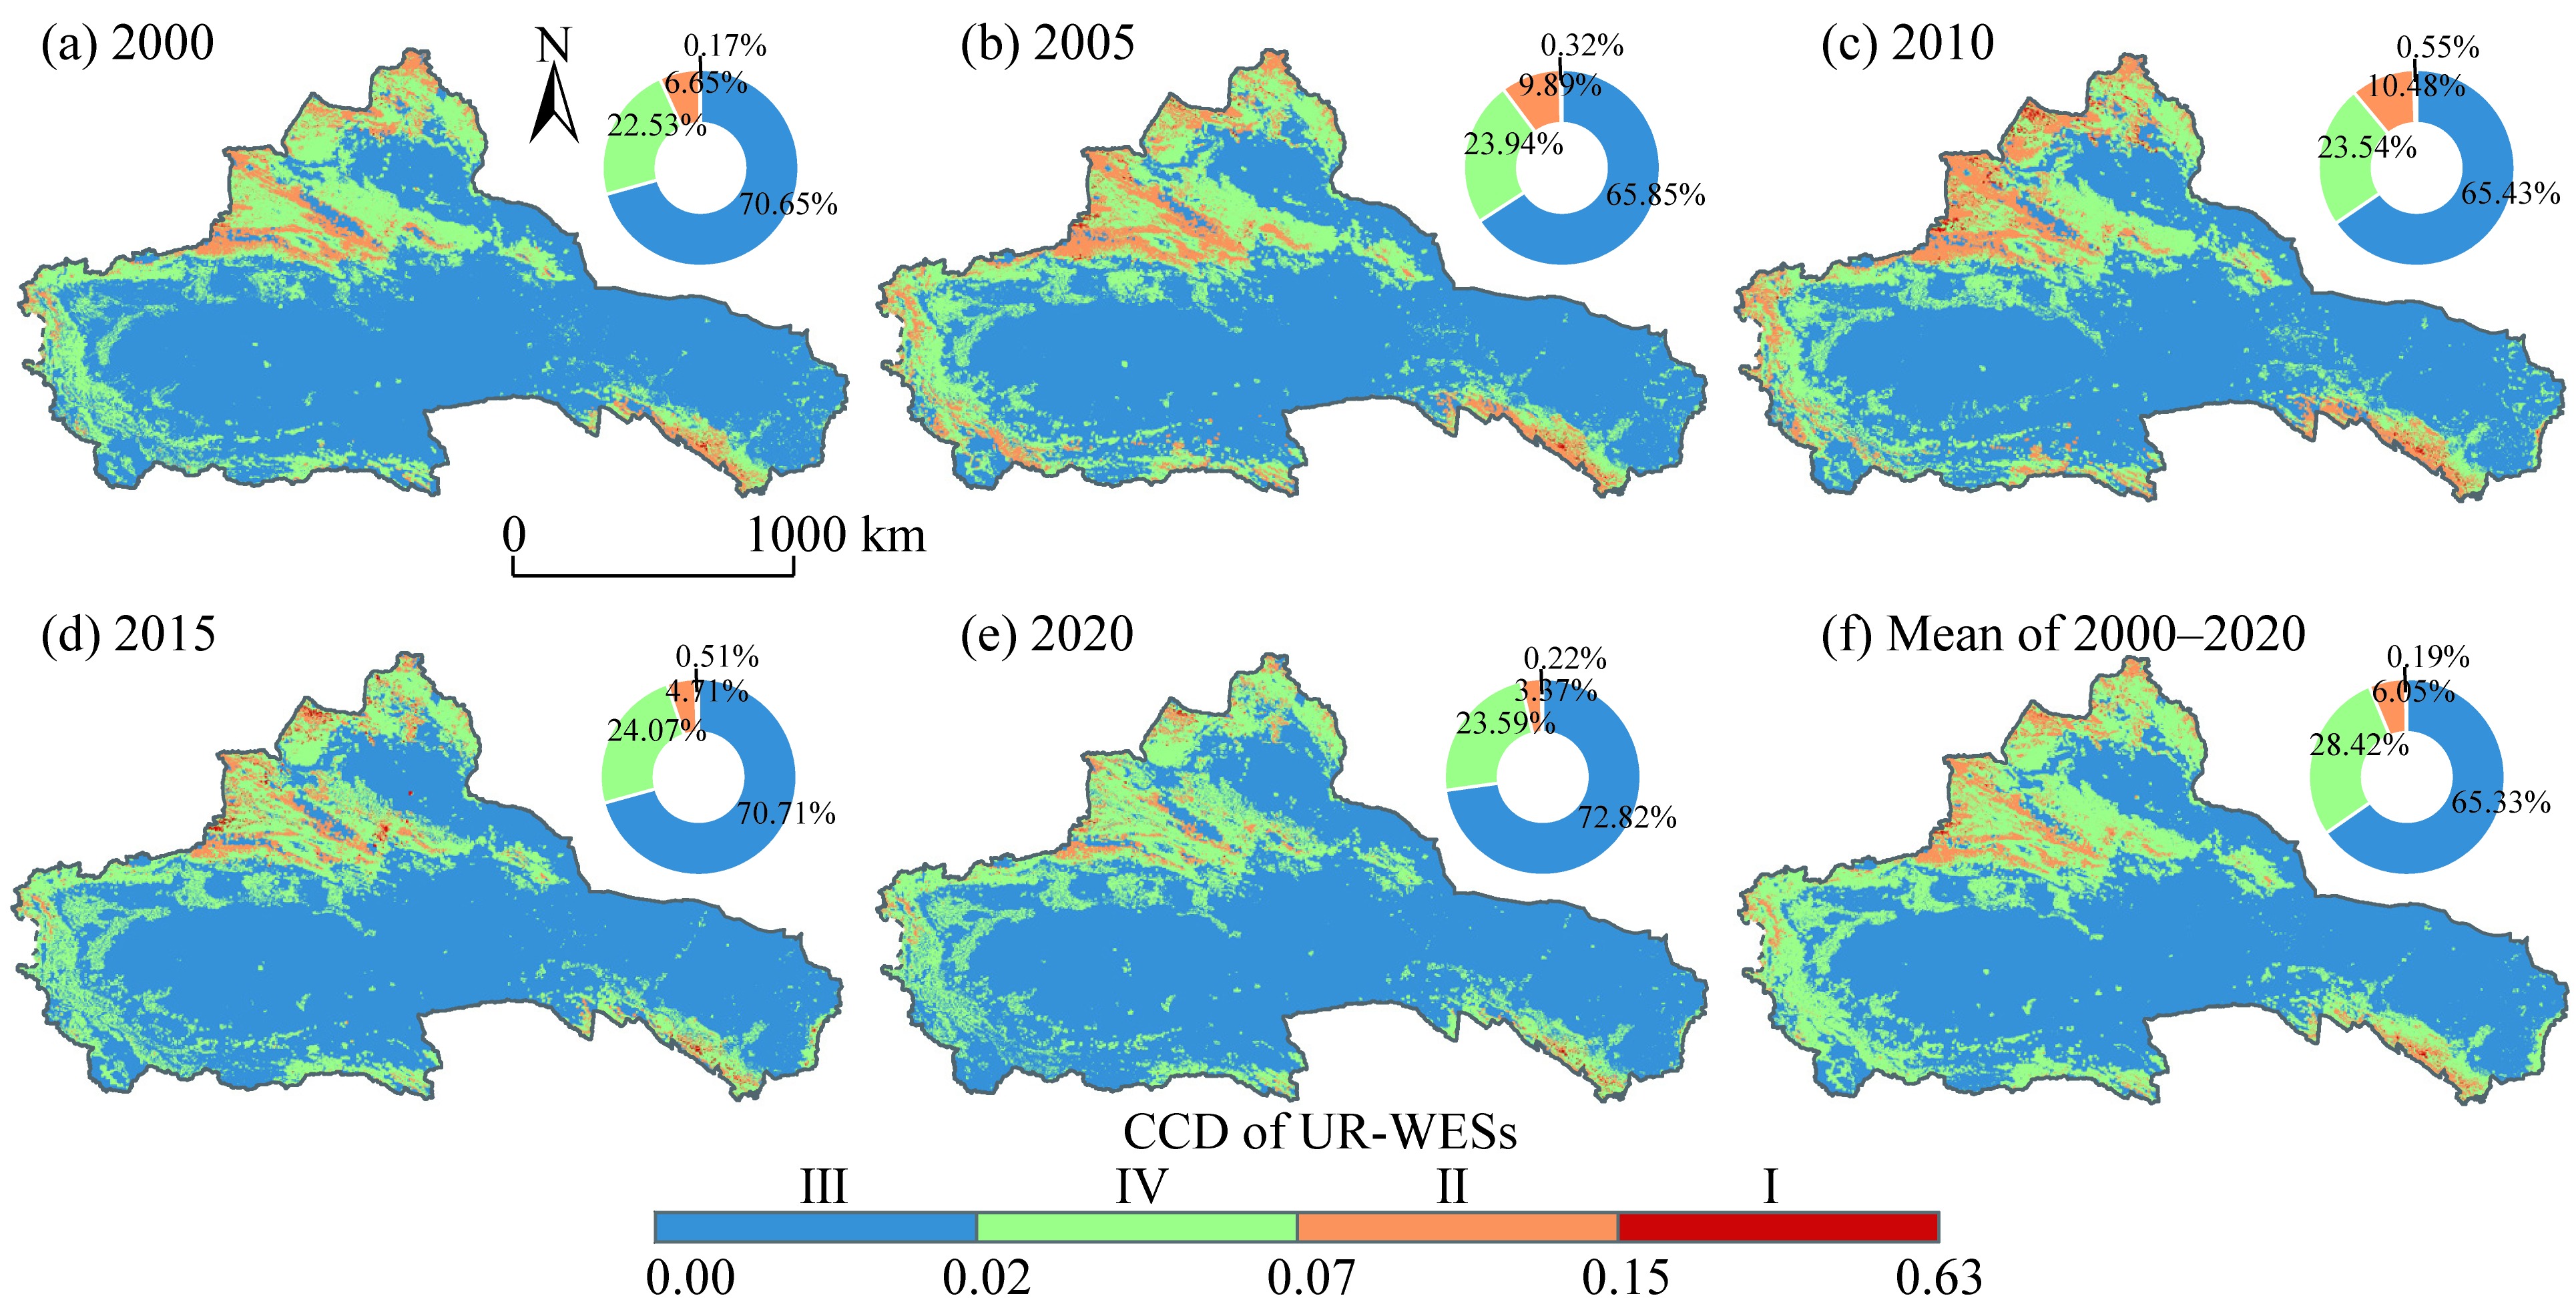
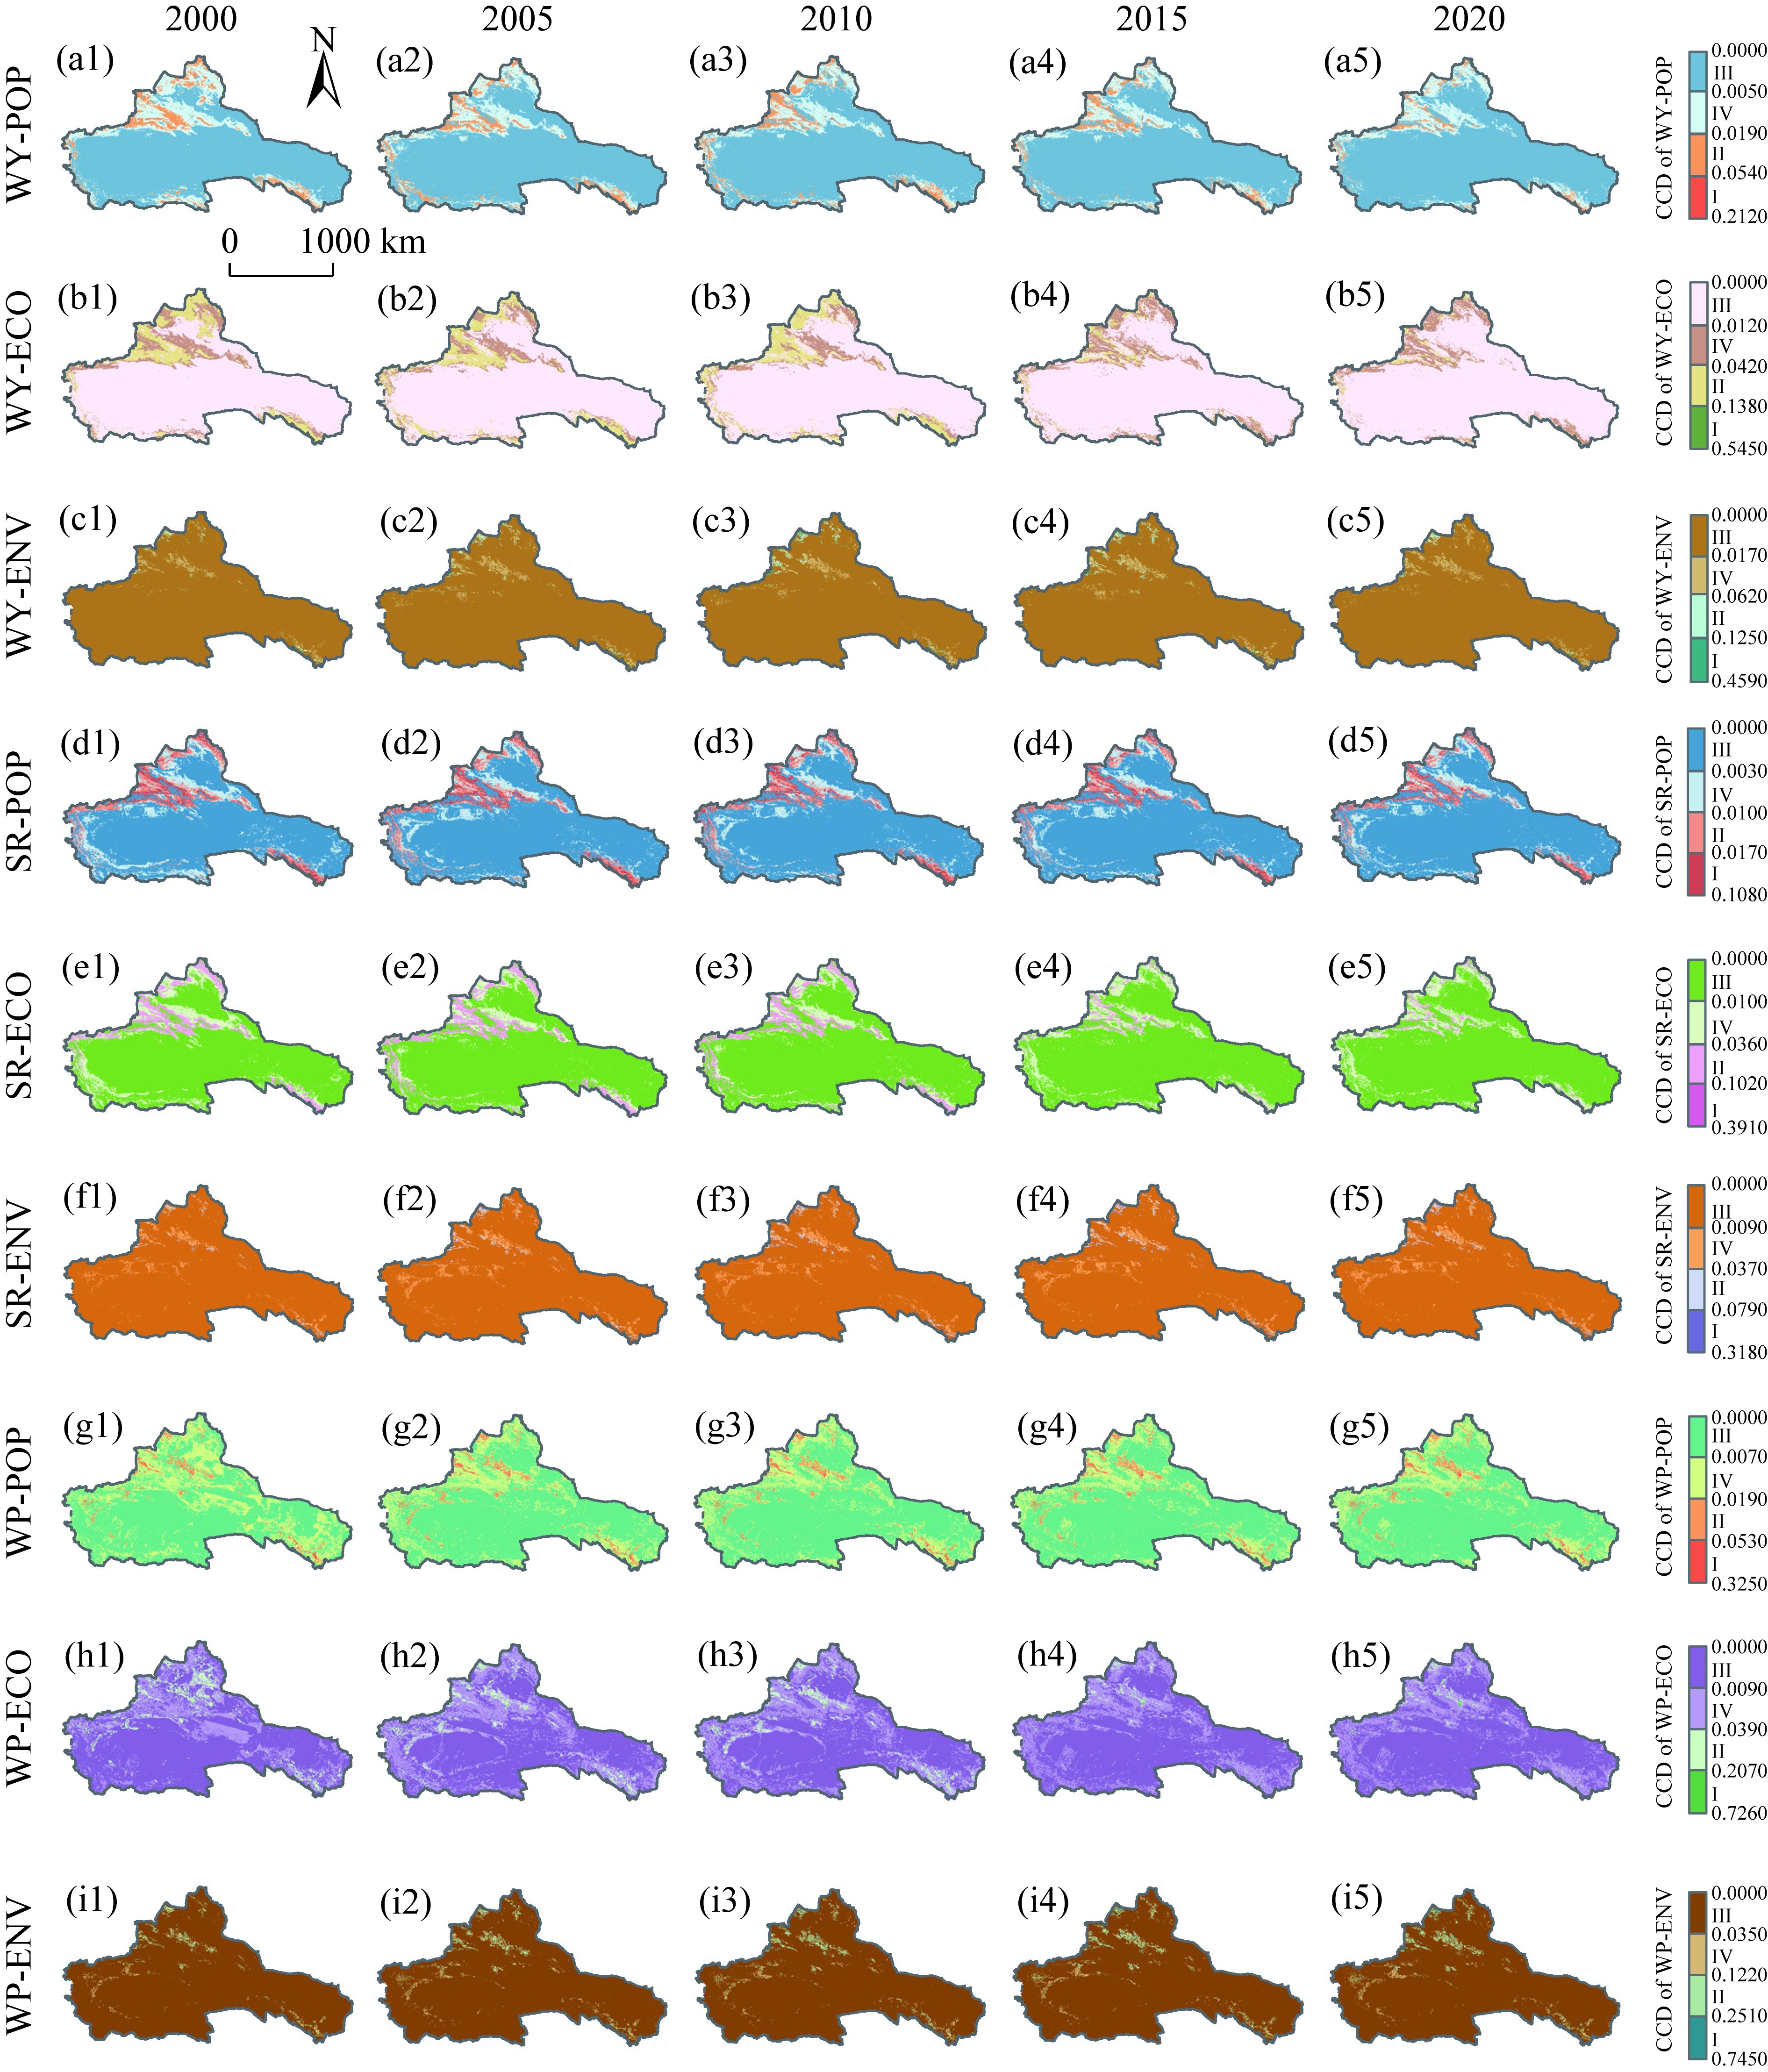
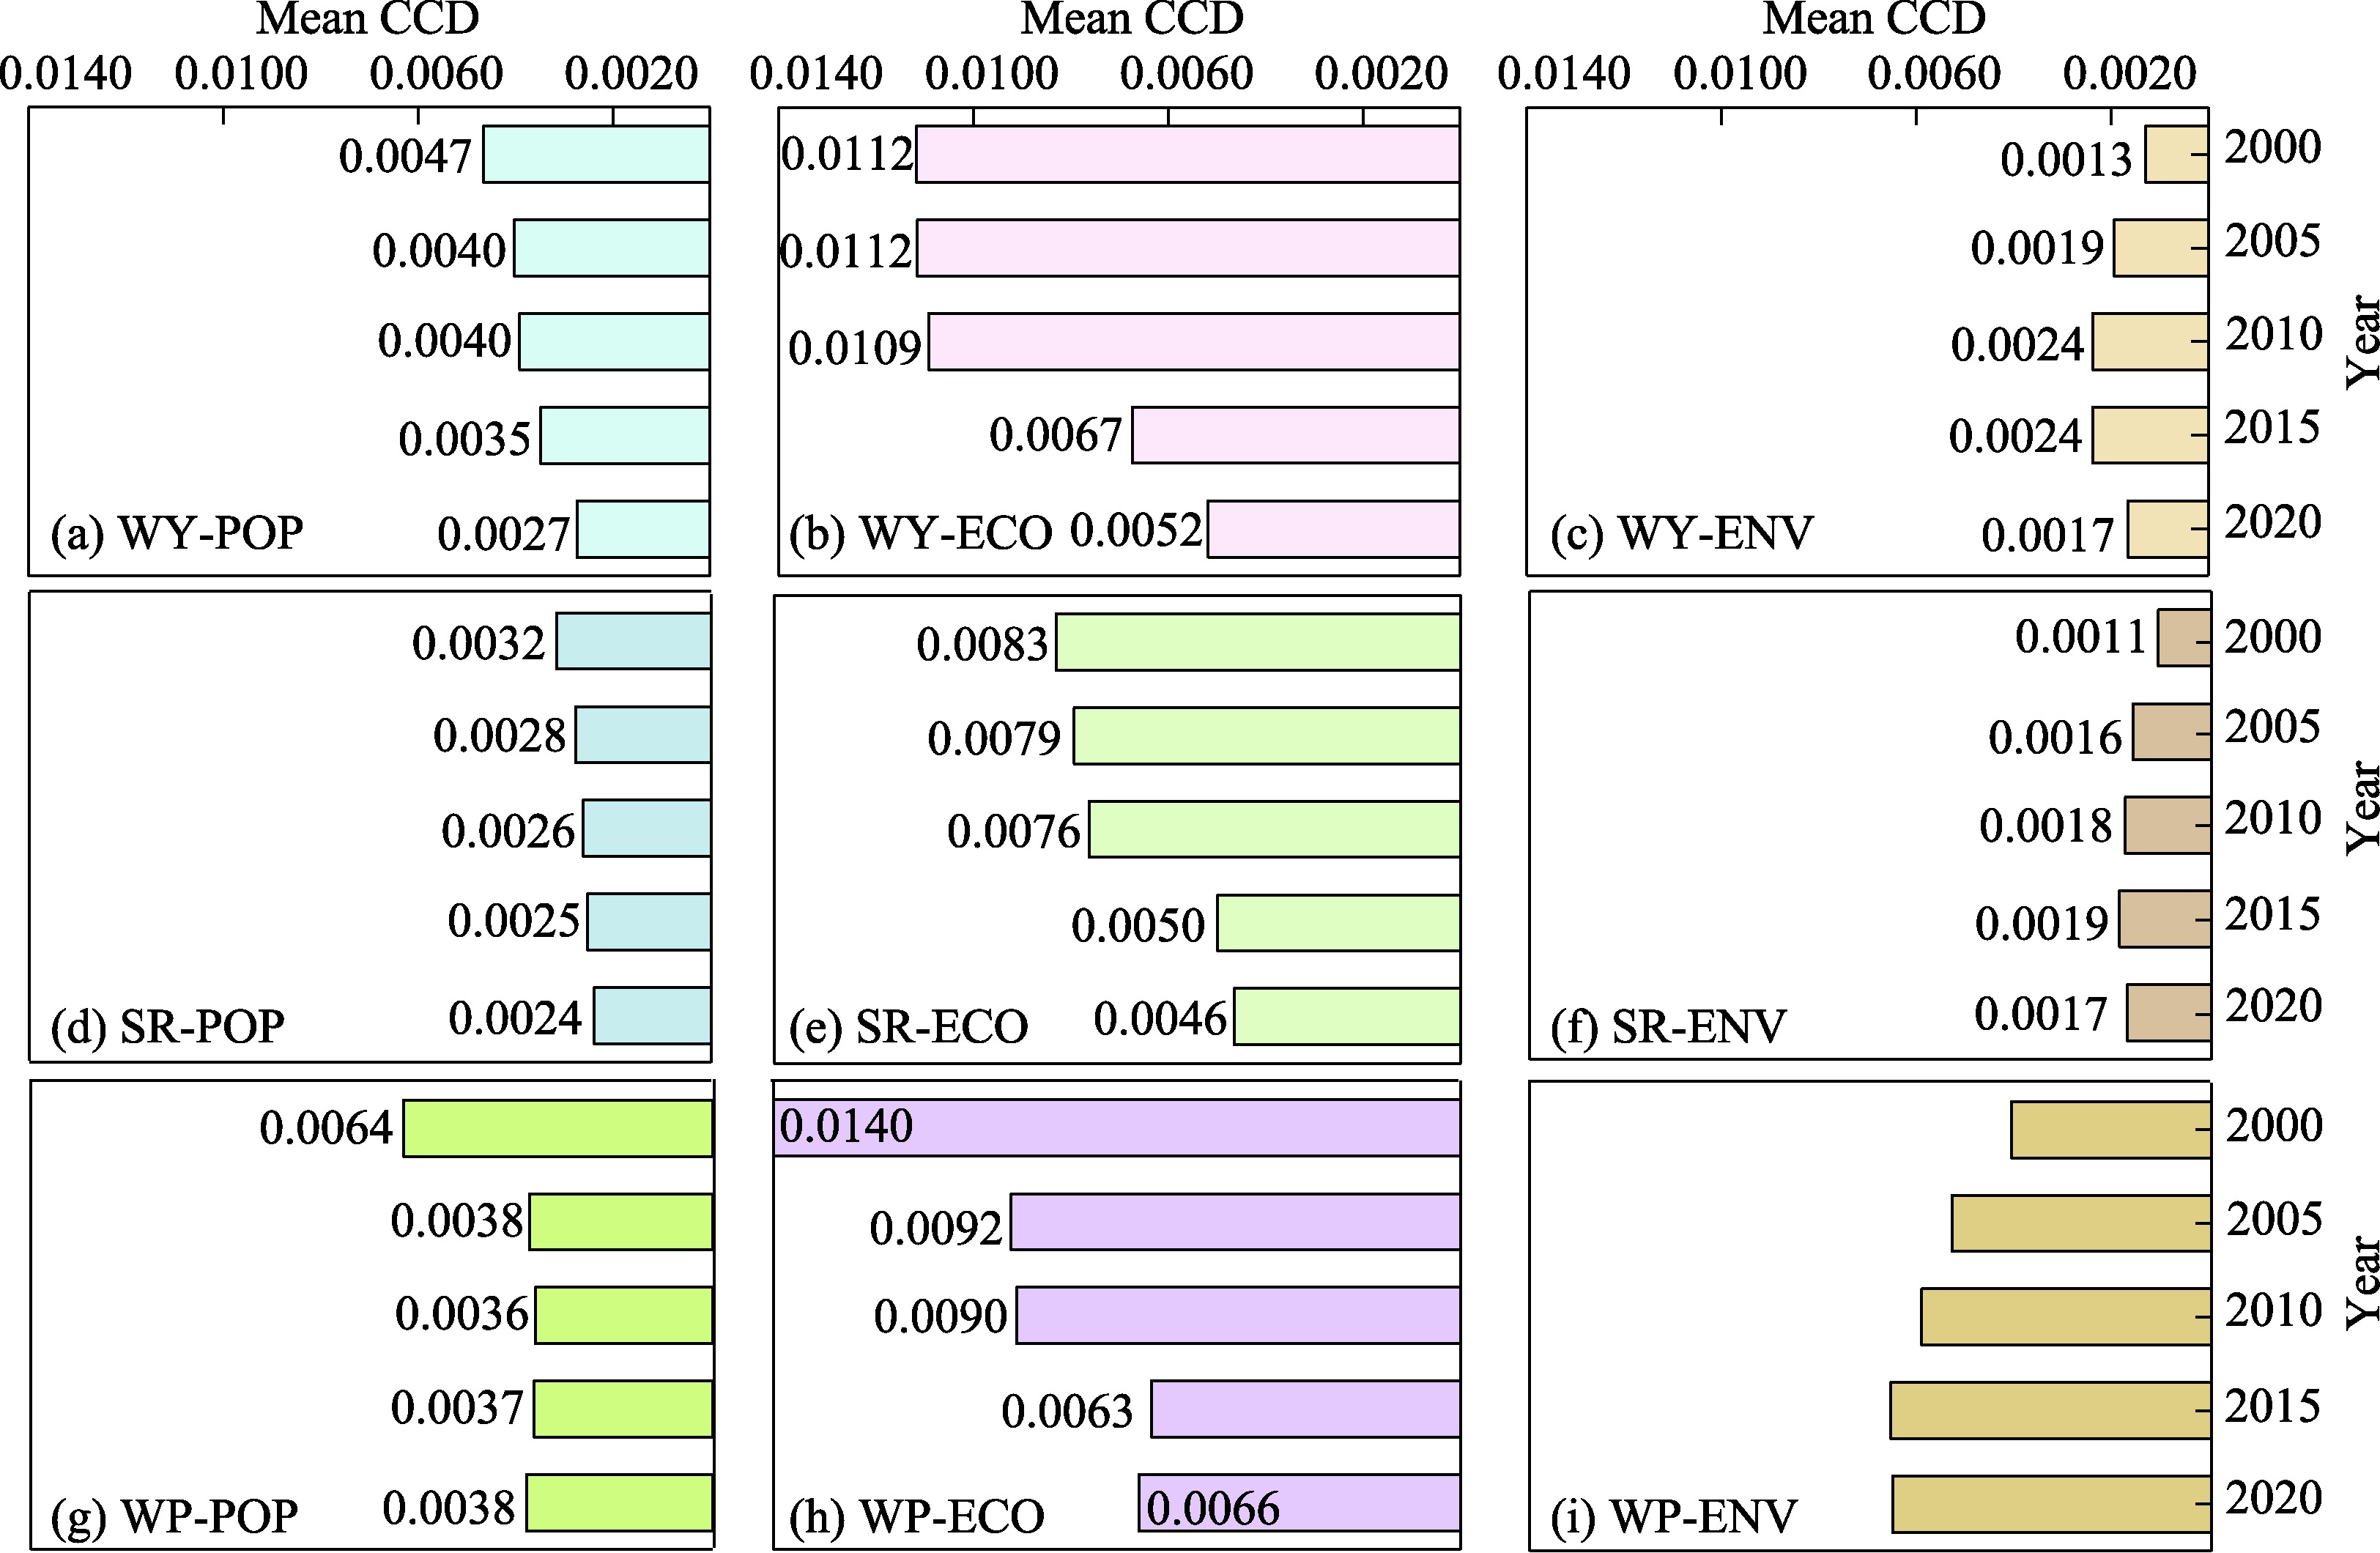
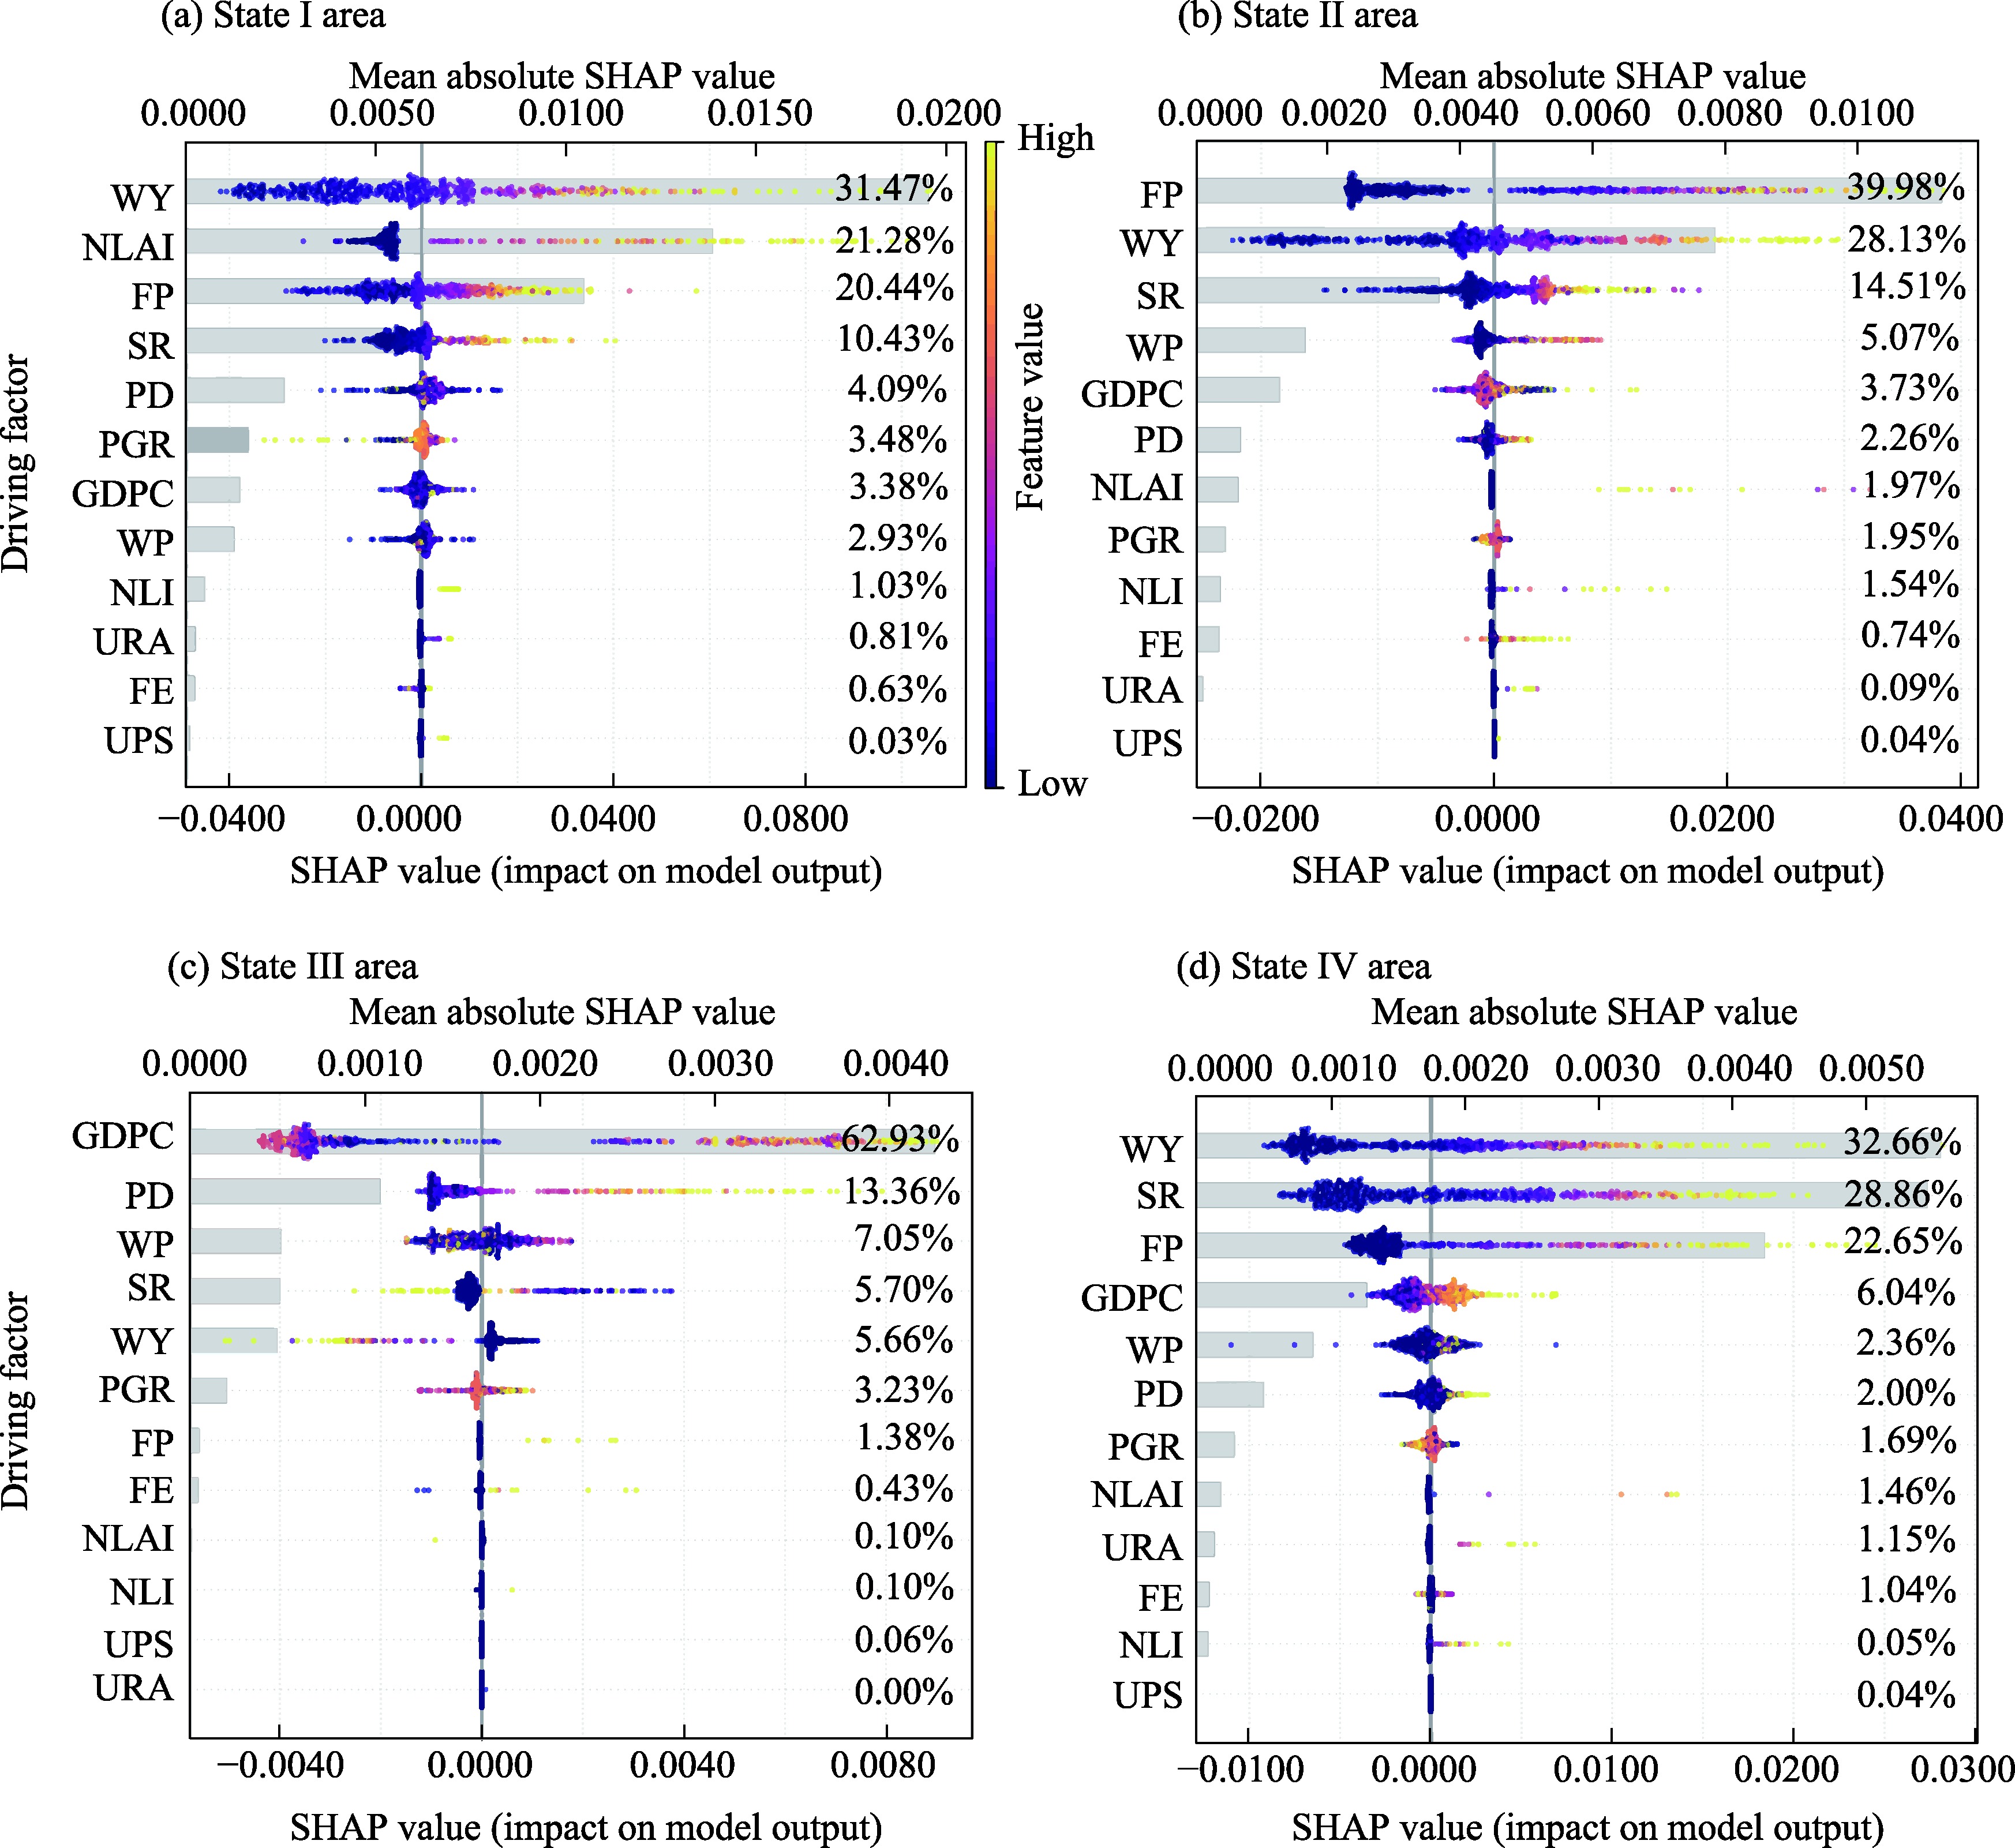
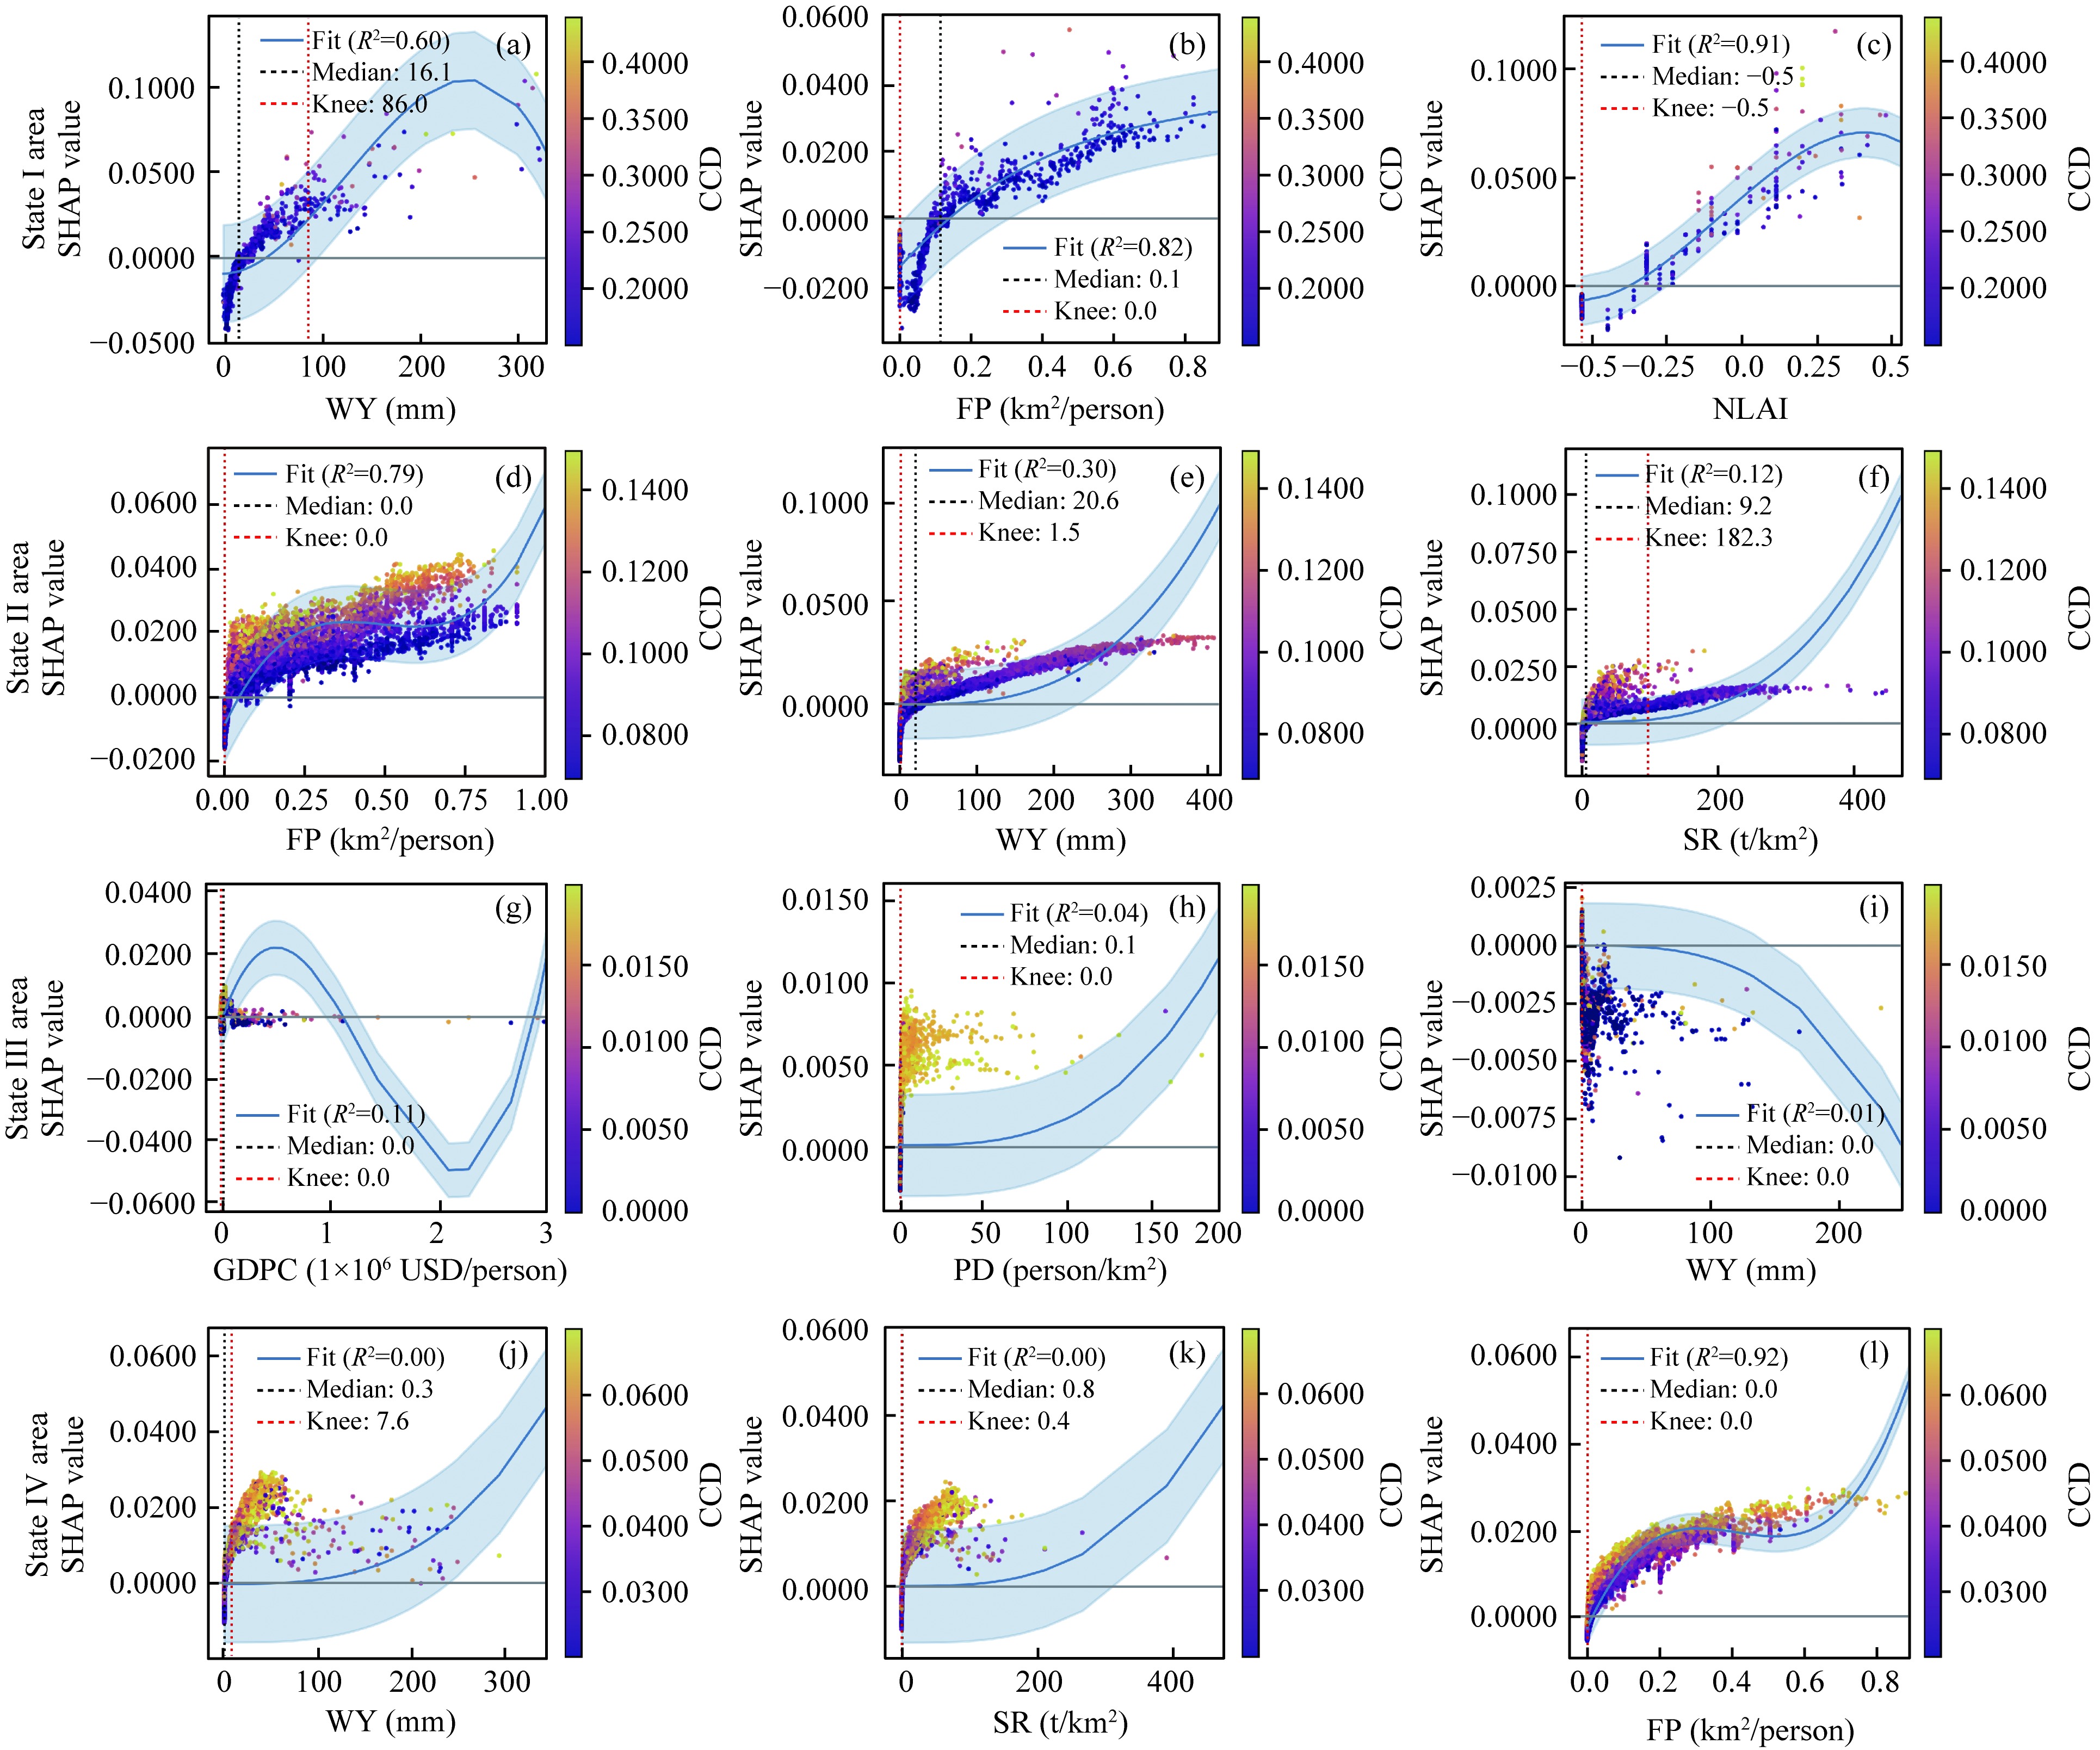
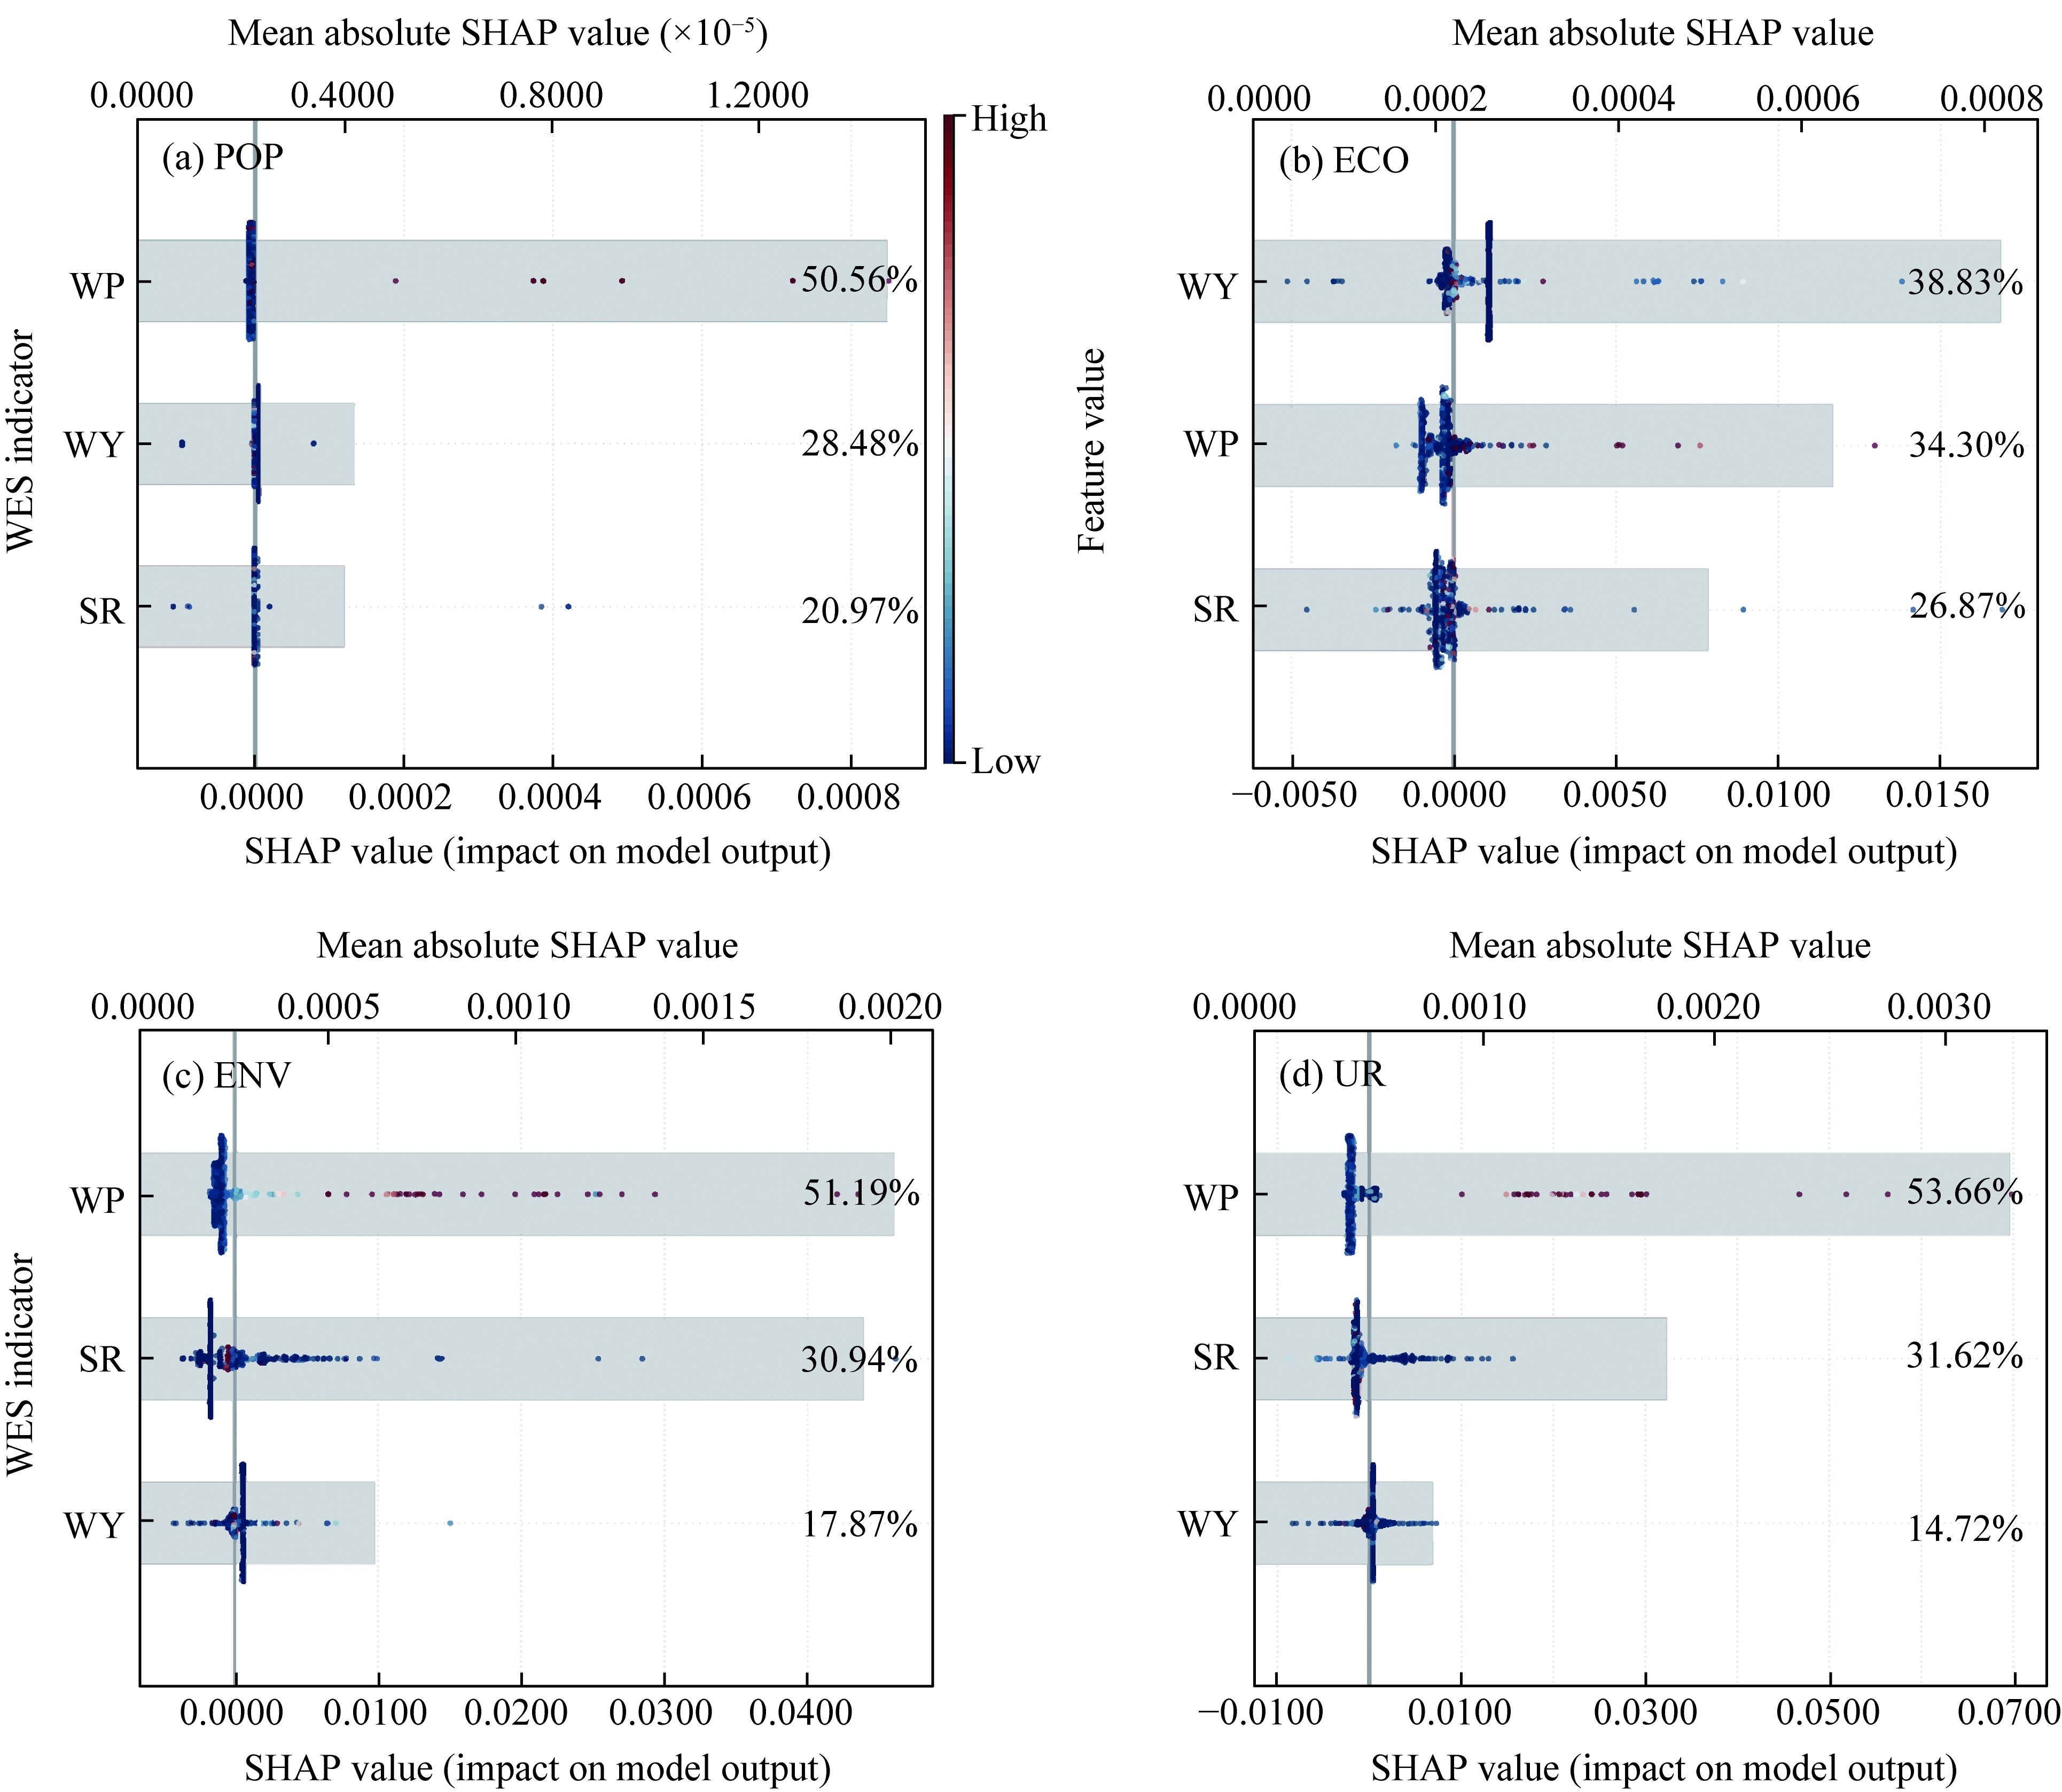
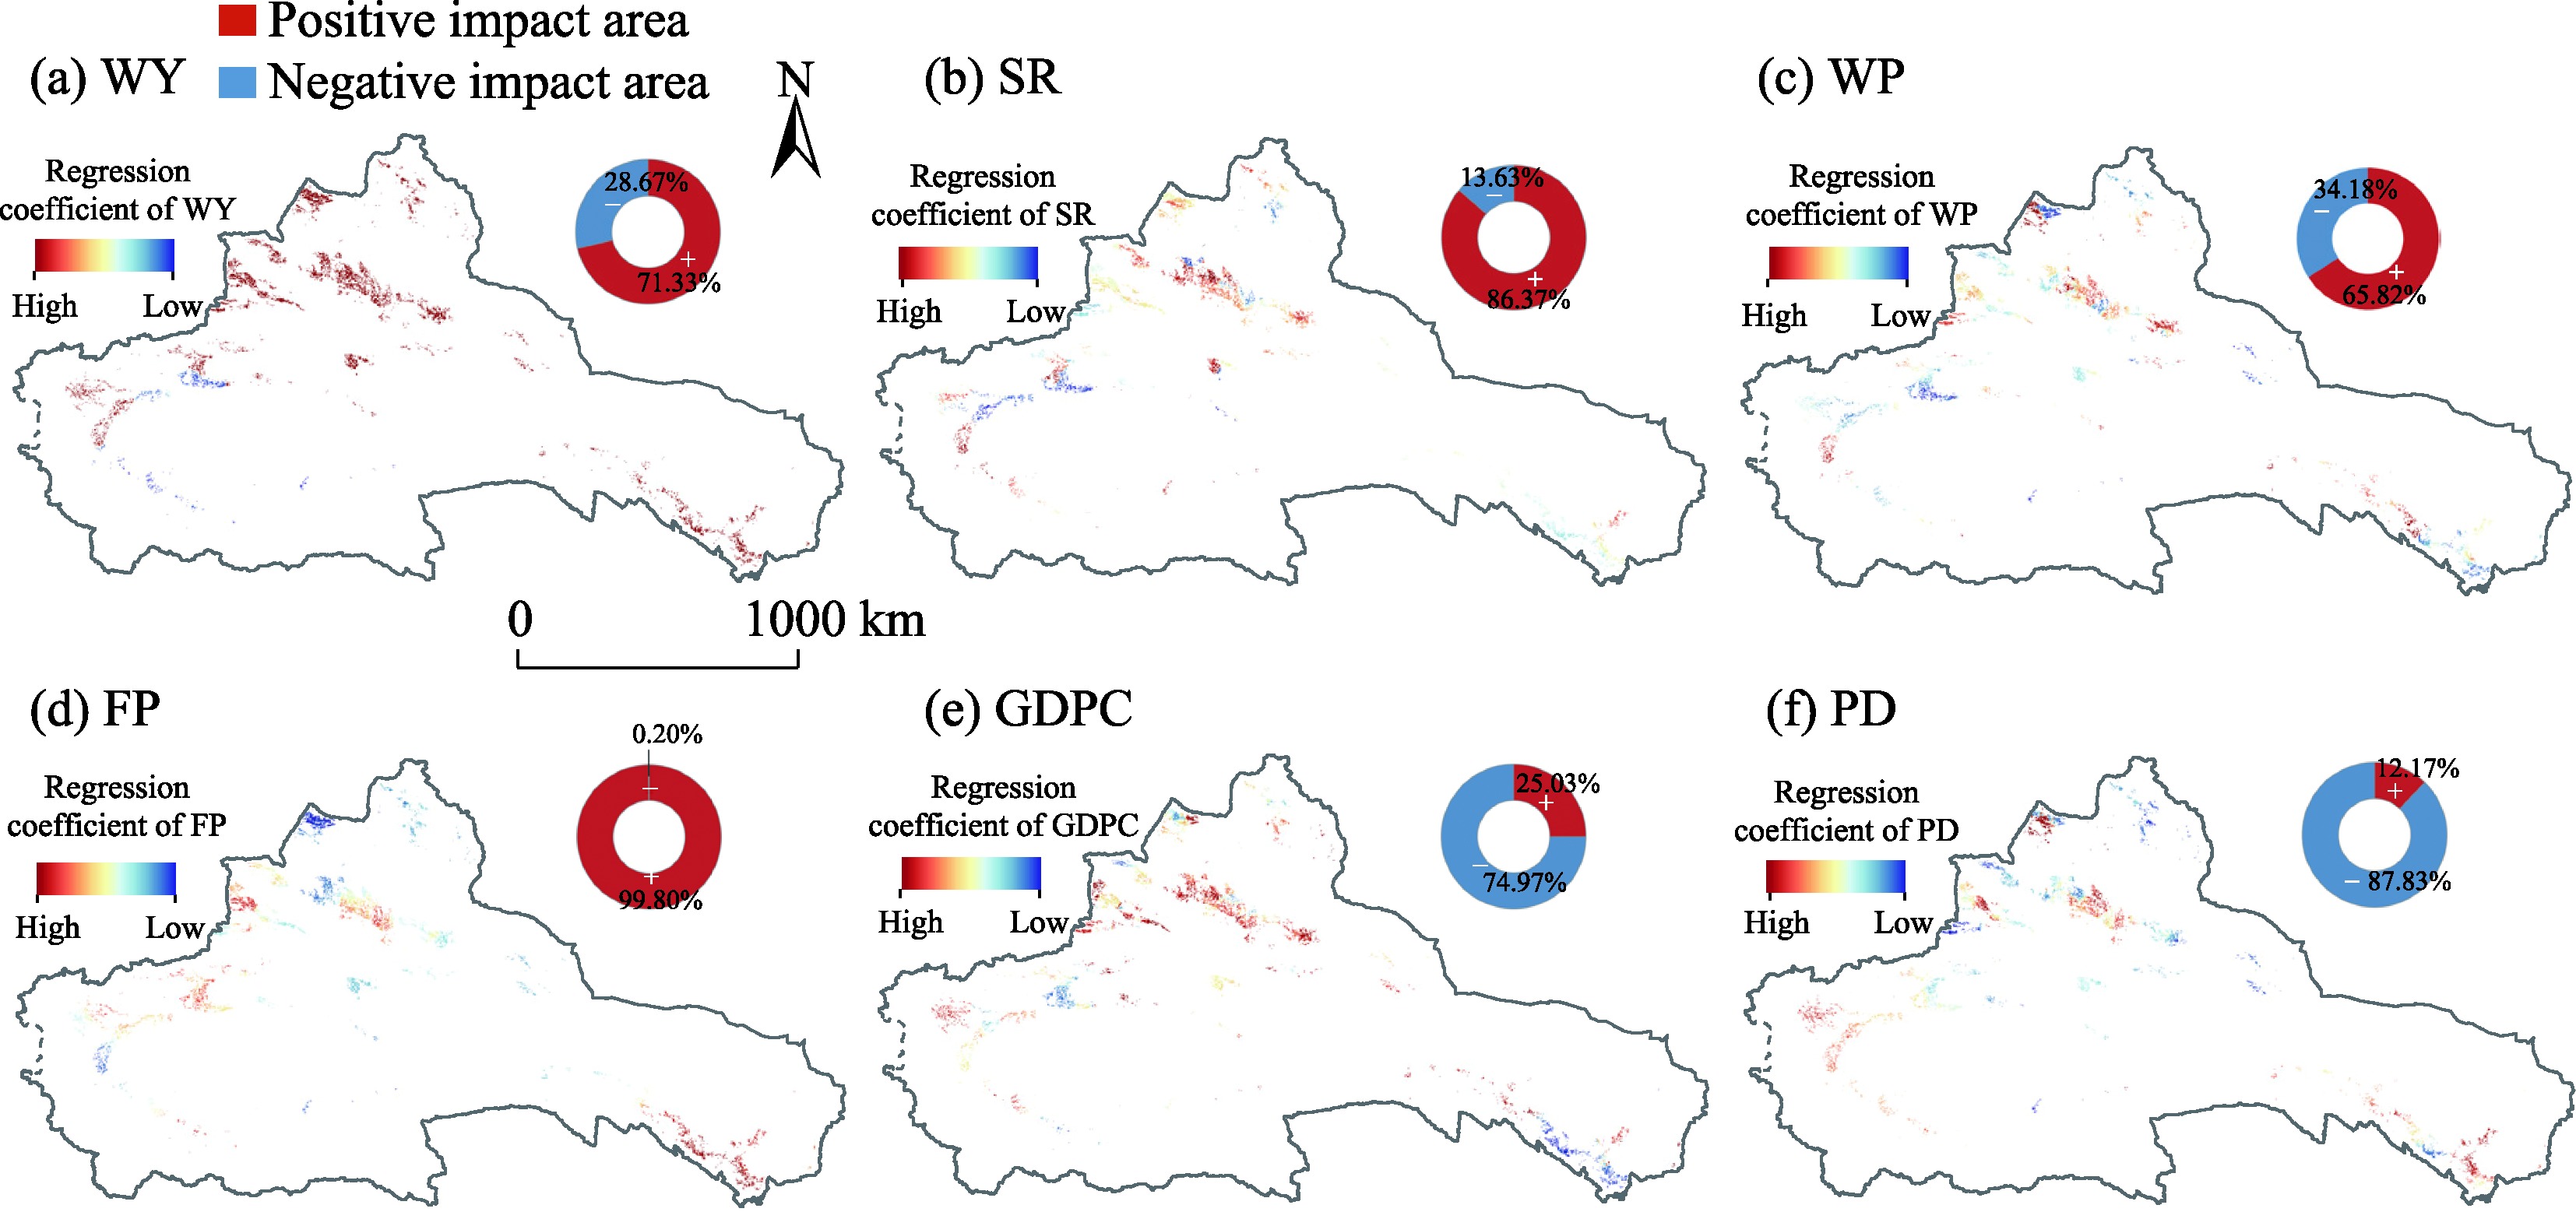
Abstract Within the context of global climate change and rapid urbanization, increasing urban resilience (UR) is especially important in the arid region of Northwest China (ANC), where fragile ecosystems and an uneven water distribution create significant sustainability challenges. In this study, a coupled UR-water ecosystem services (WESs) framework was developed on the basis of 1-km resolution remote sensing data for the 2000-2020 period obtained from the Landsat series, Defense Meteorological Satellite Program (DMSP)/Operational Linescan System (OLS), and Global Precipitation Measurement (GPM), among other sources. Within the framework, the Integrated Valuation of Ecosystem Services and Tradeoffs (InVEST) model was incorporated to provide a WES indicator system. Moreover, entropy weighting was employed to quantify both UR and WES indicators; the coupling coordination degree (CCD) model was used to measure the coupled relationship between UR and WESs; an extreme gradient boosting (XGBoost)-SHapley Additive exPlanations (SHAP) interpretation approach was adopted to identify key drivers and underlying mechanisms; and Geographically Weighted Regression (GWR) was applied to capture spatial distribution characteristics of major driving factors. The results indicated that UR steadily increased from 4.60×10⁻³ to 10.24×10⁻³, whereas WESs followed an inverted V-shaped trend, with a peak value observed in 2010 (11.84×10⁻³). The CCD remained consistently low (mean: 0.0166-0.0246) and exhibited considerable spatial heterogeneity. Notably, the degree of coordination was greater in the oasis and mountain core areas but significantly lower at desert areas. XGBoost-SHAP model analysis revealed six key drivers influencing various states of the CCD between UR and WESs systems. The contributions of these factors could be ranked as follows: water yield (WY; 24.30%)>farmland area per capita (FP; 21.10%)>gross domestic product (GDP) per capita (GDPC; 19.00%)>soil retention (SR; 14.90%)>population density (PD; 5.42%)>water purification (WP; 4.40%). In contrast, in UR system, WP (53.66%) and SR (31.62%) served as the dominant drivers. Moreover, the dominant drivers shifted from a combination of natural and socioeconomic factors in State I (sustainable high resilience) to primarily socioeconomic factors in State III (unsustainable low resilience). SR and WP exerted positive moderating effects, whereas socioeconomic factors such as GDPC and PD exerted inhibitory effects on the coordination relationship. This research highlights that UR in the ANC region is limited mainly by water scarcity, weak feedback loops, and spatial variability, emphasizing the need for tailored intervention strategies.
|
|
Received: 09 October 2025
Published: 31 March 2026
|
|
Corresponding Authors:
*HE Jia (E-mail: hejiahj@xjnu.edu.cn)
|
|
|
| [1] |
Ahern J. 2011. From fail-safe to safe-to-fail: Sustainability and resilience in the new urban world. Landscape and Urban Planning, 100(4): 341-343.
doi: 10.1016/j.landurbplan.2011.02.021
|
|
|
| [2] |
Alghamdi F M, Edwards E C, Berglund E Z. 2024. Dynamic pricing framework for water demand management using advanced metering infrastructure data. Water Resources Research, 60(9): 2023WR035246, doi: 10.1029/2023WR035246.
|
|
|
| [3] |
An L, Zhong S, Shen L. 2022. Dynamic effects of climate and land use policies on water yield in drylands—A case study in the northwest of China. Water, 14(23): 3940, doi: 10.3390/w14233940.
|
|
|
| [4] |
Arfanuzzaman M, Rahman A A. 2017. Sustainable water demand management in the face of rapid urbanization and ground water depletion for social-ecological resilience building. Global Ecology and Conservation, 10: 9-22.
doi: 10.1016/j.gecco.2017.01.005
|
|
|
| [5] |
Baak M, Koopman R, Snoek H, et al. 2020. A new correlation coefficient between categorical, ordinal and interval variables with Pearson characteristics. Computational Statistics & Data Analysis, 152: 107043, doi: 10.1016/j.csda.2020.107043.
|
|
|
| [6] |
Bassett C G, Day S D, Konijnendijk C C, et al. 2025. From tyranny to hope: Harnessing the power of small decisions to achieve urban sustainability goals. Environmental Science & Policy, 170: 104125, doi: 10.1016/j.envsci.2025.104125.
|
|
|
| [7] |
Brauman K A, Daily G C, Duarte T K, et al. 2007. The nature and value of ecosystem services: an overview highlighting hydrologic services. Annual Review of Environment and Resources, 32: 67-98.
|
|
|
| [8] |
Brunsdont C, Fotheringham S, Charlton M. 1998. Geographically weighted regression—modelling spatial non-stationarity. Journal of the Royal Statistical Society: Series D: The Statistician, 47(3): 431-443.
|
|
|
| [9] |
Cao X, Luo Y Y, Chen X L, et al. 2024. Spatial valuation of urban green lungs: Unveiling the true worth of urban parks through MGWR in Chengdu, China. Land Use Policy, 145: 107225, doi: 10.1016/j.landusepol.2024.107225.
|
|
|
| [10] |
Cao X Y, Jiao J Z, Liu X L, et al. 2022. Establishment of an ecological security pattern under arid conditions based on ecological carrying capacity: A case study of arid area in Northwest China. Sustainability, 14(23): 15799, doi: 10.3390/su142315799.
|
|
|
| [11] |
Chen T, Guestrin C. 2016. XGBoost: A scalable tree boosting system. In: Proceedings of the 22nd ACM SIGKDD International Conference on Knowledge Discovery and Data Mining (KDD '16). Association for Computing Machinery (ACM). San Francisco, USA.
|
|
|
| [12] |
Chen Y N, Li Z Q, Xu J H, et al. 2023. Changes and protection suggestions in water resources and ecological environment in arid region of Northwest China. Bulletin of Chinese Academy of Sciences, 38(3): 385-393. (in Chinese)
|
|
|
| [13] |
Cheng Y, Liu H Y, Wang H Y, et al. 2020. Climate-driven holocene migration of forest-steppe ecotone in the Tien Mountains. Forests, 11(11): 1139, doi: 10.3390/f11111139.
|
|
|
| [14] |
Chi C, Shen J Q, Gao X, et al. 2024. Spatiotemporal changes of ecosystem services value and cross regional ecological compensation in the Yangtze River Basin. Environment, Development and Sustainability, doi: 10.1007/s10668-024-05376-w.
|
|
|
| [15] |
Chung M G, Frank K A, Pokhrel Y, et al. 2021. Natural infrastructure in sustaining global urban freshwater ecosystem services. Nature Sustainability, 4(12): 1068-1075.
doi: 10.1038/s41893-021-00786-4
|
|
|
| [16] |
Costanza R, de Groot R, Sutton P, et al. 2014. Changes in the global value of ecosystem services. Global Environmental Change, 26: 152-158.
doi: 10.1016/j.gloenvcha.2014.04.002
|
|
|
| [17] |
Dan Y E, Tian H, Farid M A, et al. 2024. Evolution characteristics of meteorological and hydrological drought in an arid oasis of Northwest China. Water, 16(15): 2088, doi: 10.3390/w16152088.
|
|
|
| [18] |
Das S, Choudhury M R, Chatterjee B, et al. 2024. Unraveling the urban climate crisis: Exploring the nexus of urbanization, climate change, and their impacts on the environment and human well-being-A global perspective. AIMS Public Health, 11(3): 963-1001.
doi: 10.3934/publichealth.2024050
|
|
|
| [19] |
Dasgupta P. 2021. The Economics of Biodiversity: The Dasgupta Review. London: HM Treasury.
|
|
|
| [20] |
Dennedy-Frank P J, Muenich R L, Chaubey I, et al. 2016. Comparing two tools for ecosystem service assessments regarding water resources decisions. Journal of Environmental Management, 177: 331-340.
doi: 10.1016/j.jenvman.2016.03.012
pmid: 27111651
|
|
|
| [21] |
Diaz C G, Zambrana-Vasquez D, Bartolome C. 2024. Building resilient cities: A comprehensive review of climate change adaptation indicators for urban design. Energies, 17(8): 1959, doi: 10.3390/en17081959.
|
|
|
| [22] |
Ding J Y, Bai Y P, Yang X D, et al. 2022. Spatiotemporal evolution of water resource utilization and economic development in the arid region of China: A "matching-constraint" perspective. Sustainability, 14(14): 8724, doi: 10.3390/su14148724.
|
|
|
| [23] |
Ding M T, Heiser M, Hübl J, et al. 2016. Regional vulnerability assessment for debris flows in China-a CWS approach. Landslides, 13(3): 537-550.
doi: 10.1007/s10346-015-0578-1
|
|
|
| [24] |
Ding Q. 2021. Ecosystem services evaluation and trade-offs effects in Central Asia. PhD Dissertation. Beijing: China University of Geosciences. (in Chinese)
|
|
|
| [25] |
Egbueri J C, Agbasi J C. 2022. Combining data-intelligent algorithms for the assessment and predictive modeling of groundwater resources quality in parts of southeastern Nigeria. Environmental Science and Pollution Research, 29(38): 57147-57171.
doi: 10.1007/s11356-022-19818-3
|
|
|
| [26] |
Elmqvist T, Andersson E, Frantzeskaki N, et al. 2019. Sustainability and resilience for transformation in the urban century. Nature Sustainability, 2(4): 267-273.
doi: 10.1038/s41893-019-0250-1
|
|
|
| [27] |
Elsharqawy H R, Elbarmelgy M M, Elmalt A E. 2022. Evolutionary urban resilience as an incremental approach to sustainability: a multifunctional pluvial flood and wastewater risk reduction framework. Journal of Engineering and Applied Science, 69(1): 80, doi: 10.1186/s44147-022-00136-x.
|
|
|
| [28] |
Fan Y B, Wang C G, Nan Z B. 2014. Comparative evaluation of crop water use efficiency, economic analysis and net household profit simulation in arid Northwest China. Agricultural Water Management, 146: 335-345.
doi: 10.1016/j.agwat.2014.09.001
|
|
|
| [29] |
Feng X H, Lei J, Xiu C L, et al. 2020. Analysis of spatial scale effect on urban resilience: A case study of Shenyang, China. Chinese Geographical Science, 30(6): 1005-1021.
doi: 10.1007/s11769-020-1163-7
|
|
|
| [30] |
Folke C, Biggs R, Norström A V, et al. 2016. Social-ecological resilience and biosphere-based sustainability science. Ecology and Society, 21(3): 41, doi: 10.5751/es-08748-210341.
|
|
|
| [31] |
Fotheringham A S, Brunsdon C F, Charlton M E. 2002. Geographically Weighted Regression: The Analysis of Spatially Varying Relationships. Chichester: John Wiley & Sons, 39-55.
|
|
|
| [32] |
Gao G L, Feng Q, Xu E W, et al. 2025. Carbon dioxide and water exchanges of a Qinghai spruce forest ecosystem in the Qilian Mountains in northwestern China. Journal of Hydrology, 658: 133987, doi: 10.1016/j.jhydrol.2025.133987.
|
|
|
| [33] |
Grimm N B, Faeth S H, Golubiewski N E, et al. 2008. Global change and the ecology of cities. Science, 319(5864): 756-760.
doi: 10.1126/science.1150195
pmid: 18258902
|
|
|
| [34] |
Grison C, Koop S, Eisenreich S, et al. 2023. Integrated water resources management in cities in the world: Global challenges. Water Resources Management, 37(6): 2787-2803.
doi: 10.1007/s11269-023-03475-3
|
|
|
| [35] |
Ha L T, Bastiaanssen W G. 2023. Determination of spatially-distributed Hydrological Ecosystem Services (HESS) in the Red River Delta using a calibrated SWAT model. Sustainability, 15(7): 6247, doi: 10.3390/su15076247.
|
|
|
| [36] |
Ha L T, Bastiaanssen W G, Simons G W, et al. 2023. A new framework of 17 hydrological ecosystem services (HESS17) for supporting river basin planning and environmental monitoring. Sustainability, 15(7): 6182, doi: 10.3390/su15076182.
|
|
|
| [37] |
Hou P, Zhu H S, Zhai J, et al. 2024. Gradient analysis of spatial-temporal change and conservation effectiveness in different ecological protected areas. Diversity, 16(5): 265, doi: 10.3390/d16050265.
|
|
|
| [38] |
Hu L T, Meng J, Xiong C Y, et al. 2024. City-level resilience to extreme weather shocks revealed by satellite nighttime lights in China. Sustainable Cities and Society, 101: 105167, doi: 10.1016/j.scs.2023.105167.
|
|
|
| [39] |
Jahan S, Singh A. 2023. Causes and impact of industrial effluents on receiving water bodies: A review. Malaysian Journal of Science and Advanced Technology, 3(2): 111-121.
|
|
|
| [40] |
Jiang M, Yang S W, Zhou G H. 2024. Study on the coupling coordination development between the digital economy and innovation efficiency: Evidence from the urban agglomeration in the middle reaches of the Yangtze River. Land, 13(3): 292, doi: 10.3390/land13030292.
|
|
|
| [41] |
Leal Filho W, Barbir J, Sima M, et al. 2020. Reviewing the role of ecosystems services in the sustainability of the urban environment: A multi-country analysis. Journal of Cleaner Production, 262: 121338, doi: 10.1016/j.jclepro.2020.121338.
|
|
|
| [42] |
Li D, Chu Z S, Zeng Z Z, et al. 2021. Effects of design parameters, microbial community and nitrogen removal on the field-scale multi-pond constructed wetlands. Science of The Total Environment, 797: 148989, doi: 10.1016/j.scitotenv.2021.148989.
|
|
|
| [43] |
Liu J Y, Wan J, Li S R, et al. 2024a. Spatial-temporal pattern of coordination between the supply and demand for ecosystem services in the Lhasa River Basin. Land, 13(4): 510, doi: 10.3390/land13040510.
|
|
|
| [44] |
Liu J Y, Cai Y X, Shen X W. 2025. Integrating machine learning, SHAP interpretability, and deep learning approaches in the study of environmental and economic factors: A case study of residential segregation in Las Vegas. Land, 14(5): 957, doi: 10.3390/land14050957.
|
|
|
| [45] |
Liu L, Luo Y, Pei J J, et al. 2021. Temporal and spatial differentiation in urban resilience and its influencing factors in Henan Province. Sustainability, 13(22): 12460, doi: 10.3390/su132212460.
|
|
|
| [46] |
Liu S C, Peng F L, Qiao Y K, et al. 2024b. Quantitative evaluation of the contribution of underground space to urban resilience: A case study in China. Underground Space, 17: 1-24.
doi: 10.1016/j.undsp.2023.11.007
|
|
|
| [47] |
Liu Y H, Liu W Y, Zhang X Y, et al. 2023. Nighttime light perspective in urban resilience assessment and spatiotemporal impact of COVID-19 from January to June 2022 in mainland China. Urban Climate, 50: 101591, doi: 10.1016/j.uclim.2023.101591.
|
|
|
| [48] |
Lü C M, Xu W C, Ling M H, et al. 2023. Evaluation of synergetic development of water and land resources based on a coupling coordination degree model. Water, 15(8): 1491, doi: 10.3390/w15081491.
|
|
|
| [49] |
Lundberg S M, Lee S I. 2017. A unified approach to interpreting model predictions. Advances in Neural Information Processing Systems, 30: 4765-4774.
|
|
|
| [50] |
Ma F, Wang Z H, Sun Q P, et al. 2020. Spatial-temporal evolution of urban resilience and its influencing factors: Evidence from the Guanzhong Plain Urban Agglomeration. Sustainability, 12(7): 2593, doi: 10.3390/su12072593.
|
|
|
| [51] |
Macedo P, Madaleno M. 2022. Global temperature and carbon dioxide nexus: Evidence from a maximum entropy approach. Energies, 16(1): 277, doi: 10.3390/en16010277.
|
|
|
| [52] |
Miti C, Milne A E, Giller K E, et al. 2025. Evaluating boundary line fitting approaches for detecting yield-limiting factors and critical soil nutrient concentrations. European Journal of Agronomy, 170: 127744, doi: 10.1016/j.eja.2025.127744.
|
|
|
| [53] |
Okolo C V, Wen J, Susaeta A. 2024. Maximizing natural resource rent economics: The role of human capital development, financial sector development, and open-trade economies in driving technological innovation. Environmental Science and Pollution Research, 31(3): 4453-4477.
doi: 10.1007/s11356-023-31373-z
|
|
|
| [54] |
Partelow S, Villamayor-Tomas S, Eisenack K, et al. 2024. A meta-analysis of SES framework case studies: Identifying dyad and triad archetypes. People and Nature, 6(3): 1229-1247.
doi: 10.1002/pan3.v6.3
|
|
|
| [55] |
Pattison J E, Cooke P. 2024. Groundwater: sinking cities, urbanisation, global drying, population growth. The Journal of Population and Sustainability, 8(2): 77-104.
doi: 10.3197/JPS.63799977346492
|
|
|
| [56] |
Peng K J, He X R, Xu C X. 2023. Coupling coordination relationship and dynamic response between urbanization and urban resilience: case of Yangtze River Delta. Sustainability, 15(3): 2702, doi: 10.3390/su15032702.
|
|
|
| [57] |
Potschin-Young M, Haines-Young R, Görg C, et al. 2018. Understanding the role of conceptual frameworks: Reading the ecosystem service cascade. Ecosystem Services, 29: 428-440.
doi: 10.1016/j.ecoser.2017.05.015
pmid: 31008045
|
|
|
| [58] |
Rafiei-Sardooi E, Azareh A, Choubin B, et al. 2021. Evaluating urban flood risk using hybrid method of TOPSIS and machine learning. International Journal of Disaster Risk Reduction, 66: 102614, doi: 10.1016/j.ijdrr.2021.102614.
|
|
|
| [59] |
Redhead J W, May L, Oliver T H, et al. 2018. National scale evaluation of the InVEST nutrient retention model in the United Kingdom. Science of The Total Environment, 610-611: 666-677.
doi: 10.1016/j.scitotenv.2017.08.092
|
|
|
| [60] |
Ruiz Serrano A, Musumeci A, Li J J, et al. 2025. Rationality and the exploitation of natural resources: A psychobiological conceptual model for sustainability. Environment, Development and Sustainability, 27: 13167-13189.
doi: 10.1007/s10668-024-04470-3
|
|
|
| [61] |
Schober P, Boer C, Schwarte L A. 2018. Correlation coefficients: appropriate use and interpretation. Anesthesia & Analgesia, 126(5): 1763-1768.
|
|
|
| [62] |
Seto K C, Güneralp B, Hutyra L R. 2012. Global forecasts of urban expansion to 2030 and direct impacts on biodiversity and carbon pools. Proceedings of the National Academy of Sciences, 109(40): 16083-16088.
|
|
|
| [63] |
Shishegar S, Duchesne S, Pelletier G. 2019. An integrated optimization and rule-based approach for predictive real time control of urban stormwater management systems. Journal of Hydrology, 577: 124000, doi: 10.1016/j.jhydrol.2019.124000.
|
|
|
| [64] |
Su C H, Dong M, Fu B J, et al. 2020. Scale effects of sediment retention, water yield, and net primary production: A case-study of the Chinese Loess Plateau. Land Degradation & Development, 31(11): 1408-1421.
doi: 10.1002/ldr.v31.11
|
|
|
| [65] |
Wang H J, Pan Y P, Chen Y N. 2017. Comparison of three drought indices and their evolutionary characteristics in the arid region of northwestern China. Atmospheric Science Letters, 18(3): 132-139.
doi: 10.1002/asl.2017.18.issue-3
|
|
|
| [66] |
Wang H L, Chen Y B, Kang J, et al. 2023a. An XGBoost-Based predictive control strategy for HVAC systems in providing day-ahead demand response. Building and Environment, 238: 110350, doi: 10.1016/j.buildenv.2023.110350.
|
|
|
| [67] |
Wang J Y, Shao Z F, Zhuang Q W, et al. 2025. Multi-scale coupling quantitative assessment of ecological-urban resilience in the Yangtze River Economic Belt. Geo-Spatial Information Science, 28(5): 2142-2162.
doi: 10.1080/10095020.2025.2486287
|
|
|
| [68] |
Wang L, Xue X L, Zhang Y X, et al. 2018. Exploring the emerging evolution trends of urban resilience research by scientometric analysis. International Journal of Environmental Research and Public Health, 15(10): 2181, doi: 10.3390/ijerph15102181.
|
|
|
| [69] |
Wang S M, Liu Q H, Huang C. 2021. Vegetation change and its response to climate extremes in the arid region of Northwest China. Remote Sensing, 13(7): 1230, doi: 10.3390/rs13071230.
|
|
|
| [70] |
Wang Y P, Cheng H Y, Wang N A, et al. 2023b. Trade-off and synergy relationships and spatial bundle analysis of ecosystem services in the Qilian Mountains. Remote Sensing, 15(11): 2950, doi: 10.3390/rs15112950.
|
|
|
| [71] |
Wang Y S, Zhang F, Chen W Y, et al. 2025. Critical phase transitions and early-warning frameworks for ecological networks in typical arid regions. Journal of Cleaner Production, 531: 146888, doi: 10.1016/j.jclepro.2025.146888.
|
|
|
| [72] |
Wu Y F, Zhang X, Li C, et al. 2021. Ecosystem service trade-offs and synergies under influence of climate and land cover change in an afforested semiarid basin, China. Ecological Engineering, 159: 106083, doi: 10.1016/j.ecoleng.2020.106083.
|
|
|
| [73] |
Xiao S, Duo L H, Guo X F, et al. 2023a. Research on the coupling coordination and driving role of urbanization and ecological resilience in the middle and lower reaches of the Yangtze River. PeerJ, 11: e15869, doi: 10.7717/peerj.15869.
|
|
|
| [74] |
Xiao Y, Zhong J L, Wang J, et al. 2023b. Exploring the coupling coordination relationship of urban resilience system in ecologically fragile areas: case study of the Loess Plateau in China. Land, 12(11): 1997, doi: 10.3390/land12111997.
|
|
|
| [75] |
Xu H F, Raanan H, Dai G Z, et al. 2021. Reading and surviving the harsh conditions in desert biological soil crust: The cyanobacterial viewpoint. Fems Microbiology Reviews, 45(6): fuab036, doi: 10.1093/femsre/fuab036.
|
|
|
| [76] |
Xu Y Y, Liu Z, Walker T R, et al. 2024. Spatio-temporal patterns and spillover effects of synergy on carbon dioxide emission and pollution reductions in the Yangtze River Delta region in China. Sustainable Cities and Society, 107: 105419, doi: 10.1016/j.scs.2024.105419.
|
|
|
| [77] |
Yang H, Hou X L, Cao J S. 2023. Identifying the driving impact factors on water yield service in mountainous areas of the Beijing-Tianjin-Hebei region in China. Remote Sensing, 15(3): 727, doi: 10.3390/rs15030727.
|
|
|
| [78] |
Yang L M, Wang K P, Yi J L, et al. 2024. Socio-ecological risk analysis framework coupled with ecosystem services. The Journal of Applied Ecology, 35(5): 1419-1425. (in Chinese)
|
|
|
| [79] |
Yang X. 2020. Assessment of water yield and water purification servicesin arid inland river basins of Northwest China under thebackground of climate and land use change:A case study of the Bosten Lake basin. PhD Dissertation. Shanghai: East China Normal University. (in Chinese)
|
|
|
| [80] |
Yu T H, Jia S S, Cui X F. 2024. From efficiency to resilience: unraveling the dynamic coupling of land use economic efficiency and urban ecological resilience in Yellow River Basin. Scientific Reports, 14(1): 16518, doi: 10.1038/s41598-024-67364-4.
|
|
|
| [81] |
Zhang C, Li Y F, Zhu X D. 2016. A social-ecological resilience assessment and governance guide for urbanization processes in East China. Sustainability, 8(11): 1101, doi: 10.3390/su8111101.
|
|
|
| [82] |
Zhang J Z, Ji Q L, Skene K R, et al. 2025. Bridging resilience and sustainability: A reconciled framework for navigating social-ecological systems. Regional Environmental Change, 25(3): 106, doi: 10.1007/s10113-025-02442-5.
|
|
|
| [83] |
Zhang W B, Ma L B, Li H B, et al. 2024. Trends in the future evolution of rural settlements in oasis-desert areas under water use simulation scenarios: Take the Hexi Corridor region of China as an example. Landscape and Urban Planning, 248: 105110, doi: 10.1016/j.landurbplan.2024.105110.
|
|
|
| [84] |
Zhang X, Jie X W, Ning S N, et al. 2022. Coupling and coordinated development of urban land use economic efficiency and green manufacturing systems in the Chengdu-Chongqing Economic Circle. Sustainable Cities and Society, 85: 104012, doi: 10.1016/j.scs.2022.104012.
|
|
|
| [85] |
Zhang Y Q, Yang P L. 2022. Agricultural productive carrying capacity improve and water optimal allocation under uncertainty based on remote sensing data in Lancang County, Southwest China. Water, 14(22): 3641, doi: 10.3390/w14223641.
|
|
|
| [86] |
Zhou Y, Vales M I, Wang A X, et al. 2017. Systematic bias of correlation coefficient may explain negative accuracy of genomic prediction. Briefings in Bioinformatics, 18(5): 744-753.
doi: 10.1093/bib/bbw064
pmid: 27436121
|
|
|
|
Viewed |
|
|
|
Full text
|
|
|
|
|
Abstract
|
|
|
|
|
Cited |
|
|
|
|
| |
Shared |
|
|
|
|
| |
Discussed |
|
|
|
|