| Research article |
|


|
|
|
| Assessing future drought evolution and driving mechanisms in the Weigan River Basin under CMIP6 climate scenarios |
WANG Wenbo1,2, LIN Li1,2,*( ), CHEN Dandan1,2, YANG Jiayun1,2 ), CHEN Dandan1,2, YANG Jiayun1,2 |
1 College of Hydraulic and Civil Engineering, Xinjiang Agricultural University, Urumqi 830052, China
2 Xinjiang Key Laboratory of Hydraulic Engineering Security and Water Disasters Prevention, Urumqi 830052, China |
|
|
|
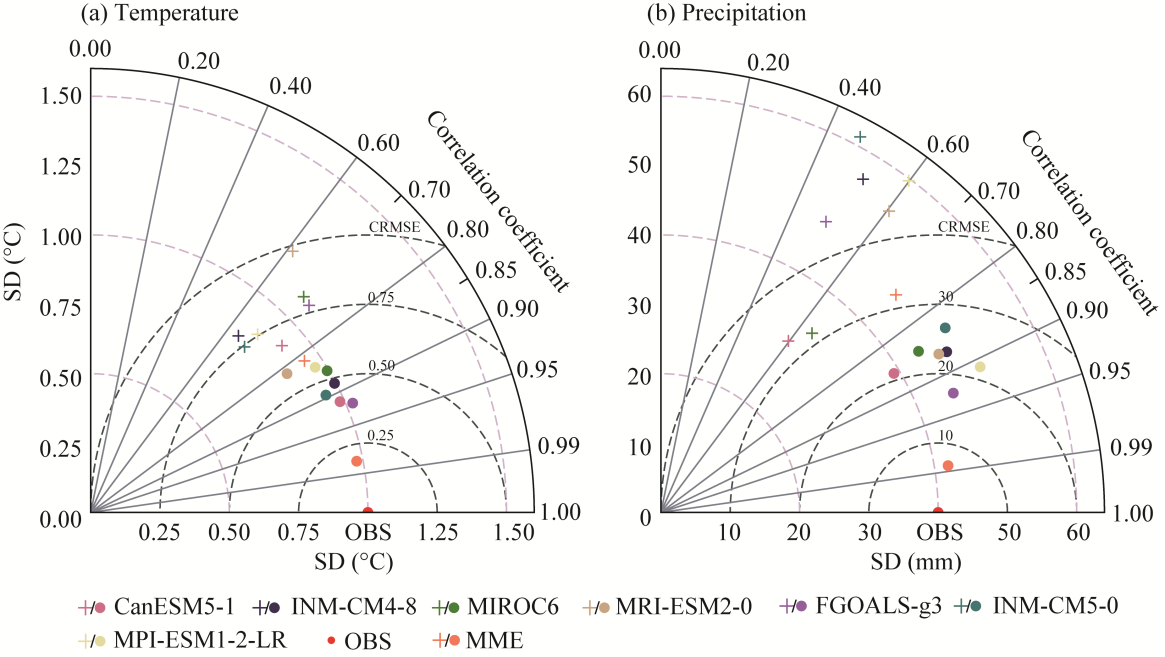
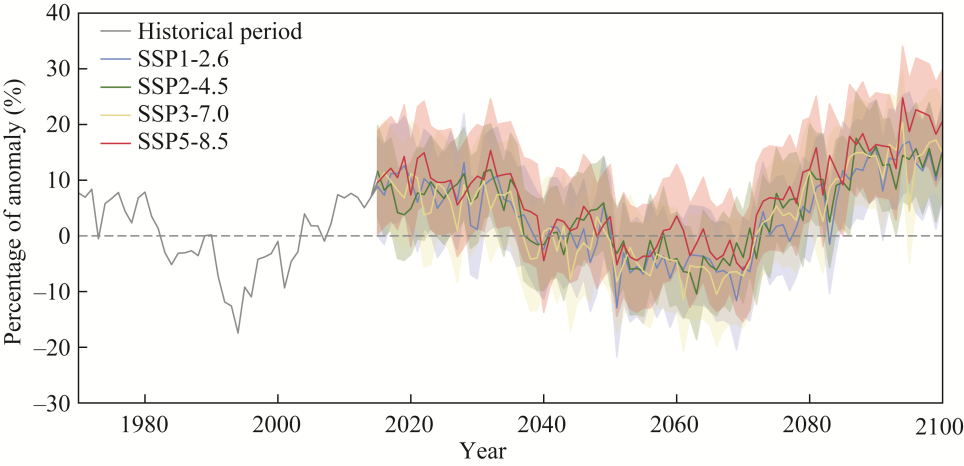
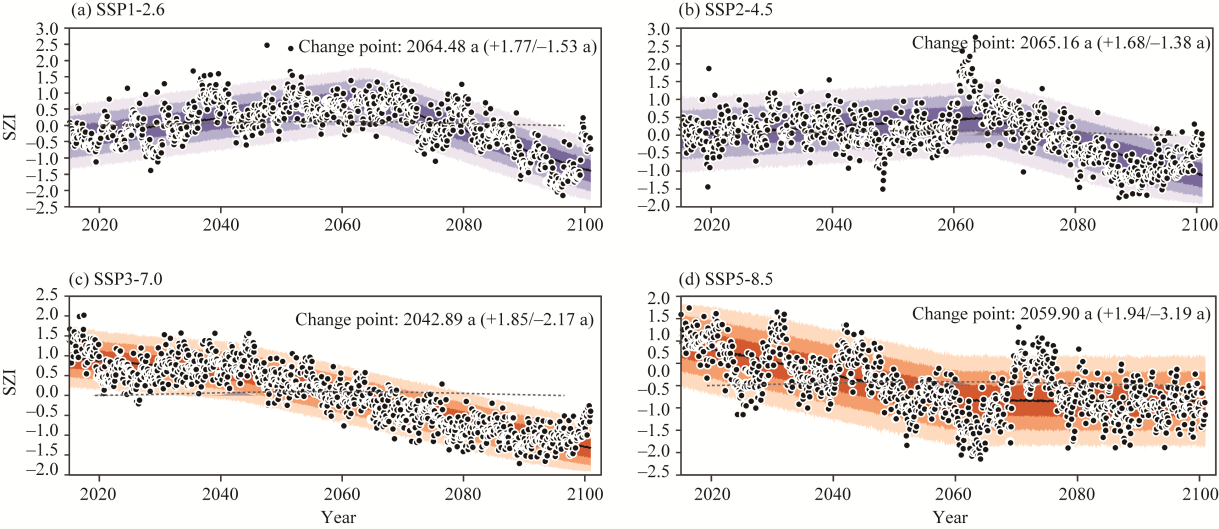
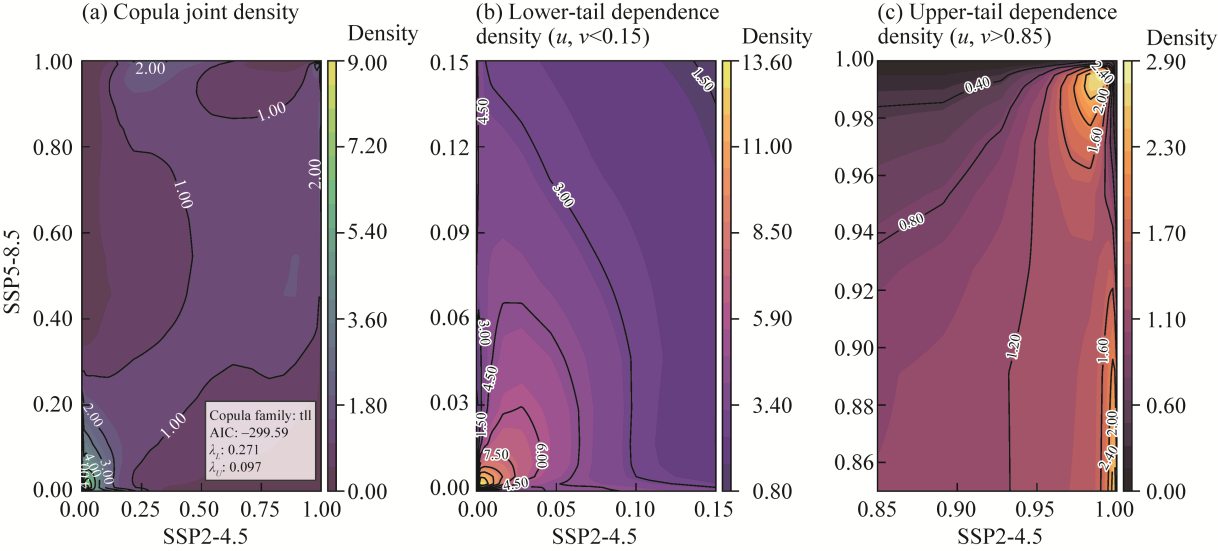
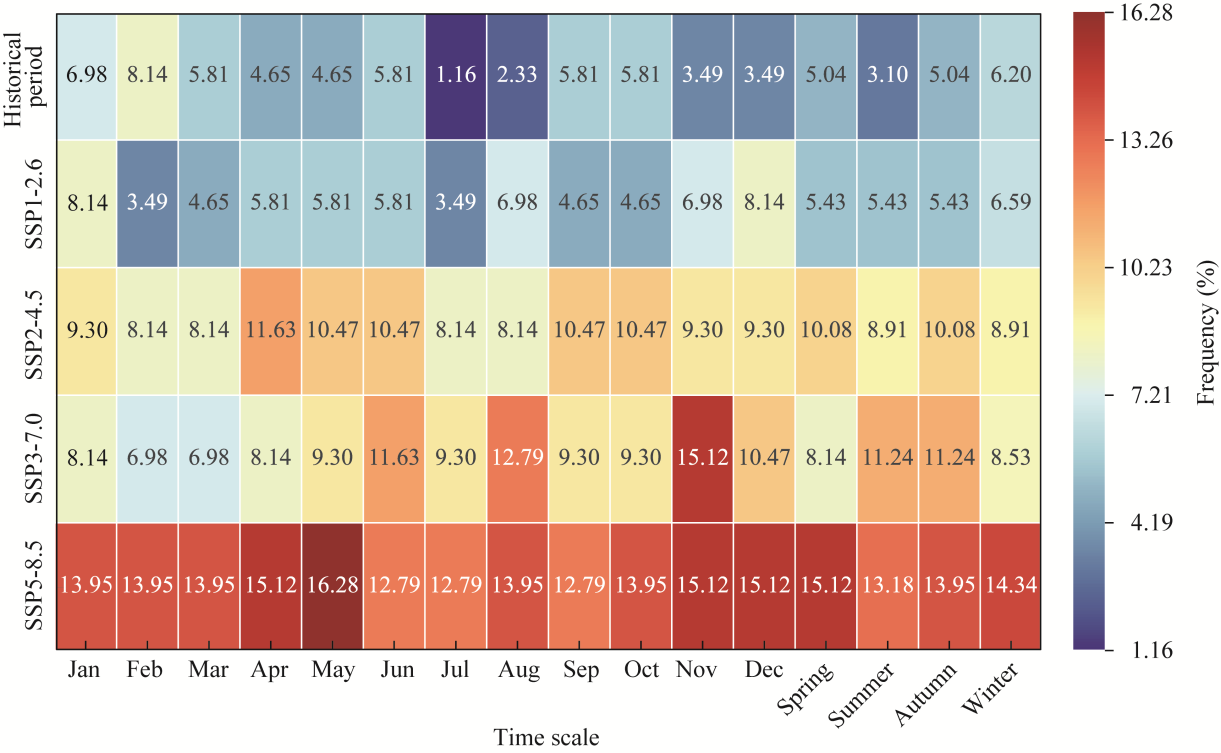
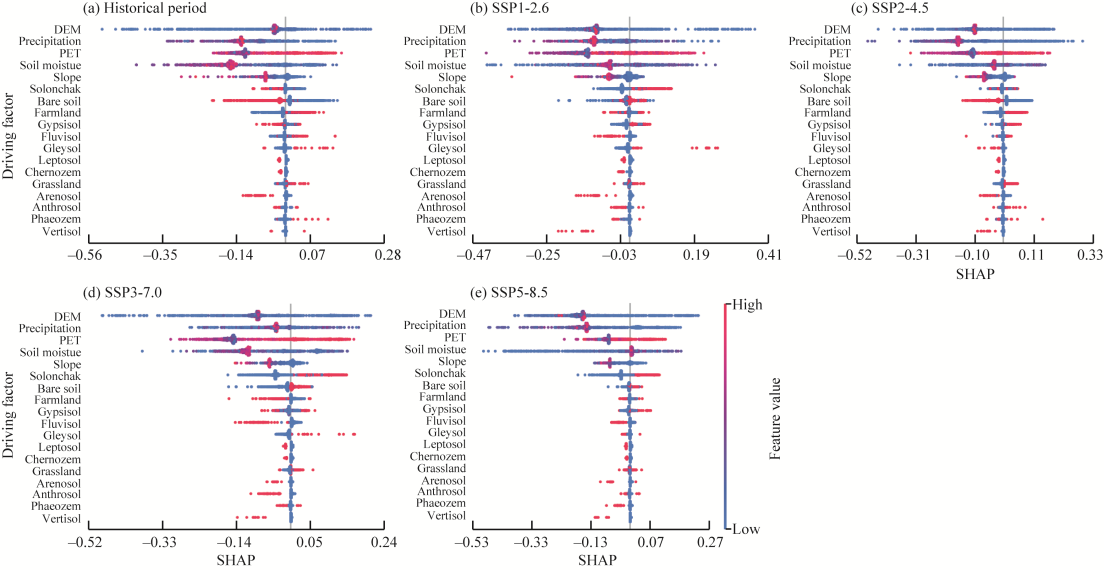
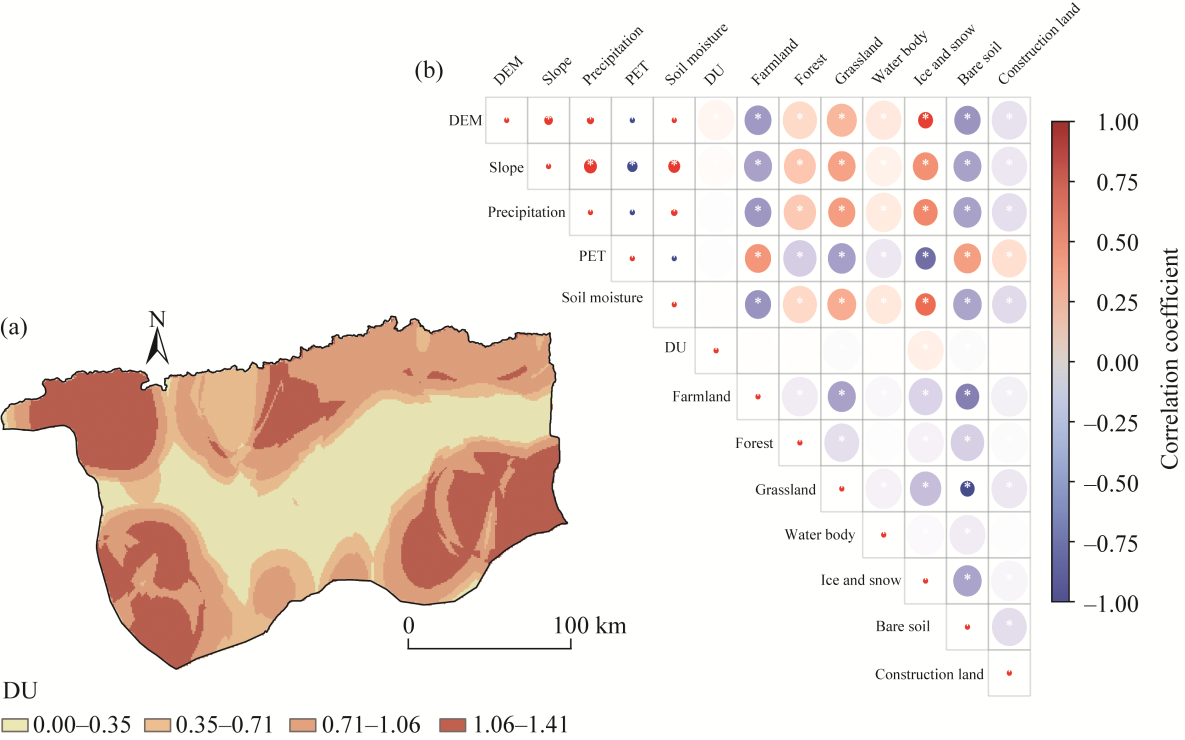
Abstract In the northern Tarim River Basin, the Weigan River Basin is a critical endorheic system characterized by extreme aridity, where drought poses a major natural hazard to agricultural production and ecological stability. This study assessed the future evolution of drought under climate change by employing the standardized moisture anomaly index (SZI) on the basis of multi-model the Coupled Model Intercomparison Project Phase 6 (CMIP6) simulations under historical conditions (1970-2014) and future scenarios (shared socioeconomic pathway (SSP)1-2.6, SSP2-4.5, SSP3-7.0 and SSP5-8.5 for 2015-2100). The results show that precipitation-evapotranspiration anomalies are projected to first decline but then increase over time, with increased fluctuations and uncertainty under high-emission scenarios (SSP5-8.5). These trends indicate intensifying drought risks and reveal a strong influence of emission pathways on regional water cycling. Temporal analysis of SZI indicates a transition from wetting to drying under low- and medium-emission pathways (SSP1-2.6 and SSP2-4.5), whereas high-emission scenarios are characterized by persistent drying and increased variability. The significant lower-tail dependence (0.271) observed under SSP2-4.5 and SSP5-8.5 suggests that extreme droughts may be subject to nonlinear co-amplification across scenarios. The frequency of moderate and more severe drought events is expected to increase substantially, especially under SSP5-8.5, where drought occurrence is predicted to extend into spring and autumn and become more evenly distributed throughout the year. Spatially, drought duration shows significant positive autocorrelation across all scenarios, with hot spots consistently concentrated in the southern and southeastern regions of the basin. Random forest analysis, interpreted as association-based pattern attribution, indicates that meteorological variables (precipitation and potential evapotranspiration (PET)) make the greatest contributions to the hot spot pattern, followed by topography and soil moisture. Among land use categories, farmland generally shows higher drought sensitivity than other land use types, as reflected by its relative contribution patterns across scenarios. The spatial pattern of drought is statistically structured by climatic forcing, surface conditions, and soil moisture status, reflecting their coupled associations with hot spot occurrence. In addition, a drought spatial uncertainty index was constructed from multi-scenario hot spot maps, revealing spatially heterogeneous structural variability throughout the basin. Correlation analysis further highlights strong internal couplings among environmental variables (e.g., elevation-linked hydroclimatic gradients and grassland-bare soil contrasts). These findings offer a scientific basis for developing region-specific drought monitoring and adaptation strategies under future climate change conditions.
|
|
Received: 30 July 2025
Published: 28 February 2026
|
|
Corresponding Authors:
*LIN Li (E-mail: klmhll@126.com)
|
|
|
| [1] |
Ayantobo O O, Wei J. 2019. Appraising regional multi-category and multi-scalar drought monitoring using standardized moisture anomaly index (SZI): a water-energy balance approach. Journal of Hydrology, 579: 124139, doi: 10.1016/j.jhydrol.2019.124139.
|
|
|
| [2] |
Behzadi F, Javadi S, Yousefi H, et al. 2024. Projections of meteorological drought severity-duration variations based on CMIP6. Scientific Reports, 14: 5027, doi: 10.1038/s41598-024-55340-x.
pmid: 38424157
|
|
|
| [3] |
Brilleman S L, Howe L D, Wolfe R, et al. 2017. Bayesian piecewise linear mixed models with a random change point: an application to BMI rebound in childhood. Epidemiology, 28(6): 827-833.
doi: 10.1097/EDE.0000000000000723
pmid: 28817471
|
|
|
| [4] |
Cannon A J, Sobie S R, Murdock T Q. 2015. Bias correction of GCM precipitation by quantile mapping: how well do methods preserve changes in quantiles and extremes? Journal of Climate, 28(17): 6938-6959.
doi: 10.1175/JCLI-D-14-00754.1
|
|
|
| [5] |
Ding X Y, Yu Y, Yang M L, et al. 2024. Investigating the effect of climate change on drought propagation in the Tarim River Basin using multi-model ensemble projections. Atmosphere, 15(1): 50, doi: 10.3390/atmos15010050.
|
|
|
| [6] |
Dirmeyer P A. 2011. The terrestrial segment of soil moisture-climate coupling. Geophysical Research Letters, 38(16): L16702, doi: 10.1029/2011GL048268.
|
|
|
| [7] |
Eyring V, Bony S, Meehl G A, et al. 2016. Overview of the Coupled Model Intercomparison Project Phase 6 (CMIP6) experimental design and organization. Geoscientific Model Development, 9(5): 1937-1958.
doi: 10.5194/gmd-9-1937-2016
|
|
|
| [8] |
Getis A, Ord J K. 1992. The analysis of spatial association by use of distance statistics. Geographical Analysis, 24(3): 189-206.
doi: 10.1111/gean.1992.24.issue-3
|
|
|
| [9] |
Guo H, Jiapaer G, Bao A M, et al. 2017. MPDI-based comparison on spatiotemporal variation of drought over oasis and desert in Tarim Basin. Journal of Desert Research, 37(4): 775-783. (in Chinese)
|
|
|
| [10] |
Hanby G, Zhai L, Mishra B, et al. 2025. A comprehensive outlook on drought caused economic losses and landowner perceptions concerning drought and erratic rainfall patterns. Forest Policy and Economics, 170: 103405, doi: 10.1016/j.forpol.2024.103405.
|
|
|
| [11] |
Huang W W, Henderson M, Liu B H, et al. 2024. Cumulative and lagged effects: seasonal characteristics of drought effects on East Asian grasslands. Remote Sensing, 16(18): 3478, doi: 10.3390/rs16183478.
|
|
|
| [12] |
Ke Y M, Shen Z F, Bai J, et al. 2020. Analysis of suitable scale for cultivated land in the Ugan River Basin accounting for water resource constraints. Arid Zone Research, 37(3): 551-561. (in Chinese)
|
|
|
| [13] |
Lei X N, Xu C C, Liu F, et al. 2023. Evaluation of CMIP6 models and multi-model ensemble for extreme precipitation over arid Central Asia. Remote Sensing, 15(9): 2376, doi: 10.3390/rs15092376.
|
|
|
| [14] |
Li H B, Wang W G, Fu J Y, et al. 2023a. Spatiotemporal heterogeneity and attributions of streamflow and baseflow changes across the headstreams of the Tarim River Basin, Northwest China. Science of The Total Environment, 856: 159230, doi: 10.1016/j.scitotenv.2022.159230.
|
|
|
| [15] |
Li J, Bevacqua E, Wang Z L, et al. 2023b. Hydroclimatic extremes contribute to asymmetric trends in ecosystem productivity loss. Communications Earth & Environment, 4: 197, doi: 10.1038/s43247-023-00869-4.
|
|
|
| [16] |
Li Q Q, Ye A Z, Wada Y, et al. 2024. Climate change leads to an expansion of global drought-sensitive area. Journal of Hydrology, 632: 130874, doi: 10.1016/j.jhydrol.2024.130874.
|
|
|
| [17] |
Li S N. 2015. Analysis on evolvement characteristics of drought under changing environment in Aksu River Basin. MSc Thesis. Handan: Hebei University of Engineering. (in Chinese)
|
|
|
| [18] |
Liu J G, Yang H, Gosling S N, et al. 2017. Water scarcity assessments in the past, present, and future. Earth's Future, 5(6): 545-559.
doi: 10.1002/eft2.2017.5.issue-6
|
|
|
| [19] |
Liu X Y, Li X M, Zhang Z R, et al. 2024. A CMIP6-based assessment of regional climate change in the Chinese Tianshan Mountains. Journal of Arid Land, 16(2): 195-219.
doi: 10.1007/s40333-024-0053-8
|
|
|
| [20] |
Meng X Y, Zhang S, Wang G Q, et al. 2025. Decoding agricultural drought resilience: a triple-validated random forest framework integrating multi-source remote sensing for high-resolution monitoring in the North China Plain. Remote Sensing, 17(8): 1404, doi: 10.3390/rs17081404.
|
|
|
| [21] |
Milly P C D, Dunne K A. 2016. Potential evapotranspiration and continental drying. Nature Climate Change, 6: 946-949.
doi: 10.1038/NCLIMATE3046
|
|
|
| [22] |
Orimoloye I R, Belle J A, Ololade O O. 2021. Drought disaster monitoring using MODIS derived index for drought years: a space-based information for ecosystems and environmental conservation. Journal of Environmental Management, 284: 112028, doi: 10.1016/j.jenvman.2021.112028.
|
|
|
| [23] |
Pathak R, Dasari H P, Ashok K, et al. 2023. Effects of multi-observations uncertainty and models similarity on climate change projections. npj Climate and Atmospheric Science, 6: 144, doi: 10.1038/s41612-023-00473-5.
|
|
|
| [24] |
Scheff J, Frierson D M W. 2015. Terrestrial aridity and its response to greenhouse warming across CMIP 5 climate models. Journal of Climate, 28(14): 5583-5600.
doi: 10.1175/JCLI-D-14-00480.1
|
|
|
| [25] |
Seneviratne S I, Nicholls N, Easterling D, et al. 2012. Changes in climate extremes and their impacts on the natural physical environment. In: Field CB, BarrosV, Stocker TF, et al. Managing the Risks of Extreme Events and Disasters to Advance Climate Change Adaptation. Cambridge: Cambridge University Press, 109-230.
|
|
|
| [26] |
Serinaldi F. 2013. An uncertain journey around the tails of multivariate hydrological distributions. Water Resources Research, 49(10): 6527-6547.
doi: 10.1002/wrcr.20531
|
|
|
| [27] |
Soares P M M, Johannsen F, Lima D C A, et al. 2024. High-resolution downscaling of CMIP6 Earth system and global climate models using deep learning for Iberia. Geoscientific Model Development, 17(1): 229-259.
doi: 10.5194/gmd-17-229-2024
|
|
|
| [28] |
Stagge J H, Tallaksen L M, Gudmundsson L, et al. 2015. Candidate distributions for climatological drought indices (SPI and SPEI). International Journal of Climatology, 35(13): 4027-4040.
doi: 10.1002/joc.2015.35.issue-13
|
|
|
| [29] |
Tebaldi C, Debeire K, Eyring V, et al. 2021. Climate model projections from the Scenario Model Intercomparison Project (ScenarioMIP) of CMIP6. Earth System Dynamics, 12(1): 253-293.
doi: 10.5194/esd-12-253-2021
|
|
|
| [30] |
Teutschbein C, Seibert J. 2012. Bias correction of regional climate model simulations for hydrological climate-change impact studies: review and evaluation of different methods. Journal of Hydrology, 456-457: 12-29.
doi: 10.1016/j.jhydrol.2012.05.052
|
|
|
| [31] |
Tian P Z, Jian B Y, Li J R, et al. 2023. Land-use-change-induced cooling and precipitation reduction in China: insights from CMIP 6 models. Sustainability, 15(16): 12191, doi: 10.3390/su151612191.
|
|
|
| [32] |
Vicente-Serrano S M, Gouveia C, Camarero J J, et al. 2013. Response of vegetation to drought time-scales across global land biomes. Proceedings of the National Academy of Sciences of the United States of America, 110(1): 52-57.
|
|
|
| [33] |
Wang H J, Chen Y N, Li W H, et al. 2013. Runoff responses to climate change in arid region of northwestern China during 1960-2010. Chinese Geographical Science, 23(3): 286-300.
doi: 10.1007/s11769-013-0605-x
|
|
|
| [34] |
Wang Q F, Zhang R R, Qi J Y, et al. 2022. An improved daily standardized precipitation index dataset for mainland China from 1961 to 2018. Scientific Data, 9: 124, doi: 10.1038/s41597-022-01201-z.
pmid: 35354842
|
|
|
| [35] |
Wang T T. 2022. Study on potential evapotranspiration and drought characteristics in Tarim River Basin. MSc Thesis. Shanghai: Shanghai Normal University. (in Chinese)
|
|
|
| [36] |
Wu H J, Su X L, Singh V P, et al. 2021. Agricultural drought prediction based on conditional distributions of vine copulas. Water Resources Research, 57(8): e2021WR029562, doi: 10.1029/2021WR029562.
|
|
|
| [37] |
Xiang Y Y, Wang Y, Chen Y N, et al. 2024. Prediction of future hydrological drought risk in the Yarkant River Basin based on CMIP 6 models. Arid Land Geography, 47(5): 798-809. (in Chinese)
|
|
|
| [38] |
Xiao C W, Zaehle S, Sitch S, et al. 2025. Deforestation increases vegetation vulnerability to drought across biomes. Global Biogeochemical Cycles, 39(5): e2024GB008378, doi: 10.1029/2024GB008378.
|
|
|
| [39] |
Xu J W, Zhang X T, Feng C J, et al. 2021. Evaluation of surface upward longwave radiation in the CMIP6 models with ground and satellite observations. Remote Sensing, 13(21): 4464, doi: 10.3390/rs13214464.
|
|
|
| [40] |
Yang P, Xia J, Zhang Y Y, et al. 2019. How is the risk of hydrological drought in the Tarim River Basin, Northwest China? Science of The Total Environment, 693: 133555, doi: 10.1016/j.scitotenv.2019.07.361.
|
|
|
| [41] |
Zhai J Q, Mondal S K, Fischer T, et al. 2020. Future drought characteristics through a multi-model ensemble from CMIP 6 over South Asia. Atmospheric Research, 246: 105111, doi: 10.1016/j.atmosres.2020.105111.
|
|
|
| [42] |
Zhang B Q, Zhao X N, Jin J M, et al. 2015. Development and evaluation of a physically based multiscalar drought index: the standardized moisture anomaly index. Journal of Geophysical Research: Atmospheres, 120(22): 11575-11588.
|
|
|
| [43] |
Zhang G W, Zeng G, Yang X Y, et al. 2021a. Future changes in extreme high temperature over China at 1.5°C-5°C global warming based on CMIP 6 simulations. Advances in Atmospheric Sciences, 38(2): 253-267.
doi: 10.1007/s00376-020-0182-8
|
|
|
| [44] |
Zhang G X, Su X L, Singh V P, et al. 2021b. Appraising standardized moisture anomaly index (SZI) in drought projection across China under CMIP 6 forcing scenarios. Journal of Hydrology: Regional Studies, 37: 100898, doi: 10.1016/j.ejrh.2021.100898.
|
|
|
| [45] |
Zhang X L, Wang X X, Zhou B T. 2023. CMIP6-projected changes in drought over Xinjiang, Northwest China. International Journal of Climatology, 43(14): 6560-6577.
doi: 10.1002/joc.v43.14
|
|
|
| [46] |
Zhao Z Y, Hao X M, Fan X, et al. 2023. Actual evapotranspiration dominates drought in Central Asia. Remote Sensing, 15(18): 4557, doi: 10.3390/rs15184557.
|
|
|
| [47] |
Zhong S B, Sun Z H, Di L P. 2021. Characteristics of vegetation response to drought in the CONUS based on long-term remote sensing and meteorological data. Ecological Indicators, 127: 107767, doi: 10.1016/j.ecolind.2021.107767.
|
|
|
| [48] |
Zhou T J, Zou L W, Chen X L. 2019. Commentary on the coupled model intercomparison project phase 6 (CMIP6). Climate Change Research, 15(5): 445-456. (in Chinese)
|
|
|
|
Viewed |
|
|
|
Full text
|
|
|
|
|
Abstract
|
|
|
|
|
Cited |
|
|
|
|
| |
Shared |
|
|
|
|
| |
Discussed |
|
|
|
|