| Research article |
|


|
|
|
| Multi-source remote sensing and machine learning reveal spatiotemporal variations and drivers of NPP in the Tianshan Mountains, China |
LI Jiani1,2,3,4, XU Denghui1,2,3,4, XU Zhonglin1,2,3,4, WANG Yao1,5,*( ), YANG Jianjun1,2,3,4 ), YANG Jianjun1,2,3,4 |
1College of Ecology and Environment, Xinjiang University, Urumqi 830017, China
2Key Laboratory of Oasis Ecology, Xinjiang University, Urumqi 830017, China
3Xinjiang Jinghe Observation and Research Station of Temperate Desert Ecosystem, Ministry of Education, Urumqi 830017, China
4Technology Innovation Center for Ecological Monitoring and Restoration of Desert-Oasis, Urumqi 830001, China
5Institute of Desert Meteorology, China Meteorological Administration, Urumqi 830002, China |
|
|
|
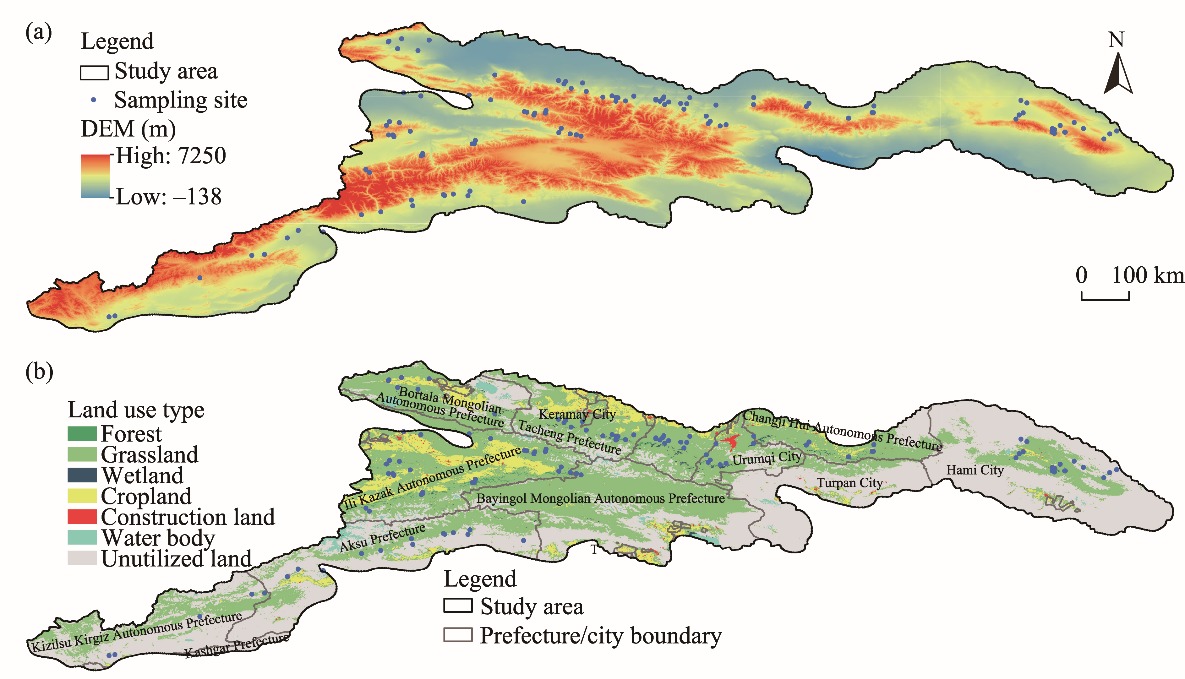
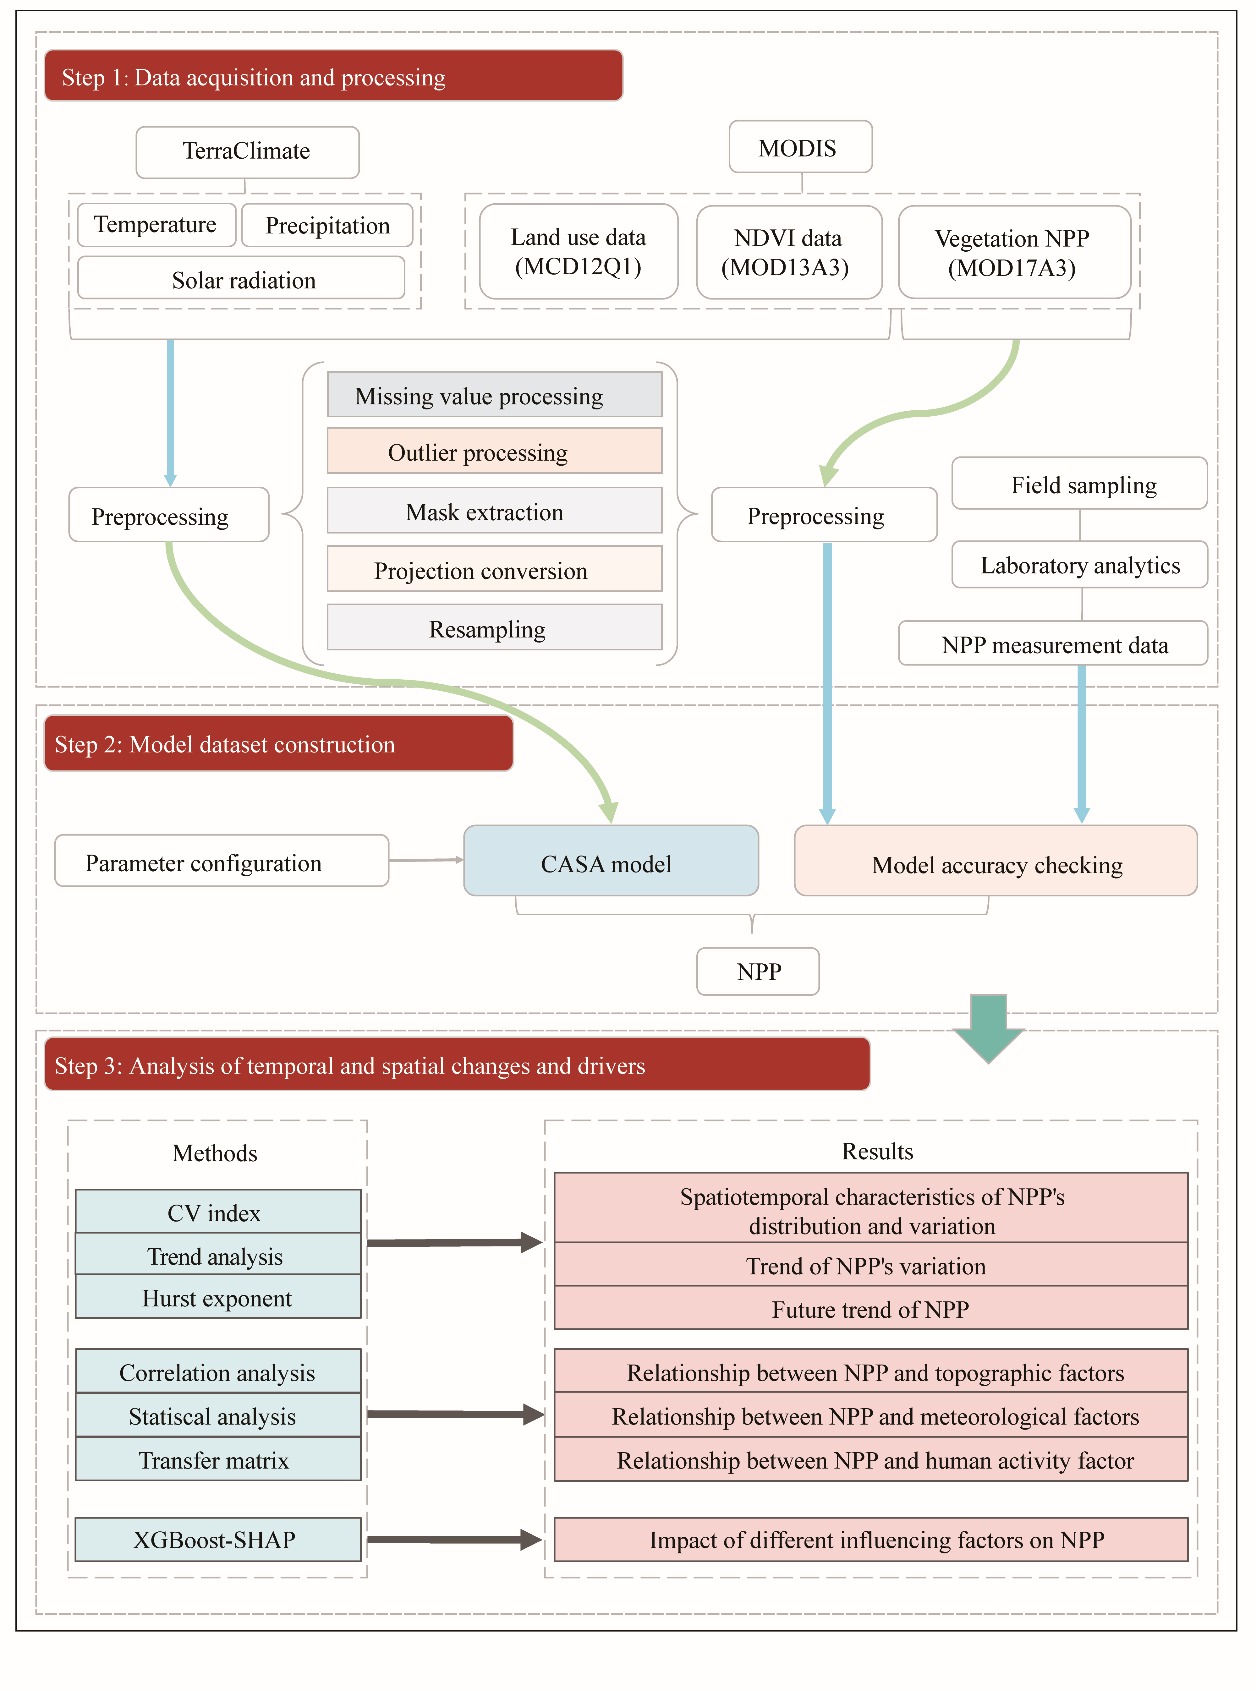
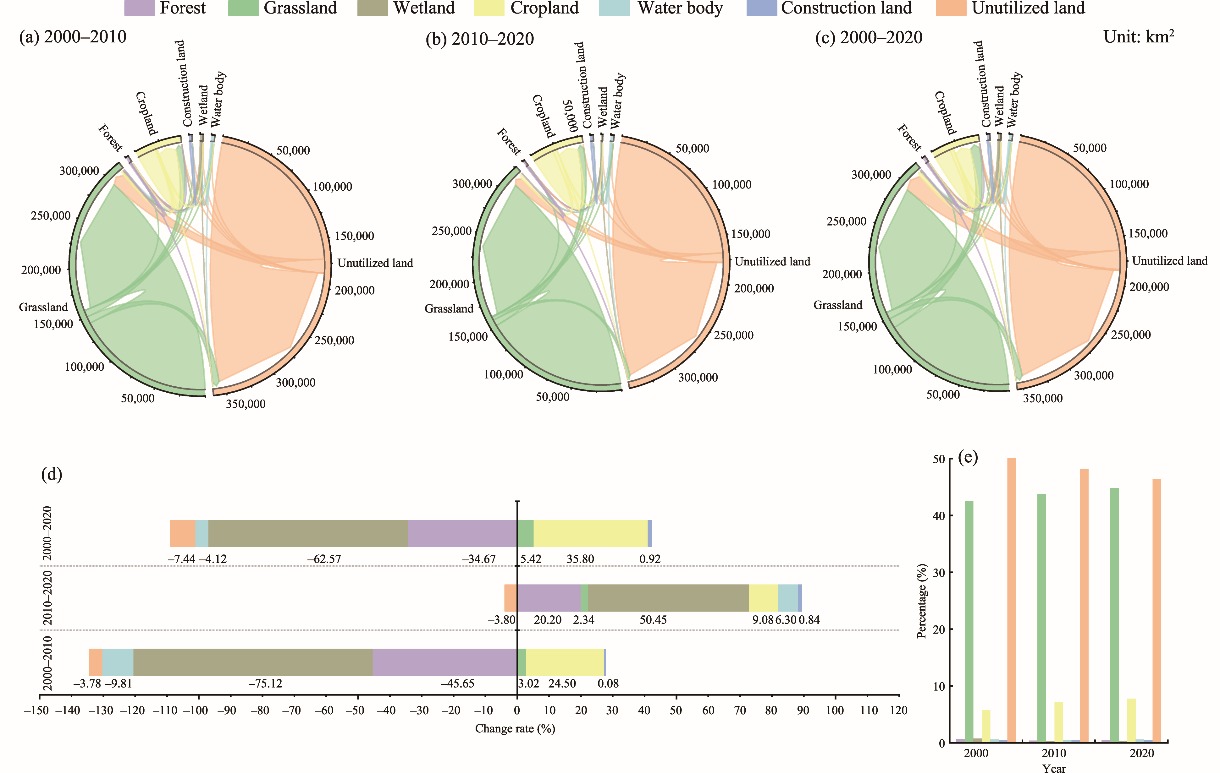
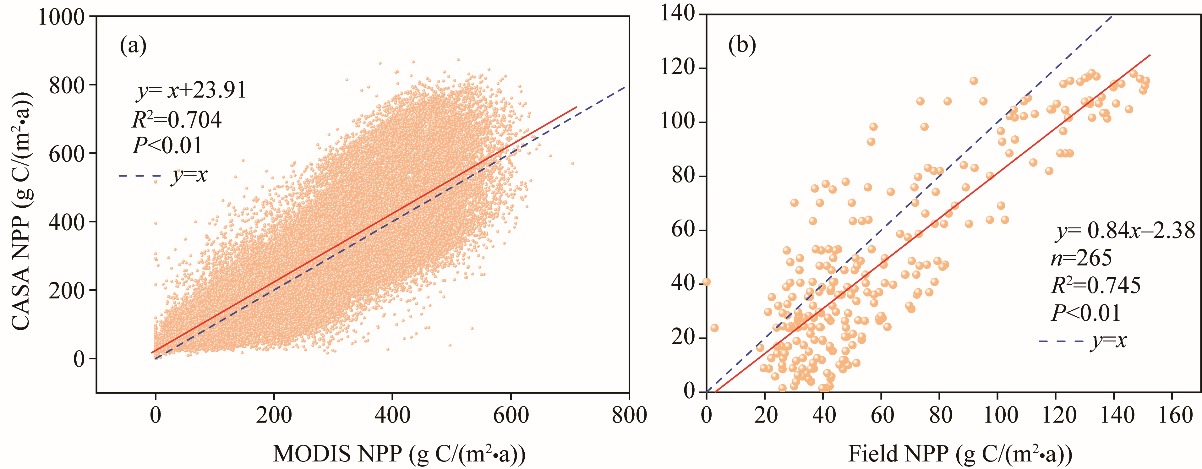
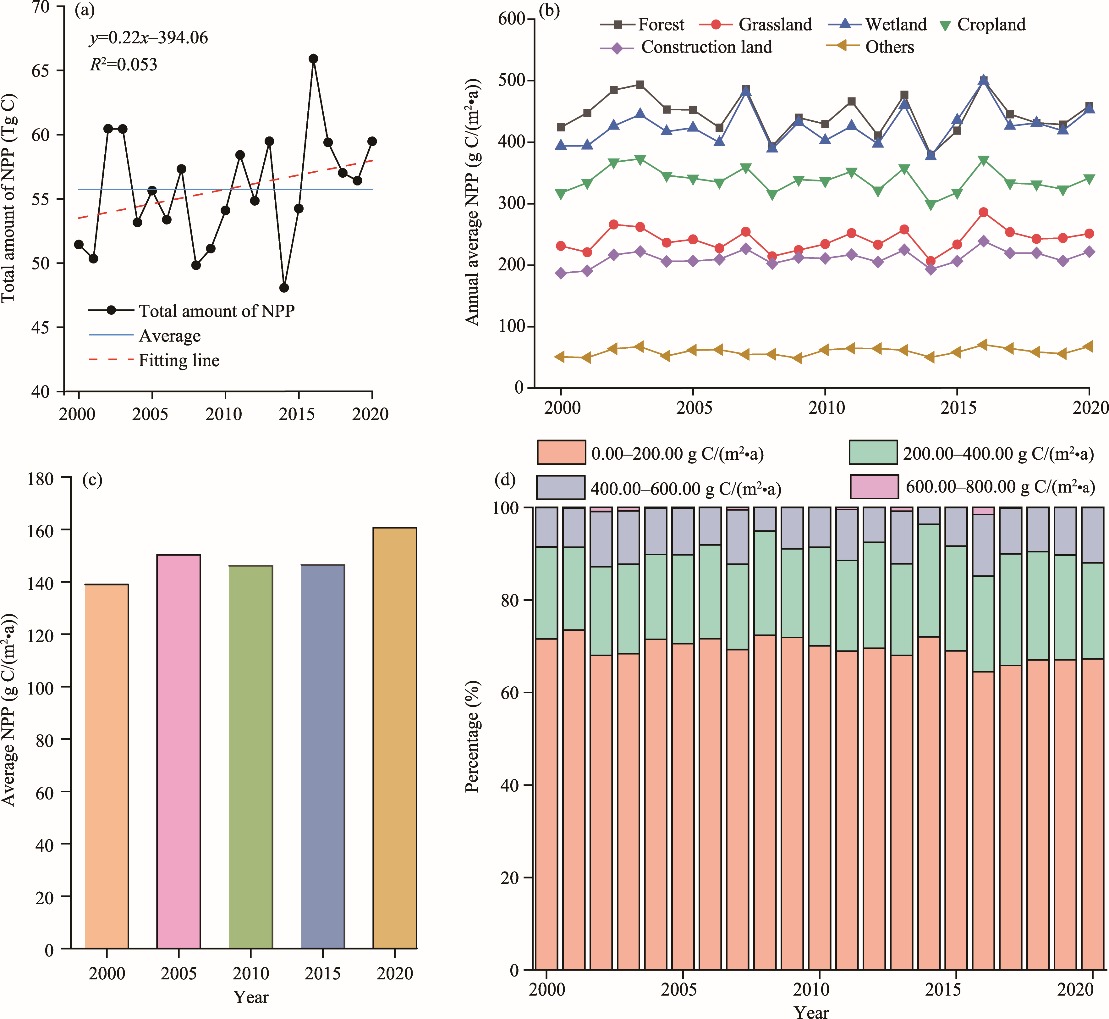
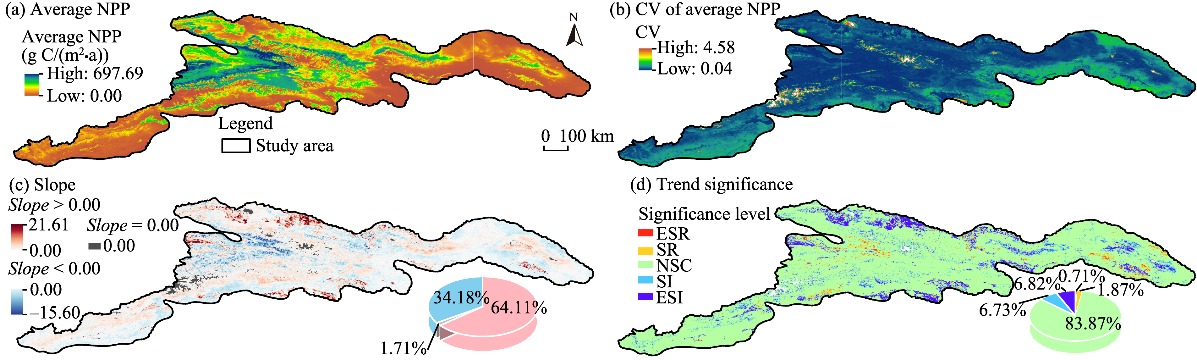
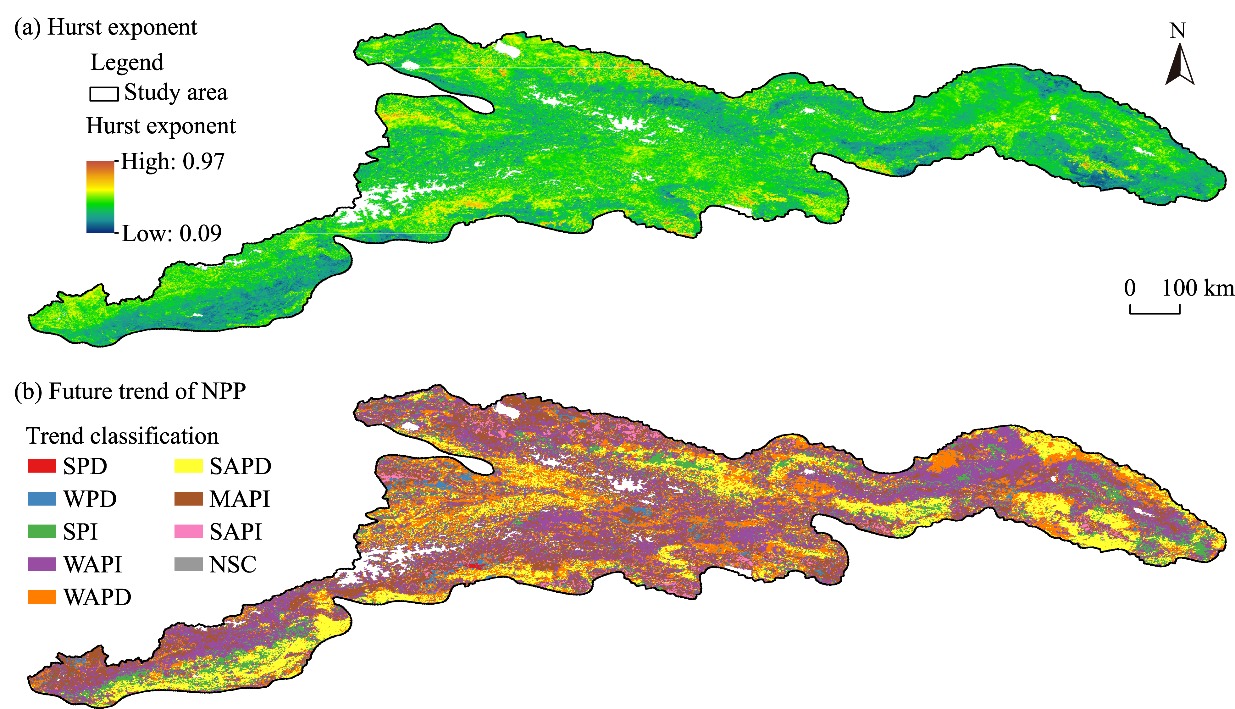
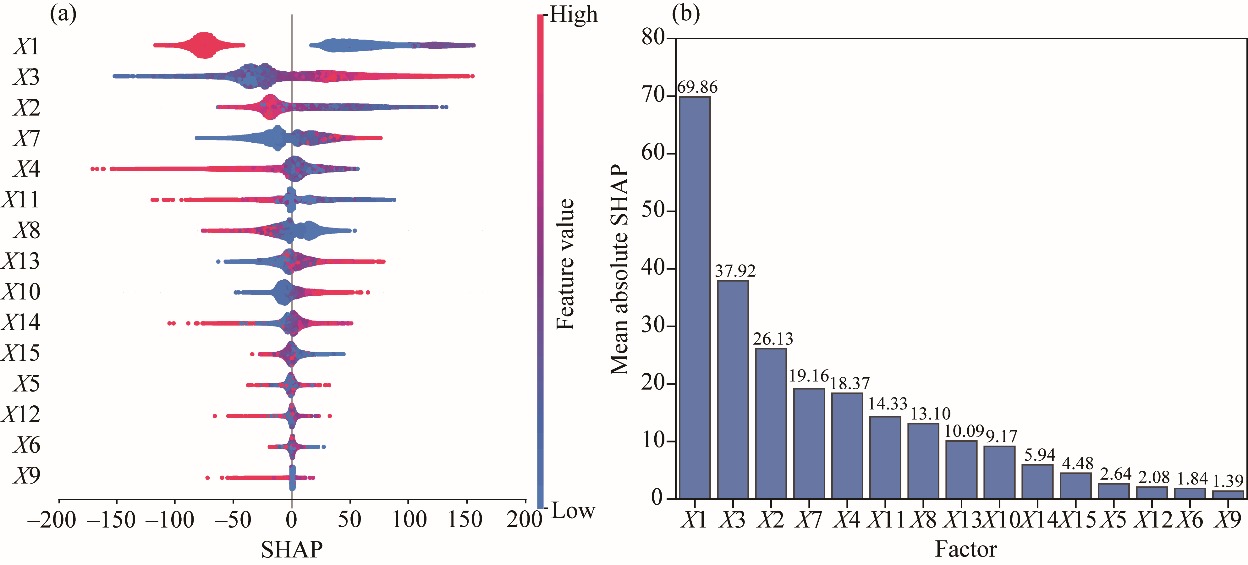
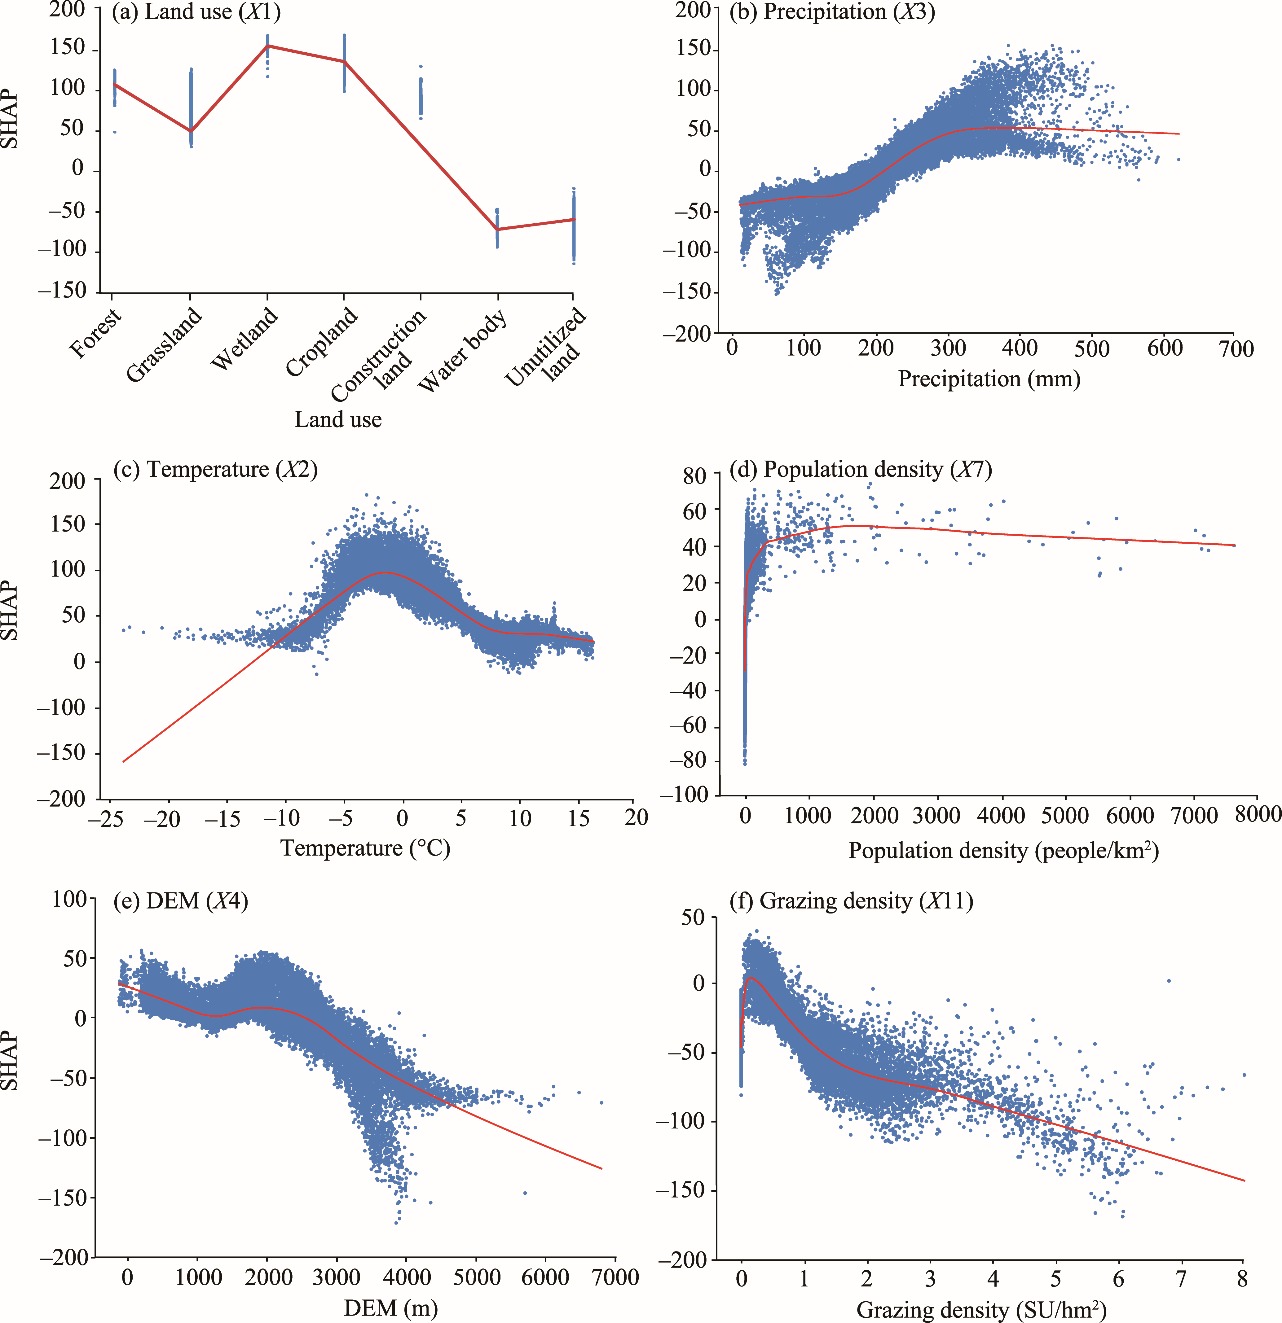
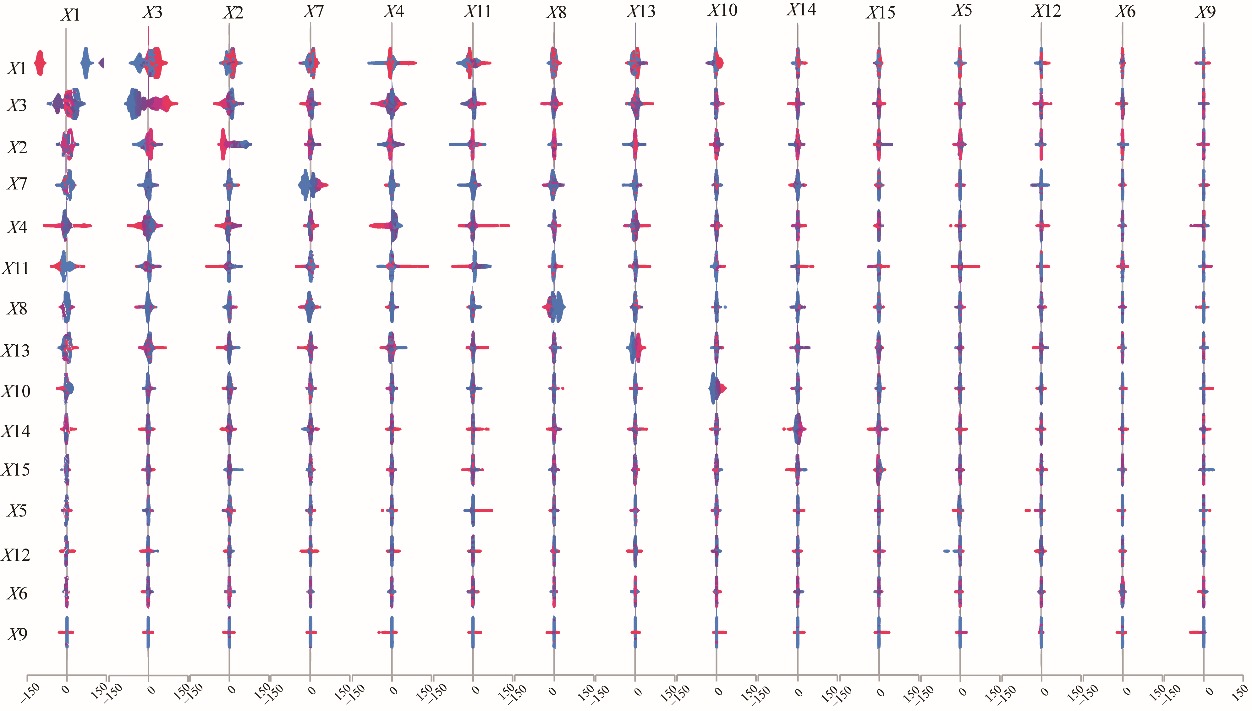
Abstract Arid mountain ecosystems are highly sensitive to hydrothermal stress and land use intensification, yet where net primary productivity (NPP) degradation is likely to persist and what drives it remain unclear in the Tianshan Mountains of Northwest China. We integrated multi-source remote sensing with the Carnegie-Ames-Stanford Approach (CASA) model to estimate NPP during 2000-2020, assessed trend persistence using the Hurst exponent, and identified key drivers and nonlinear thresholds with Extreme Gradient Boosting (XGBoost) and SHapley Additive exPlanations (SHAP). Total NPP averaged 55.74 Tg C/a and ranged from 48.07 to 65.91 Tg C/a from 2000 to 2020, while regional mean NPP rose from 138.97 to 160.69 g C/(m2•a). Land use transfer analysis showed that grassland expanded mainly at the expense of unutilized land and that cropland increased overall. Although NPP increased across 64.11% of the region during 2000-2020, persistence analysis suggested that 53.93% of the Tianshan Mountains was prone to continued NPP decline, including 36.41% with significant projected decline and 17.52% with weak projected decline; these areas formed degradation hotspots concentrated in the central and northern Tianshan Mountains. In contrast, potential improvement was limited (strong persistent improvement: 4.97%; strong anti-persistent improvement: 0.36%). Driver attribution indicated that land use dominated NPP variability (mean absolute SHAP value=29.54%), followed by precipitation (16.03%) and temperature (11.05%). SHAP dependence analyses showed that precipitation effects stabilized at 300.00-400.00 mm, and temperature exhibited an inverted U-shaped response with a peak near 0.00°C. These findings indicated that persistent degradation risk arose from hydrothermal constraints interacting with land use conversion, highlighting the need for threshold-informed, spatially targeted management to sustain carbon sequestration in arid mountain ecosystems.
|
|
Received: 25 September 2025
Published: 31 January 2026
|
|
Corresponding Authors:
*WANG Yao (E-mail: wangyao@idm.cn)
|
|
|
| [1] |
Abdi A M, Vrieling A, Yengoh G T, et al. 2016. The El Niño - La Niña cycle and recent trends in supply and demand of net primary productivity in African drylands. Climatic Change, 138(1): 111-125.
doi: 10.1007/s10584-016-1730-1
|
|
|
| [2] |
Ahlström A, Raupach M R, Schurgers G, et al. 2015. The dominant role of semi-arid ecosystems in the trend and variability of the land CO₂ sink. Science, 348(6237): 895-899.
doi: 10.1126/science.aaa1668
pmid: 25999504
|
|
|
| [3] |
Austin P C, Steyerberg E W. 2013. Graphical assessment of internal and external calibration of logistic regression models by using loess smoothers. Statistics in Medicine, 33(3): 517-535.
|
|
|
| [4] |
Bao G, Bao Y H, Qin Z H, et al. 2016. Modeling net primary productivity of terrestrial ecosystems in the semi-arid climate of the Mongolian Plateau using LSWI-based CASA ecosystem model. International Journal of Applied Earth Observation and Geoinformation, 46: 84-93.
doi: 10.1016/j.jag.2015.12.001
|
|
|
| [5] |
Blain G C. 2013. The modified Mann-Kendall test: on the performance of three variance correction approaches. Bragantia, 72(4): 416-425.
doi: 10.1590/brag.2013.045
|
|
|
| [6] |
Bui Q, Ślepaczuk R. 2022. Applying Hurst exponent in pair trading strategies on Nasdaq 100 index. Physica A: Statistical Mechanics and its Applications, 592: 126784, doi: 10.1016/j.physa.2021.126784.
|
|
|
| [7] |
Chen S, Zhao W W, Han Y. 2023. Spatio-temporal variation of vegetation precipitation use efficiency in arid and semi-arid regions of China. Acta Ecologica Sinica, 43(24): 10295-10307. (in Chinese)
|
|
|
| [8] |
Chen T Q, Guestrin C. 2016. XGBoost: a scalable tree boosting system. In: KDD '16: Proceedings of the 22nd ACM SIGKDD International Conference on Knowledge Discovery and Data Mining. Association for Computing Machinery's Special Interest Group on Knowledge Discovery and Data Mining (ACM SIGKDD). San Francisco, USA, 785-794.
|
|
|
| [9] |
Chen W D, Liu X H, Li H Y, et al. 2024a. Ecosystem service function and security pattern of Tianshan Mountains in Xinjiang from 1990 to 2050. Geology in China, 51(5): 1644-1663. (in Chinese)
|
|
|
| [10] |
Chen Y N, Li W H, Deng H J, et al. 2016. Correction: Corrigendum: Changes in Central Asia's water tower: past, present and future. Scientific Reports, 6: 39364, doi: 10.1038/srep39364.
pmid: 28004738
|
|
|
| [11] |
Chen Y N, Fang G H, Li Z, et al. 2024b. The crisis in oases: research on ecological security and sustainable development in arid regions. Annual Review of Environment and Resources, 49: 1-20.
doi: 10.1146/annurev-environ-111522-105932
|
|
|
| [12] |
Cong S X, Ding X D, Chang W J, et al. 2025. Response of net primary productivity to drought change in middle arid zone of Ningxia Hui Autonomous Region. Bulletin of Soil and Water Conservation, 45(4): 402-412. (in Chinese)
|
|
|
| [13] |
Dong D J, Zhang R H, Guo W, et al. 2025. Assessing spatiotemporal dynamics of net primary productivity in Shandong Province, China (2001-2020) using the CASA model and Google Earth Engine: trends, patterns, and driving factors. Remote Sensing, 17(3): 488, doi: 10.3390/rs17030488.
|
|
|
| [14] |
Du Y J, Li X L, He X L, et al. 2025. Spatiotemporal variation characteristics and driving mechanisms of net primary productivity of vegetation on northern slope of Tianshan Mountains based on CASA model, China. Plants (Basel), 14(16): 2499, doi: 10.3390/plants14162499.
|
|
|
| [15] |
Eastman J R, Sangermano F, Machado E A, et al. 2013. Global trends in seasonality of normalized difference vegetation index (NDVI), 1982-2011. Remote Sensing, 5(10): 4799-4818.
doi: 10.3390/rs5104799
|
|
|
| [16] |
Ellis E C. 2011. Anthropogenic transformation of the terrestrial biosphere. Philosophical Transactions of the Royal Society A: Mathematical, Physical, and Engineering Sciences, 369: 1010-1035.
|
|
|
| [17] |
Friedlingstein P, O'Sullivan M, Jones M W, et al. 2023. Global carbon budget 2023. Earth System Science Data, 15(12): 5301-5369.
doi: 10.5194/essd-15-5301-2023
|
|
|
| [18] |
Gocic M, Trajkovic S. 2013. Analysis of changes in meteorological variables using Mann-Kendall and Sen's slope estimator statistical tests in Serbia. Global and Planetary Change, 100: 172-182.
doi: 10.1016/j.gloplacha.2012.10.014
|
|
|
| [19] |
Grekousis G. 2025. Geographical-XGBoost: a new ensemble model for spatially local regression based on gradient-boosted trees. Journal of Geographical Systems, 27(2): 169-195.
doi: 10.1007/s10109-025-00465-4
|
|
|
| [20] |
Guan X B, Chen J M, Shen H F, et al. 2022. Comparison of big-leaf and two-leaf light use efficiency models for GPP simulation after considering a radiation scalar. Agricultural and Forest Meteorology, 313: 108761, doi: 10.1016/j.agrformet.2021.108761.
|
|
|
| [21] |
Guo Z P, Zhang X D. 2021. Differentiated Land Policy and the Coordination Logic to Spatial Elements—Taking "One Decrease Three Increase" of Un-Utilized Land in Lanzhou for Example. Construction & Design for Engineering, 12: 177-179, 183. (in Chinese)
|
|
|
| [22] |
Hamed K H. 2007. Improved finite-sample Hurst exponent estimates using rescaled range analysis. Water Resources Research, 43(4): W04413, doi: 10.1029/2006WR005111.
|
|
|
| [23] |
Hamed K H. 2008. Trend detection in hydrologic data: The Mann-Kendall trend test under the scaling hypothesis. Journal of Hydrology, 349(3-4): 350-363.
doi: 10.1016/j.jhydrol.2007.11.009
|
|
|
| [24] |
Heng R, Wang X J. 2023. NPP prediction of vegetation in Gurbantunggut Desert based on CASA model. Water Resources and Hydropower Engineering, 54(12): 189-201. (in Chinese)
|
|
|
| [25] |
Hou W J, Gao J B, Wu S H, et al. 2015. Interannual variations in growing-season NDVI and its correlation with climate variables in the southwestern karst region of China. Remote Sensing, 7(9): 11105-11124.
doi: 10.3390/rs70911105
|
|
|
| [26] |
Hou Y F. 2020. Impacts of land use/cover change on vegetation net primary productivity in the Weigan-Kuqa River Basin, Xinjiang. MSc Thesis. Urumqi: Xinjiang Agricultural University. (in Chinese)
|
|
|
| [27] |
Hu J H, Song M F, Zhang L W. 2025. Spatial and temporal evolution of land use carbon emission and carbon balance zoning: evidence from Xinjiang China. Scientific Reports, 15: 35705, doi: 10.1038/s41598-025-19475-9.
|
|
|
| [28] |
Huang J, Huang H S, Zhong H Y, et al. 2021. Provincial-scale applicability analysis of land cover data at different resolutions—case study of Jiangxi Province. Jiangxi Science, 39(3): 534-540, 551. (in Chinese)
|
|
|
| [29] |
Huang J P, Yu H P, Guan X D, et al. 2016. Accelerated dryland expansion under climate change. Nature Climate Change, 6: 166-171.
doi: 10.1038/NCLIMATE2837
|
|
|
| [30] |
Huxman T E, Smith M D, Fay P A, et al. 2004. Convergence across biomes to a common rain-use efficiency. Nature, 429: 651-654.
doi: 10.1038/nature02561
|
|
|
| [31] |
IPCC Intergovernmental Panel on Climate Change. 2021. Climate Change 2021: The Physical Science Basis. Contribution of Working Group I to the Sixth Assessment Report of the Intergovernmental Panel on Climate Change. Cambridge and New York: Cambridge University Press, 2391.
|
|
|
| [32] |
Jiang F G, Deng M L, Long Y, et al. 2022. Spatial pattern and dynamic change of vegetation greenness from 2001 to 2020 in Tibet, China. Frontiers in Plant Science, 13: 892625, doi: 10.3389/fpls.2022.892625.
|
|
|
| [33] |
Kalisa W, Igbawua T, Henchiri M, et al. 2019. Assessment of climate impact on vegetation dynamics over East Africa from 1982 to 2015. Scientific Reports, 9: 16865, doi: 10.1038/s41598-019-53150-0.
pmid: 31727960
|
|
|
| [34] |
Li Q, Yang T, Zhou H F, et al. 2019. Patterns in snow depth maximum and snow cover days during 1961-2015 period in the Tianshan Mountains, Central Asia. Atmospheric Research, 228: 14-22.
doi: 10.1016/j.atmosres.2019.05.004
|
|
|
| [35] |
Li Y, Shang R, Qu Y B, et al. 2023. Assessment of the dynamics of vegetation net primary productivity and its response to environmental chan-ges before and after the Grain for Green Project: A case study from the Loess Plateau of Northern Shaanxi. Water Resources and Hydropower Engineering, 54(06): 156-166, doi: 10.13928/j.cnki.wrahe.2023.06.014. (in Chinese)
|
|
|
| [36] |
Liang L, Li M, Huang Z R, et al. 2025. Insights into spatiotemporal dynamics and driving mechanisms of vegetation net primary productivity in African terrestrial ecosystems. International Journal of Applied Earth Observation and Geoinformation, 143: 104824, doi: 10.1016/j.jag.2025.104824.
|
|
|
| [37] |
Liu L, Guan J Y, Mu C, et al. 2022. Spatio-temporal characteristics of vegetation net primary productivity in the Ili River Basin from 2008 to 2018. Acta Ecologica Sinica, 42(12): 4861-4871. (in Chinese)
|
|
|
| [38] |
Liu Y D, Yao X J, Li Z S, et al. 2024. Impacts of climate change and land use/cover change on the net primary productivity of vegetation in Hexi Region, Northwest China. Arid Zone Research, 41(1): 169-180. (in Chinese)
doi: 10.13866/j.azr.2024.01.16
|
|
|
| [39] |
Liu Z J, Liu Y S, Wang J Y. 2021. A global analysis of agricultural productivity and water resource consumption changes over cropland expansion regions. Agriculture, Ecosystems & Environment, 321: 107630, doi: 10.1016/j.agee.2021.107630.
|
|
|
| [40] |
Lu Y Y, Xu X L, Li J C, et al. 2022. Research on the spatio-temporal variation of carbon storage in the Xinjiang Tianshan Mountains based on the InVEST model. Arid Zone Research, 39(6): 1896-1906. (in Chinese)
doi: 10.13866/j.azr.2022.06.20
|
|
|
| [41] |
Lundberg S M, Lee S I. 2017. A unified approach to interpreting model predictions. In: von Luxburg U, Guyon I. NIPS'17: Proceedings of the 31st International Conference on Neural Information Processing Systems (NIPS). NIPS. Long Beach, USA. 4768-4777.
|
|
|
| [42] |
Luo Y, Wang C L. 2009. Valuation of the net primary production of terrestrial ecosystems in Guangdong Province based on remote sensing. Ecology and Environmental Sciences, 18(4): 1467-1471. (in Chinese)
|
|
|
| [43] |
Ma R L, Xue Y Y, Chen J L, et al. 2025a. Tradeoffs and synergies in carbon-water coupling of vegetation across China's arid and semiarid regions. Arid Zone Research, http://link.cnki.net/urlid/65.1095.X.20251126.1421.008. (in Chinese)
|
|
|
| [44] |
Ma Z L, Han M, Kong X L, et al. 2025b. Interpretability-driven analysis of carbon storage in the Yellow River Delta based on SHAP-XGBoost model. Environmental Science, doi: 10.13227/j.hjkx.202505105. (in Chinese)
|
|
|
| [45] |
Mielniczuk J, Wojdyłło P. 2007. Estimation of Hurst exponent revisited. Computational Statistics & Data Analysis, 51(9): 4510-4525.
|
|
|
| [46] |
Niu J Q, Wang Z Y, Lin H, et al. 2024. Temporal and spatial evolution characteristics and driving factors of NPP in the Huaihe River Economic Belt. Geography and Geo-Information Science, 40(3): 37-43. (in Chinese)
|
|
|
| [47] |
Pang W L, Ji P H, Pang L D, et al. 2024. Spatial and temporal evolution of land use pattern and ecosystem service function in Daxinganling Mountains of Inner Mongolia. Bulletin of Soil and Water Conservation, 44(4): 340-351, 361. (in Chinese)
|
|
|
| [48] |
Ren Y X, Mao D H, Wang T, et al. 2025. Persistent vegetation greening trends across China's wetlands. Communications Earth & Environment, 6: 624, doi: 10.1038/s43247-025-02628-z.
|
|
|
| [49] |
Robinson N P, Allred B W, Smith W K, et al. 2018. Terrestrial primary production for the conterminous United States derived from Landsat 30 m and MODIS 250 m. Remote Sensing in Ecology and Conservation, 4(3): 264-280.
doi: 10.1002/rse2.2018.4.issue-3
|
|
|
| [50] |
Suo C X, Fei X, Liu Y Z, et al. 2023. Functional group characteristics of plant community at different grazing intensities in alpine grassland of northwestern Sichuan. Chinese Journal of Applied and Environmental Biology, 29(1): 109-116. (in Chinese)
|
|
|
| [51] |
Sonali P, Nagesh Kumar D. 2013. Review of trend detection methods and their application to detect temperature changes in India. Journal of Hydrology, 476: 212-227.
doi: 10.1016/j.jhydrol.2012.10.034
|
|
|
| [52] |
Tian F, Fensholt R, Verbesselt J, et al. 2015. Evaluating temporal consistency of long-term global NDVI datasets for trend analysis. Remote Sensing of Environment, 163: 326-340.
doi: 10.1016/j.rse.2015.03.031
|
|
|
| [53] |
Turner D P, Ritts W D, Cohen W B, et al. 2006. Evaluation of MODIS NPP and GPP products across multiple biomes. Remote Sensing of Environment, 102(3-4): 282-292.
doi: 10.1016/j.rse.2006.02.017
|
|
|
| [54] |
Wang B, Liu M C, Zhang B. 2009. Dynamics of net production of Chinese forest vegetation based on forest inventory data. Forest and Grassland Resources Research, 1: 35-43. (in Chinese)
|
|
|
| [55] |
Wang S J, Zhang M J, Hughes C E, et al. 2016. Factors controlling stable isotope composition of precipitation in arid conditions: an observation network in the Tianshan Mountains, Central Asia. Tellus Series B: Chemical and Physical Meteorology, 68(1): 26206, doi: 10.3402/tellusb.v68.26206.
|
|
|
| [56] |
Wang T, Bao A M, Xu W Q, et al. 2023. Dynamics of forest net primary productivity based on tree ring reconstruction in the Tianshan Mountains. Ecological Indicators, 146: 109713, doi: 10.1016/j.ecolind.2022.109713.
|
|
|
| [57] |
Wang Y H, Zhou G S, Jiang Y L, et al. 2001. Estimating biomass and NPP of Larix forests using forest inventory data (FID). Acta Phytoecologica Sinica, 25(4): 420-425. (in Chinese)
|
|
|
| [58] |
Wei Q, Zhou B R, Wang W Y. 2025. Qinghai Province (Tibetan Plateau): quantifying the influence of climate change and human activities on vegetation net primary productivity and livestock carrying capacity growth potential. Biology, 14(5): 494, doi: 10.3390/biology14050494.
|
|
|
| [59] |
Wei X D, Yang J, Luo P P, et al. 2022. Assessment of the variation and influencing factors of vegetation NPP and carbon sink capacity under different natural conditions. Ecological Indicators, 138: 108834, doi: 10.1016/j.ecolind.2022.108834.
|
|
|
| [60] |
Wen J G, Wu X D, Wang J P, et al. 2022. Characterizing the effect of spatial heterogeneity and the deployment of sampled plots on the uncertainty of ground "truth" on a coarse grid scale: case study for near-infrared (NIR) surface reflectance. Journal of Geophysical Research: Atmospheres, 127(11): e2022JD036779, doi: 10.1029/2022JD036779.
|
|
|
| [61] |
Wu C Y, Chen K L, E C Y, et al. 2022. Improved CASA model based on satellite remote sensing data: simulating net primary productivity of Qinghai Lake basin alpine grassland. Geoscientific Model Development, 15(17): 6919-6933.
doi: 10.5194/gmd-15-6919-2022
|
|
|
| [62] |
Wu Q L, Zhang X Y, Jiang J. 2023. Land-use and land-cover change (LUCC) detection based on MODIS and CLCD data and its impact on the simulation of vegetation gross carbon assimilation in the Loess Plateau. Geography and Geo-Information Science, 39(5): 30-38. (in Chinese)
|
|
|
| [63] |
Wu X, Zhang X Y, Long A C, et al. 2024a. Revealing the drivers of land surface temperature variation in Guiyang City using XGBoost and SHAP. Environmental Science & Technology, 47(8): 155-166. (in Chinese)
|
|
|
| [64] |
Wu X Y, Xu H, Zha T G, et al. 2024b. Soil water availability induces divergent ecosystem water-use strategies to dry-heat conditions in two poplar plantations in North China. Agricultural and Forest Meteorology, 353: 110074, doi: 10.1016/j.agrformat.2024.110074.
|
|
|
| [65] |
Xiang H X, Xi Y B, Mao D H, et al. 2023. Modeling potential wetland distributions in China based on geographic big data and machine learning algorithms. International Journal of Digital Earth, 16(1): 3706-3724.
doi: 10.1080/17538947.2023.2256723
|
|
|
| [66] |
Yin G, Hu Z Y, Chen X, et al. 2016. Vegetation dynamics and its response to climate change in Central Asia. Journal of Arid Land, 8(3): 375-388.
doi: 10.1007/s40333-016-0043-6
|
|
|
| [67] |
Zeng J W, Dai X A, Xu J P, et al. 2024. Remote sensing monitoring of vegetation NPP spatiotemporal dynamics based on the PIE-Engine cloud computing platform and CASA model: A case study of Daofu County. Water Resources and Hydropower Engineering, 55(5): 115-128. (in Chinese)
|
|
|
| [68] |
Zeng Z, She J Y, Chen C H. 2025. Analysis of the impact of land-use change on net primary productivity of vegetation in Hunan Province. Journal of Green Science and Technology, 27(1): 180-187. (in Chinese)
|
|
|
| [69] |
Zhang H Z, Xue Y Y, Ma Y Y, et al. 2024. Carbon sequestration potential of oasis ecosystems in Xinjiang, China. Arid Zone Research, 41(6): 998-1009. (in Chinese)
|
|
|
| [70] |
Zhang M, Yuan X, Zeng Z Z, et al. 2025. A pronounced decline in northern vegetation resistance to flash droughts from 2001 to 2022. Nature Communications, 16: 2984, doi: 10.1038/s41467-025-58253-z.
|
|
|
| [71] |
Zhou N F, Gong E J, Bai T H, et al. 2025. Analysis of temporal and spatial dynamics and its influencing factors of NPP in Qinba Mountain Area based on the CASA model. Acta Ecologica Sinica, 45(4): 1829-1843. (in Chinese)
|
|
|
| [72] |
Zhou X Y, Lei W J. 2018. Hydrological interactions between oases and water vapor transportation in the Tarim Basin, northwestern China. Scientific Reports, 8: 13431, doi: 10.1038/s41598-018-31440-3.
pmid: 30194321
|
|
|
| [73] |
Zhu W Q, Pan Y Z, He H, et al. 2006. Simulation of maximum light use efficiency for some typical vegetation types in China. Chinese Science Bulletin, 51(4): 457-463.
doi: 10.1007/s11434-006-0457-1
|
|
|
| [74] |
Zhu W Q, Pan Y Z, Zhang J S. 2007. Estimation of net primary productivity of Chinese terrestrial vegetation based on remote sensing. Chinese Journal of Plant Ecology, 31(3): 413-424. (in Chinese)
doi: 10.17521/cjpe.2007.0050
|
|
|
|
Viewed |
|
|
|
Full text
|
|
|
|
|
Abstract
|
|
|
|
|
Cited |
|
|
|
|
| |
Shared |
|
|
|
|
| |
Discussed |
|
|
|
|