Temporal variability and environmental drivers of net ecosystem CO2 exchange in terrestrial ecosystems of the Yellow River Basin
LIN Feng1, YANG Ping2,3,*(), FANG Yuju4, ZHAO Xuepeng5, ZHAO Qiang1, SONG Qingfan1, JIANG Jiyi1
1School of Water Conservancy and Environment, University of Jinan, Jinan 250022, China 2Culture and Tourism College, University of Jinan, Jinan 250022, China 3Institute of Desert Meteorology, China Meteorological Administration, Urumqi 830002, China 4Jinan Quanjing Middle School, Jinan 250000, China 5School of Economics and Management, Changji University, Changji 831100, China
The Yellow River Basin (YRB), located in the mid-latitude region of China, encompasses diverse ecosystem types and is highly sensitive to climate change. However, the temporal patterns and environmental drivers of net ecosystem CO2 exchange (NEE) across multiple time scales remain poorly understood. Using eddy covariance observations from the ChinaFLUX network collected between 2003 and 2020, this study investigated the temporal dynamics of NEE and its primary environmental controls in five representative ecosystem types within the YRB and its adjacent 100-km buffer zone: cropland, forest, grassland, shrubland, and wetland ecosystems. The results showed that all five ecosystems exhibited a generally U-shaped diurnal pattern from May to September, characterized by net CO2 uptake during the daytime and net CO2 release at night. At the daily scale, cropland displayed a typical bimodal carbon uptake pattern, whereas forest ecosystem exhibited the greatest day-to-day variability in NEE. In contrast, grassland, shrubland, and wetland ecosystems showed relatively smooth daily fluctuations. The net CO2 source-sink functions derived from NEE differed substantially among ecosystem types. Forest ecosystems acted as the most stable and persistent carbon sinks, whereas croplands exhibited short-term but high-intensity carbon uptake. Wetlands showed pronounced interannual variability, including an extreme net CO2 release event at the Haibei wetland site in 2007. Grassland and shrubland ecosystems were more susceptible to environmental stress and could shift from net CO2 sinks to net CO2 sources during drought years. The environmental controls on NEE exhibited clear time-scale dependence. At the half-hourly scale, photosynthetically active radiation (PAR) was the dominant driver of NEE variability, the influence of temperature increased progressively from the daily to monthly scales. These findings improve the understanding of regional carbon dynamics in the YRB, provide insights into the net CO2 source-sink status of different ecosystem types, and elucidate the mechanisms regulating ecosystem CO2 exchange across multiple temporal scales.
Received: 13 February 2026
Published: 31 August 2026
Conceptualization: LIN Feng; Investigation: LIN Feng, FANG Yuju, ZHAO Xuepeng, SONG Qingfan, JIANG Jiyi; Writing - original draft preparation: LIN Feng; Writing - review & editing: LIN Feng, YANG Ping, FANG Yuju, ZHAO Xuepeng, ZHAO Qiang, SONG Qingfan, JIANG Jiyi; Supervision: YANG Ping, ZHAO Qiang. All authors approved the manuscript.
LIN Feng, YANG Ping, FANG Yuju, ZHAO Xuepeng, ZHAO Qiang, SONG Qingfan, JIANG Jiyi. Temporal variability and environmental drivers of net ecosystem CO2 exchange in terrestrial ecosystems of the Yellow River Basin. Journal of Arid Land, 2026, 18(8): 1304-1330.
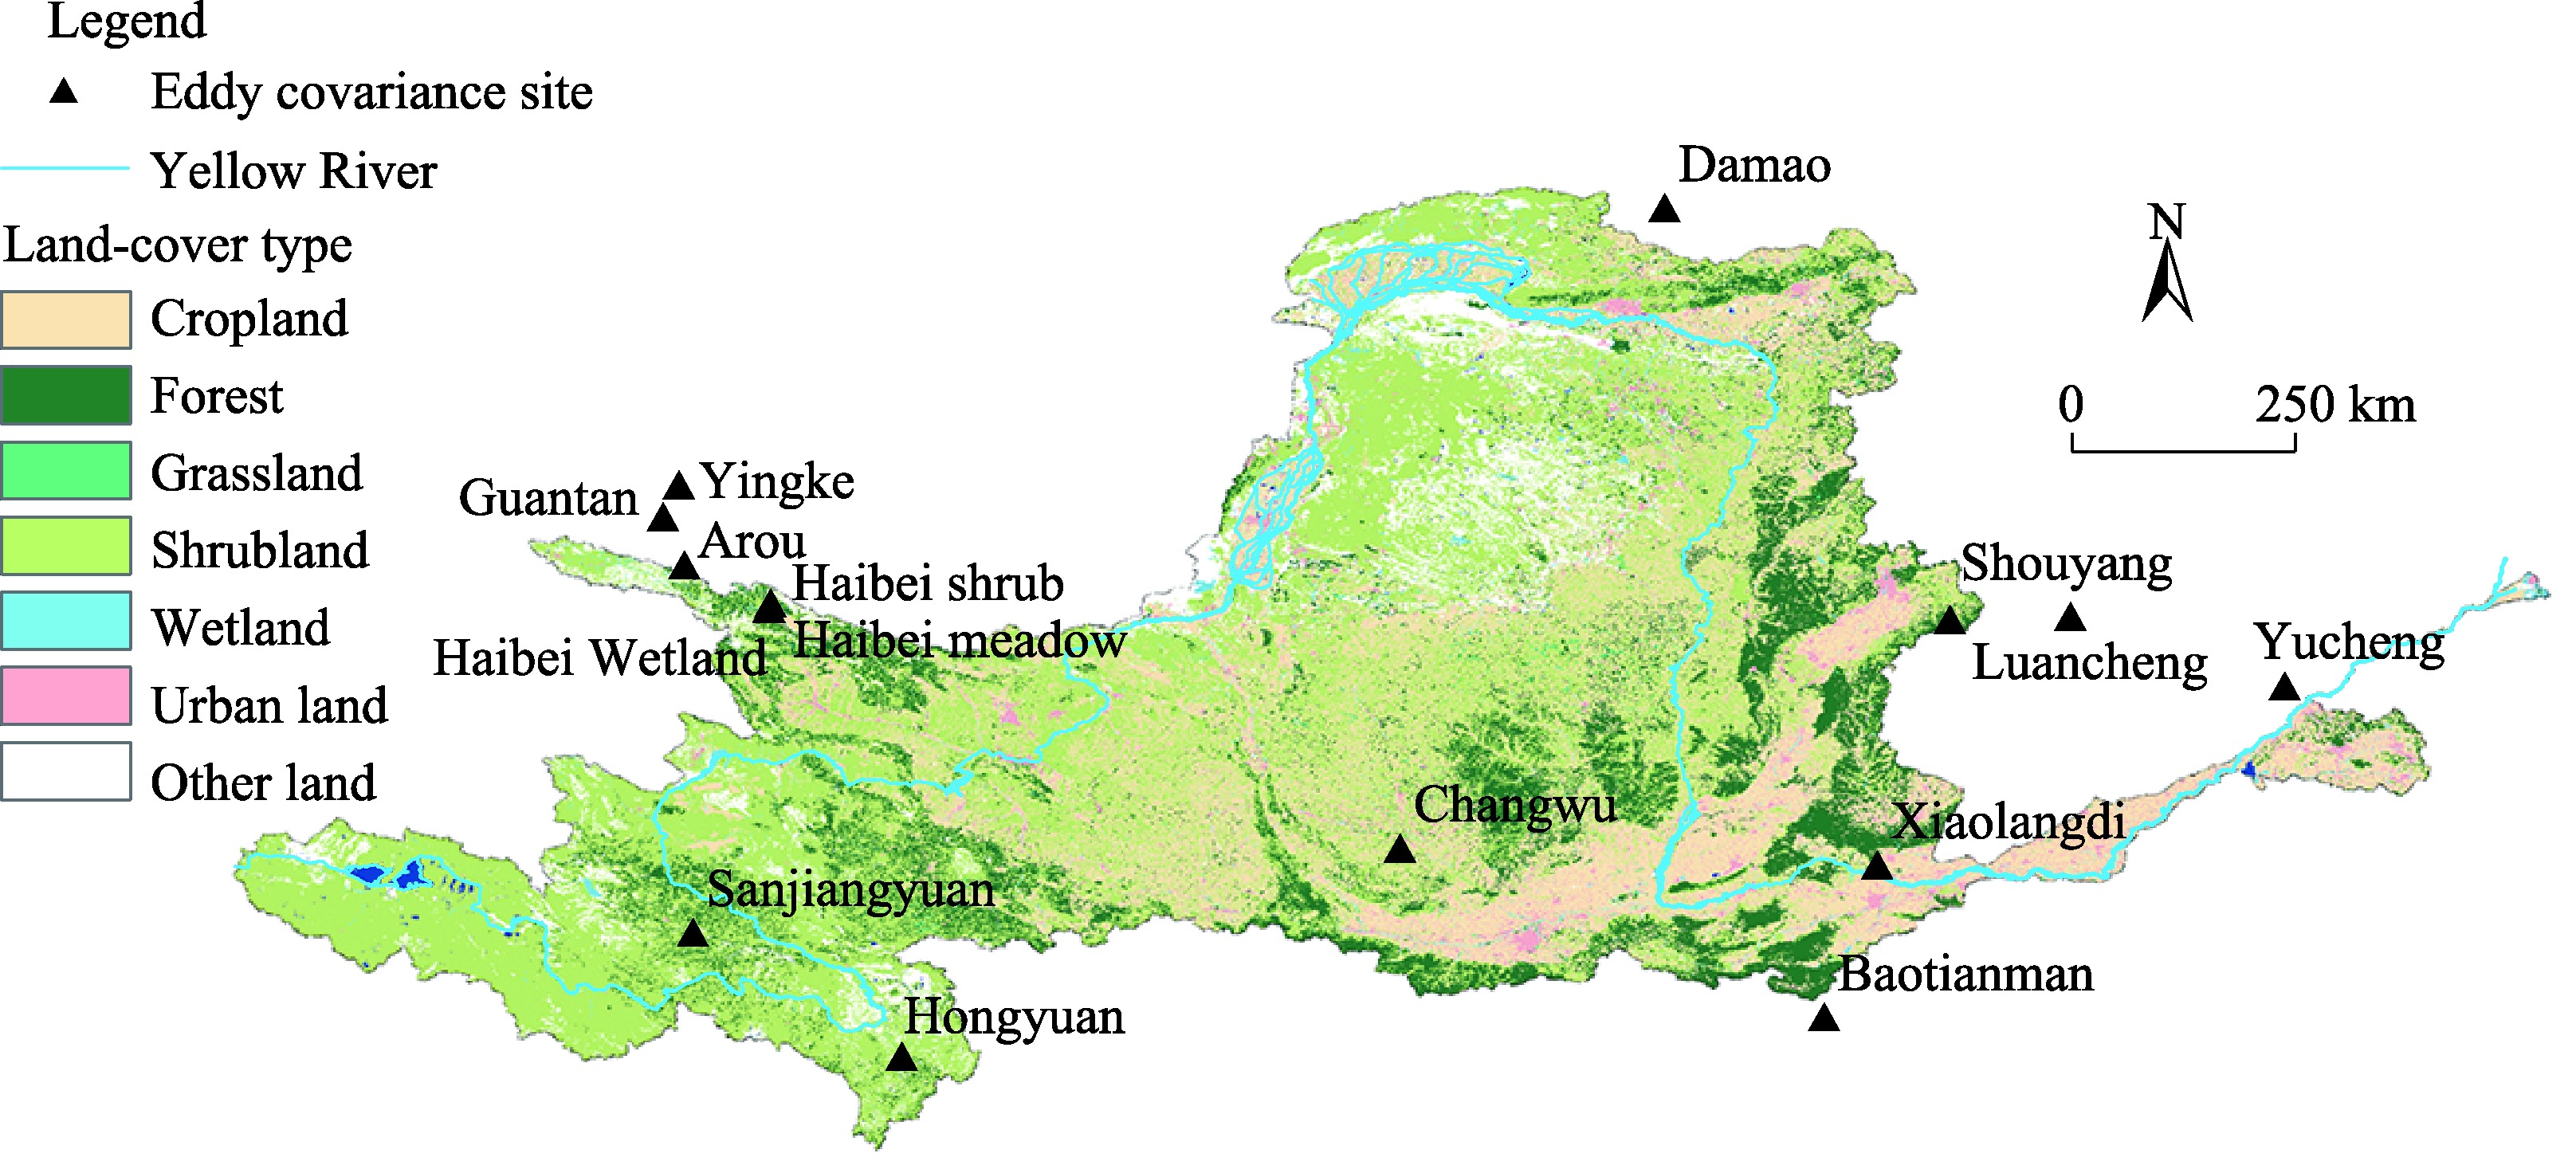
Fig. 1Location of the selected eddy covariance sites and the spatial distribution of major land-cover types within the Yellow River Basin (YRB) and its adjacent 100-km buffer zone.
Table 1 Basic information for the observation sites
Site
Flux processing software/method
u* threshold
Valid data after QC (%)
Short-gap filling
Long-gap filling
Reference
Changwu
-
-
-
LI
-
Wang et al. (2024)
Luancheng
-
-
66.0
MDS (<30 d)
NLR
Liu et al. (2023a)
Shouyang
-
-
-
-
-
Mei et al. (2023)
Yingke
REddyProc
-
-
MDS
RF
Wang et al. (2025b)
Yucheng
ChinaFLUX standard method
-
39.1-50.4
-
ChinaFLUX standard method
Zhao et al. (2021)
Arou
REddyProc
-
MDS
RF
Wang et al. (2025b)
Damao
ChinaFLUX standard method
0.10 m/s
34.0-61.6
LI (<2 h)
MDS
Song et al. (2023)
Haibei meadow
EddyPro v. 7.0.6
0.15 m/s
34.7-46.5
-
BRT
Zhang et al. (2023b)
Sanjiangyuan
ChinaFLUX standard method
-
LI (<2 h)
LI and NLR
He et al. (2023)
Haibei shrub
EddyPro v. 7.0.6
0.15 m/s
38.1-48.3
LI (<2 h)
NLR and BRT
Zhang et al. (2021b)
Guantan
REddyProc
-
MDS
RF
Wang et al. (2025b)
Baotianman
LoggerNet; EddyPro 6.0.0
0.20 m/s
52.0 and 61.0
-
MDS and MDV
Niu et al. (2023)
Xiaolangdi
-
0.15 m/s in 2016; 0.26 m/s in 2017; and not reported for the remaining years
45.1-67.9
MDS (<15 d)
ANN and MDV
Huang et al. (2023)
Haibei
ChinaFLUX standard method
-
34.1-48.9
LI (<2 h)
NLR
Zhang et al. (2021a)
Hongyuan
MATLAB
-
31.8-39.3
LI (<2 h)
NLR
Chen et al. (2023)
Table 2 Summary of net ecosystem carbon dioxide (CO2) exchange (NEE) quality-control procedures, friction velocity (u*) filtering, and gap-filling methods for each observation site
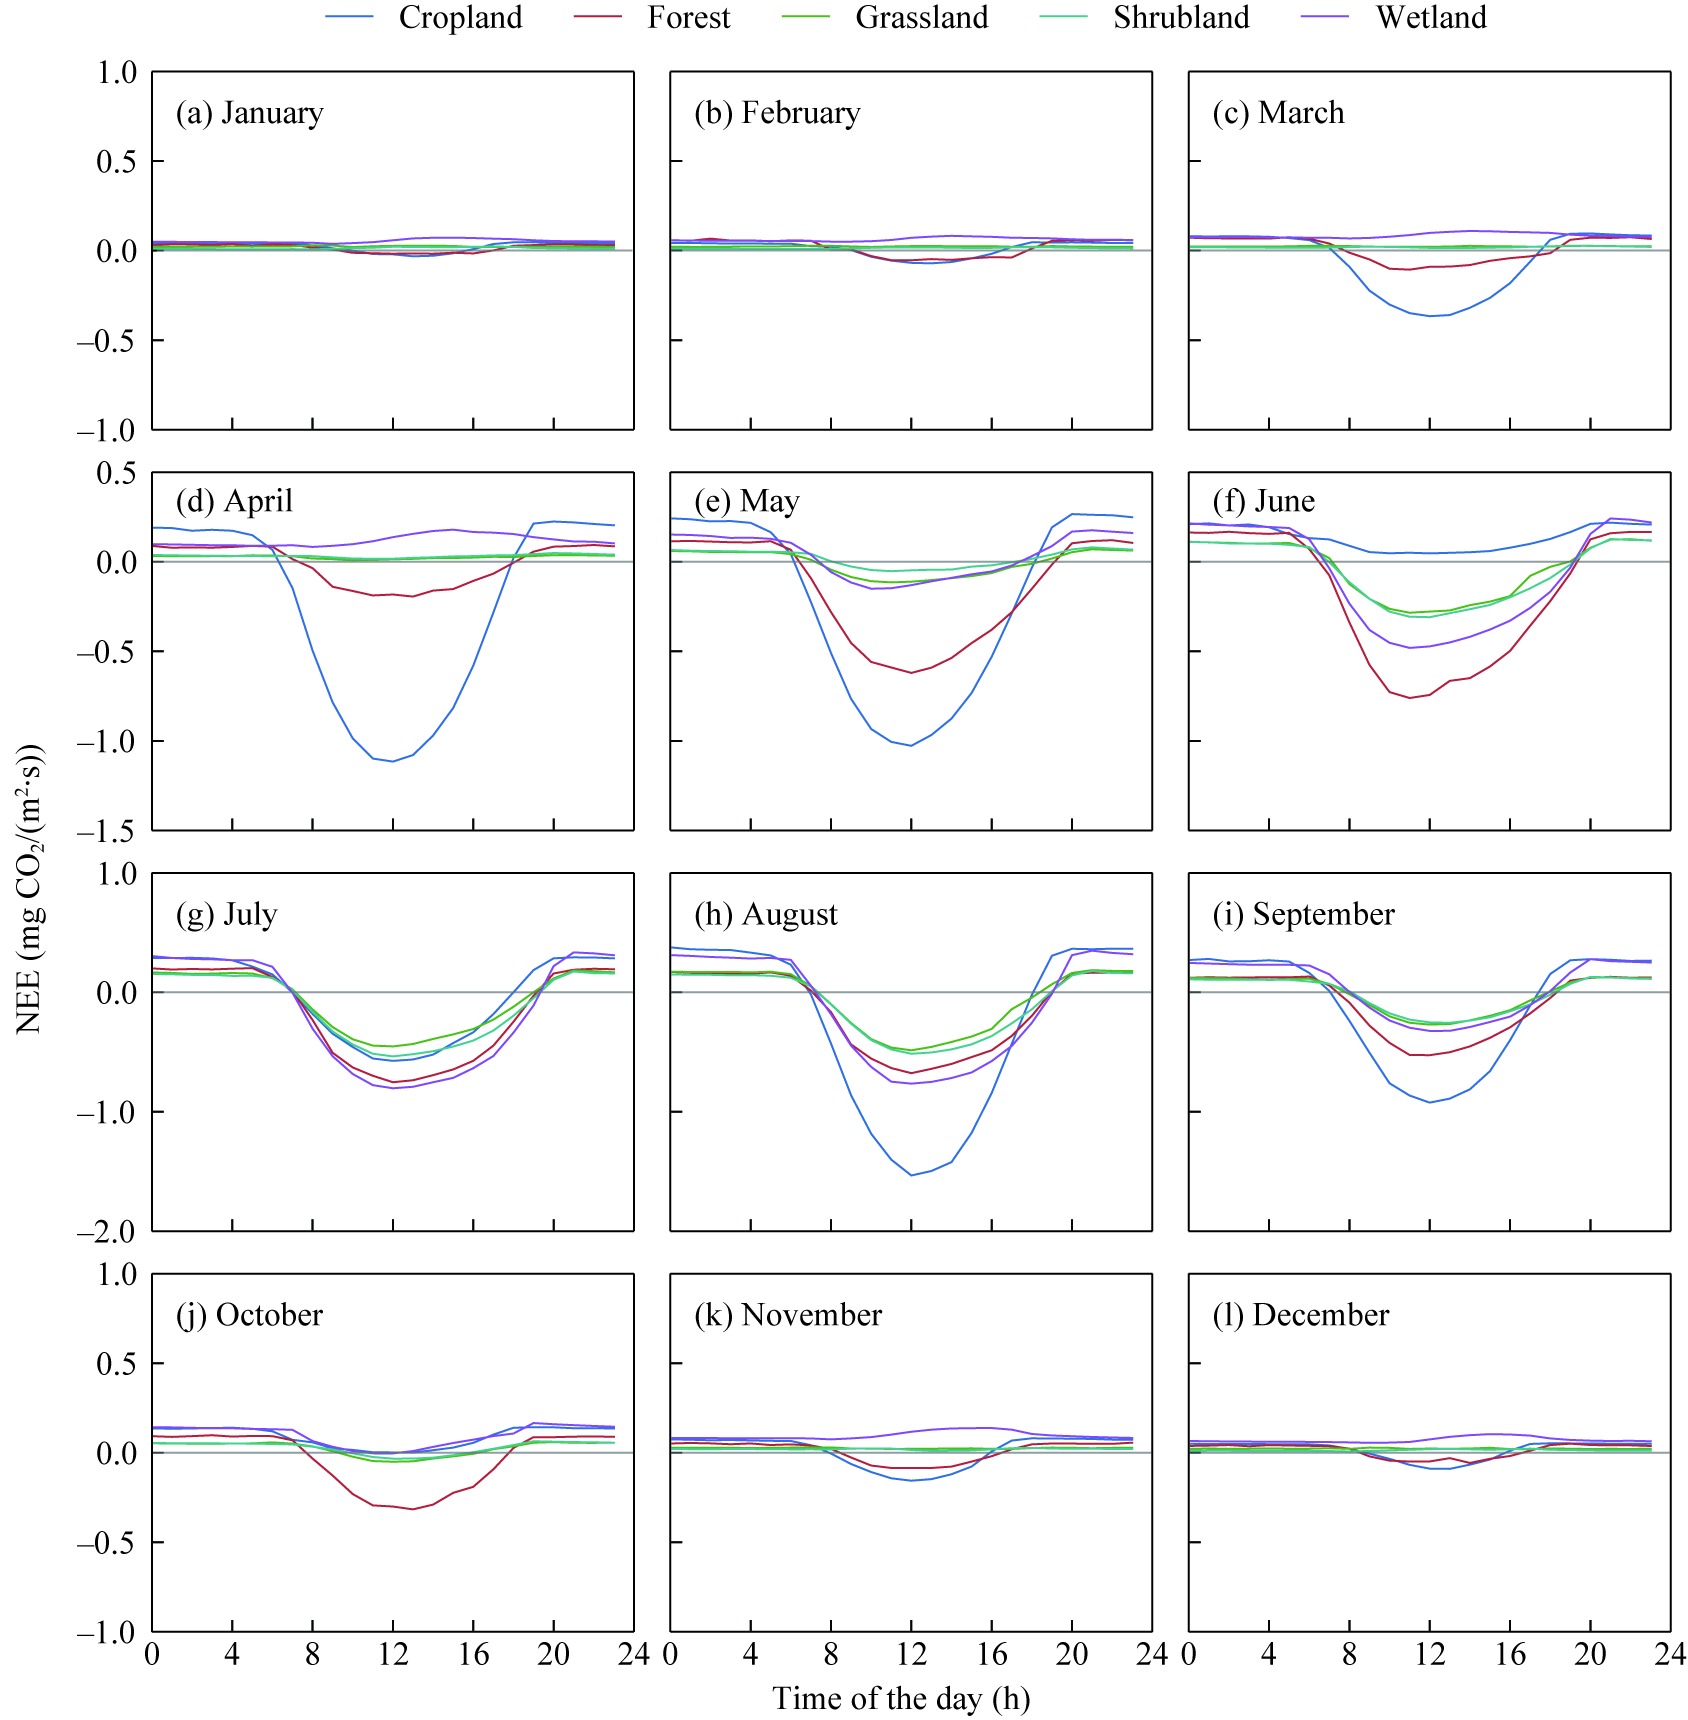
Fig. 2Monthly mean diurnal cycles of net ecosystem carbon dioxide (CO2) exchange (NEE) in cropland, forest, grassland, shrubland, and wetland ecosystems across the YRB. (a), January; (b), February; (c), March; (d), April; (e), May; (f), June; (g), July; (h), August; (i), September; (j), October; (k), November; (l), December. Negative NEE values indicate net ecosystem CO2 uptake, whereas positive values indicate net CO2 release.
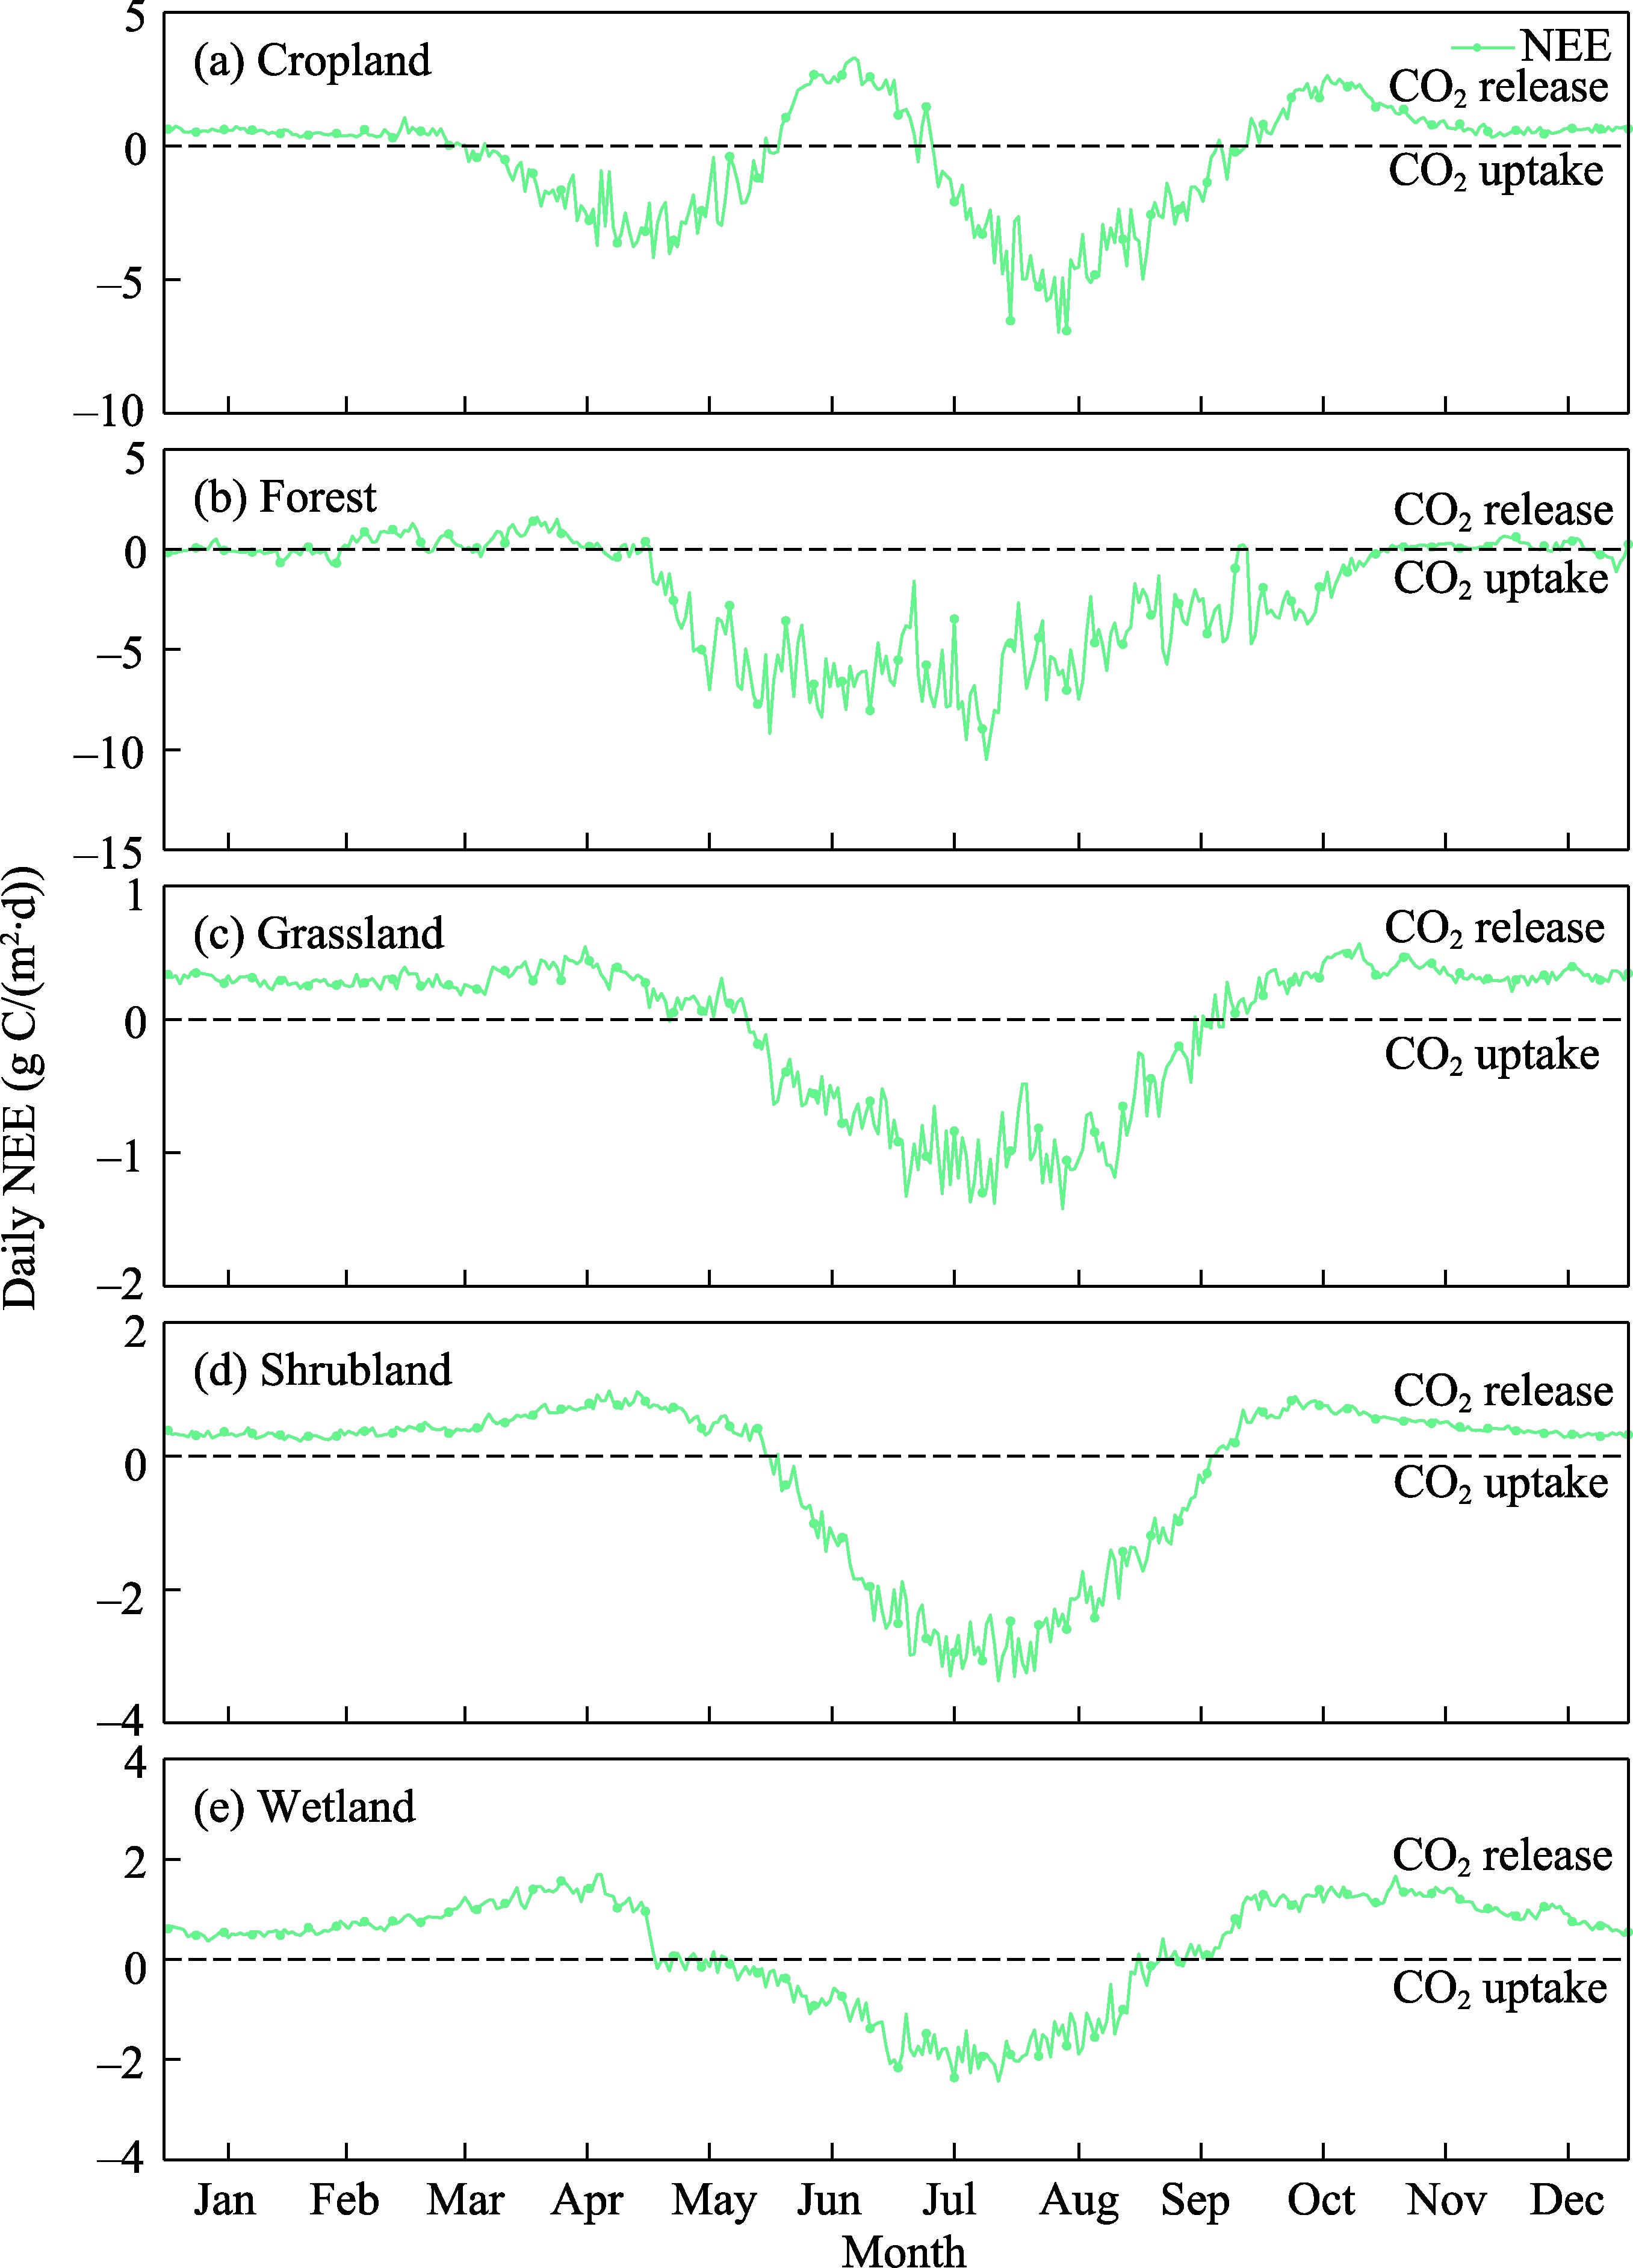
Fig. 3Intra-annual dynamics of daily NEE in five terrestrial ecosystem types across the YRB study area. (a), cropland; (b), forest; (c), grassland; (d), shrubland; (e), wetland. The dashed horizontal line denotes NEE=0.0 g C/(m2•d); negative NEE values indicate net ecosystem CO2 uptake, whereas positive values indicate net CO2 release.
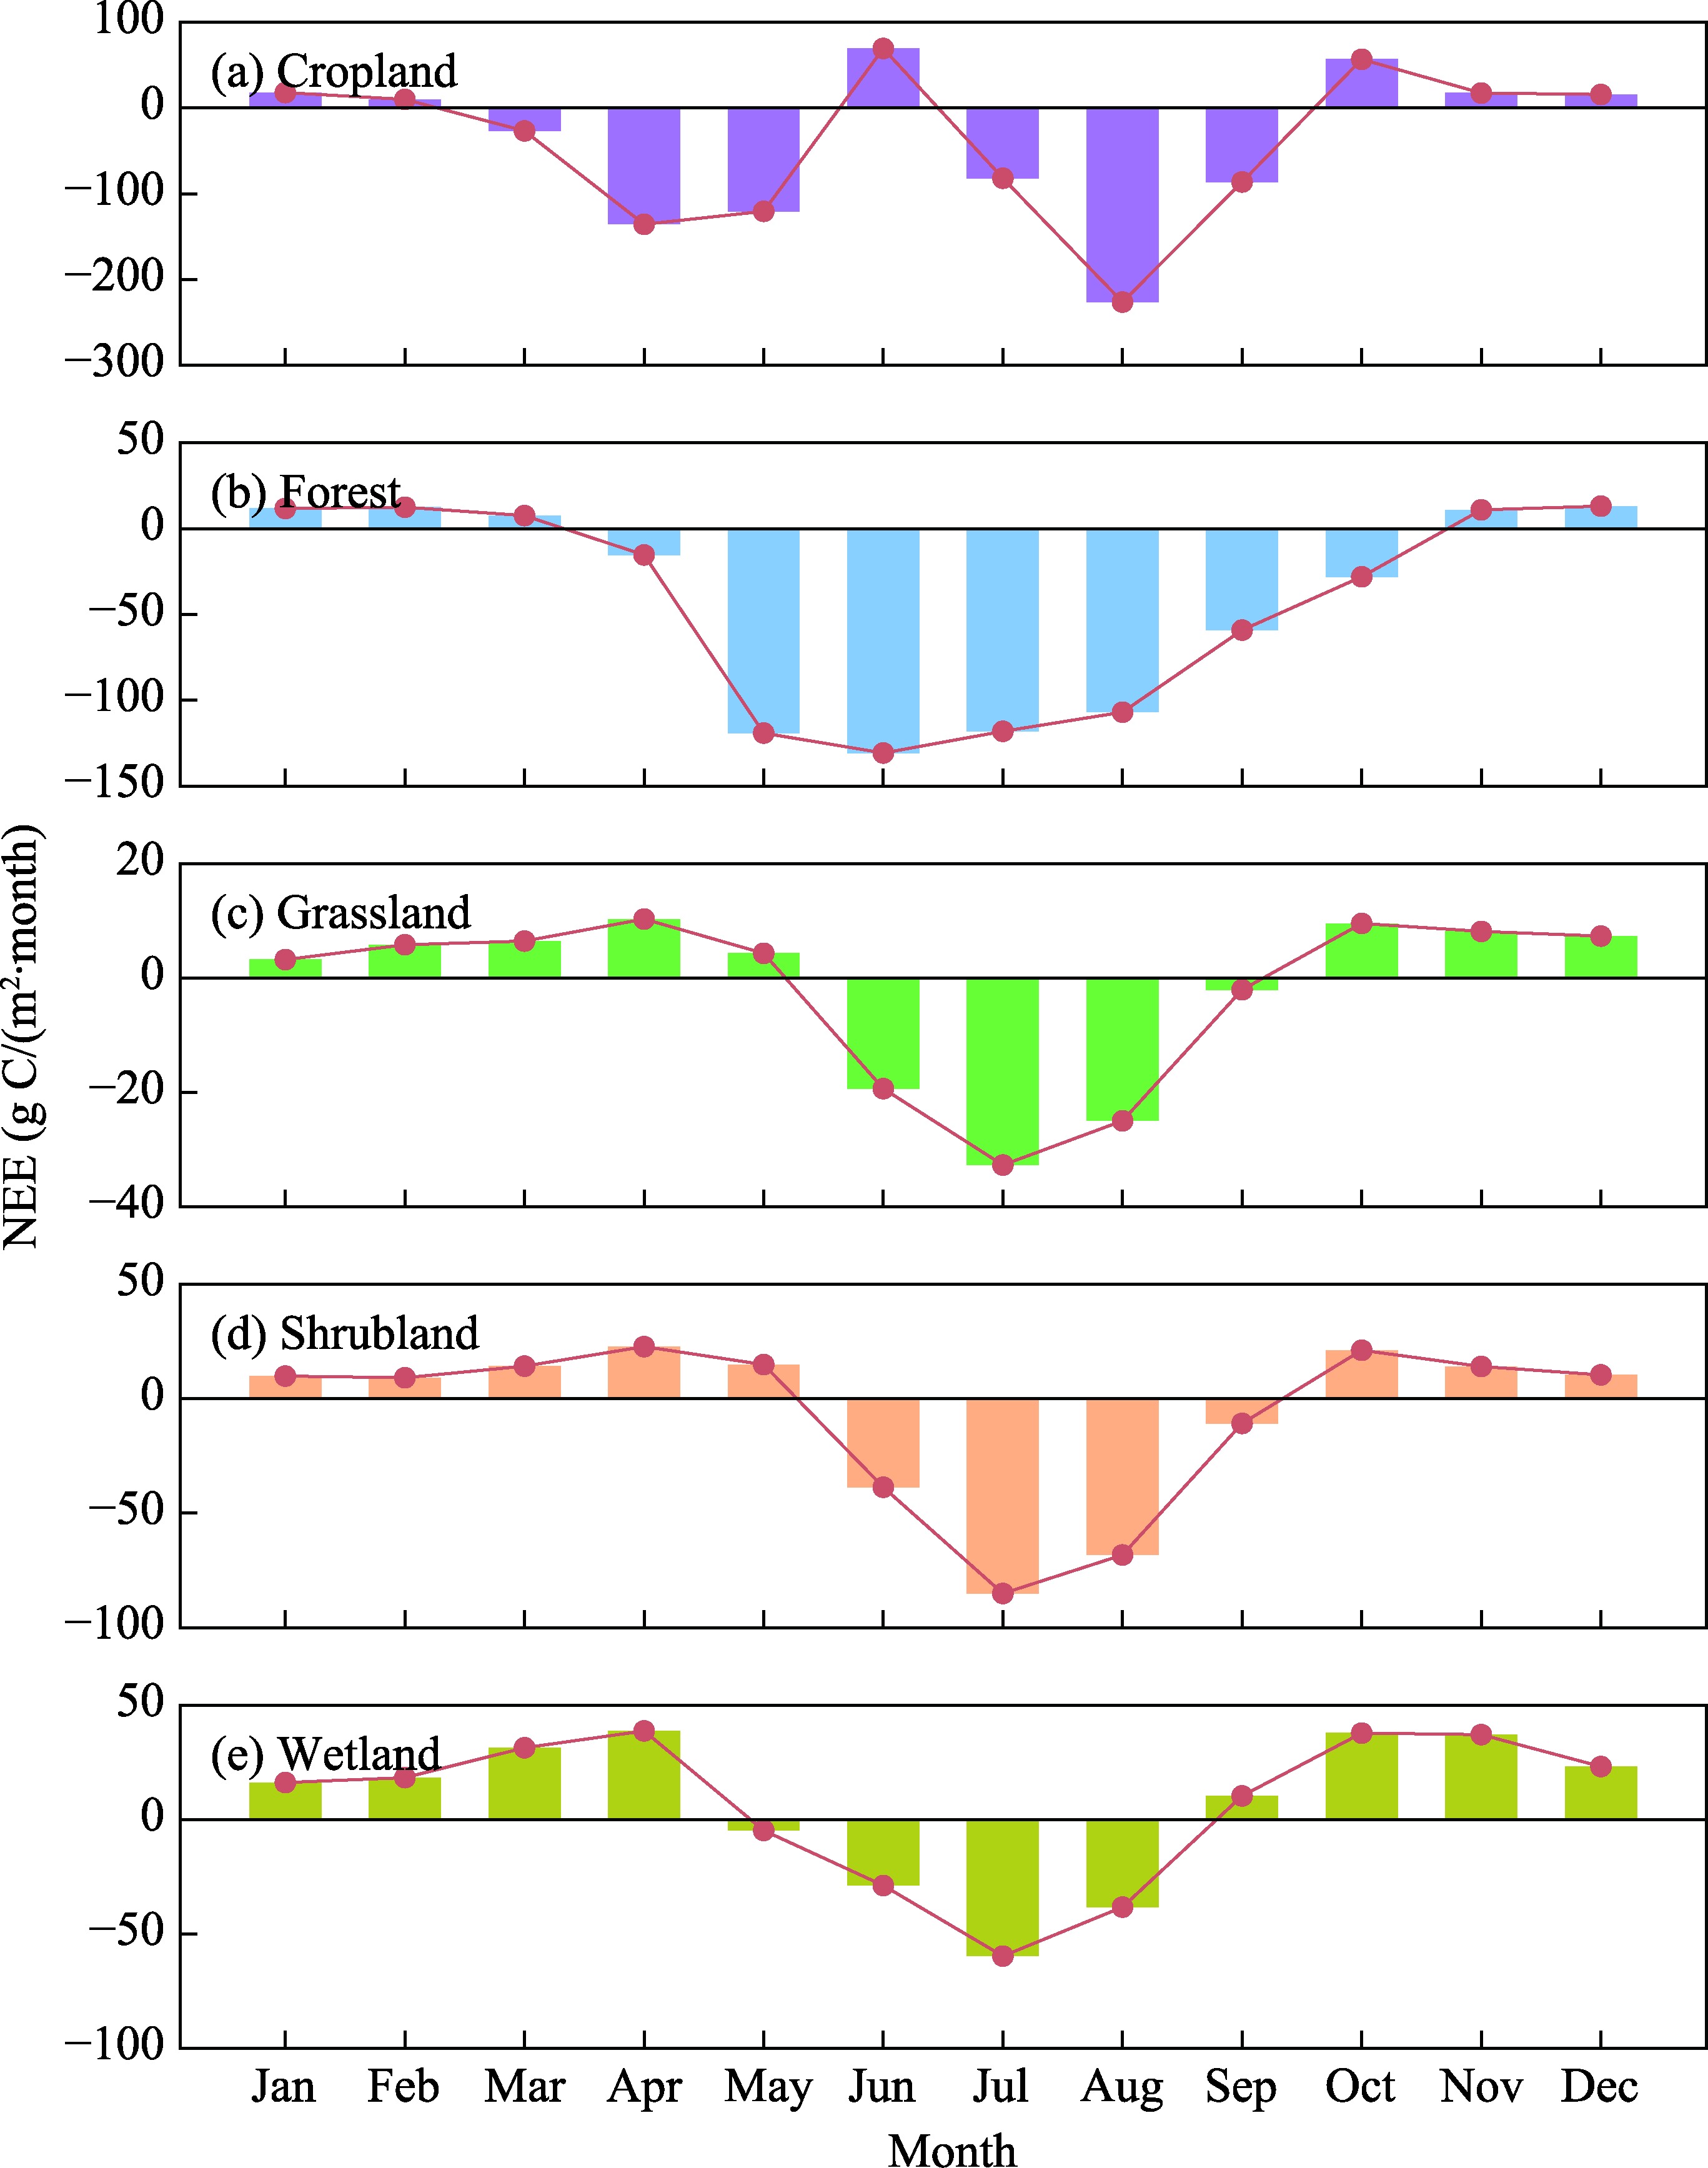
Fig. 4Monthly totals of NEE in five terrestrial ecosystem types across the YRB. (a), cropland; (b), forest; (c), grassland; (d), shrubland; (e), wetland. The horizontal line at NEE=0 g C/(m2•month) indicates the balance between net CO2 uptake and net CO2 release. Negative NEE values indicate net ecosystem CO2 uptake, whereas positive values indicate net CO2 release.
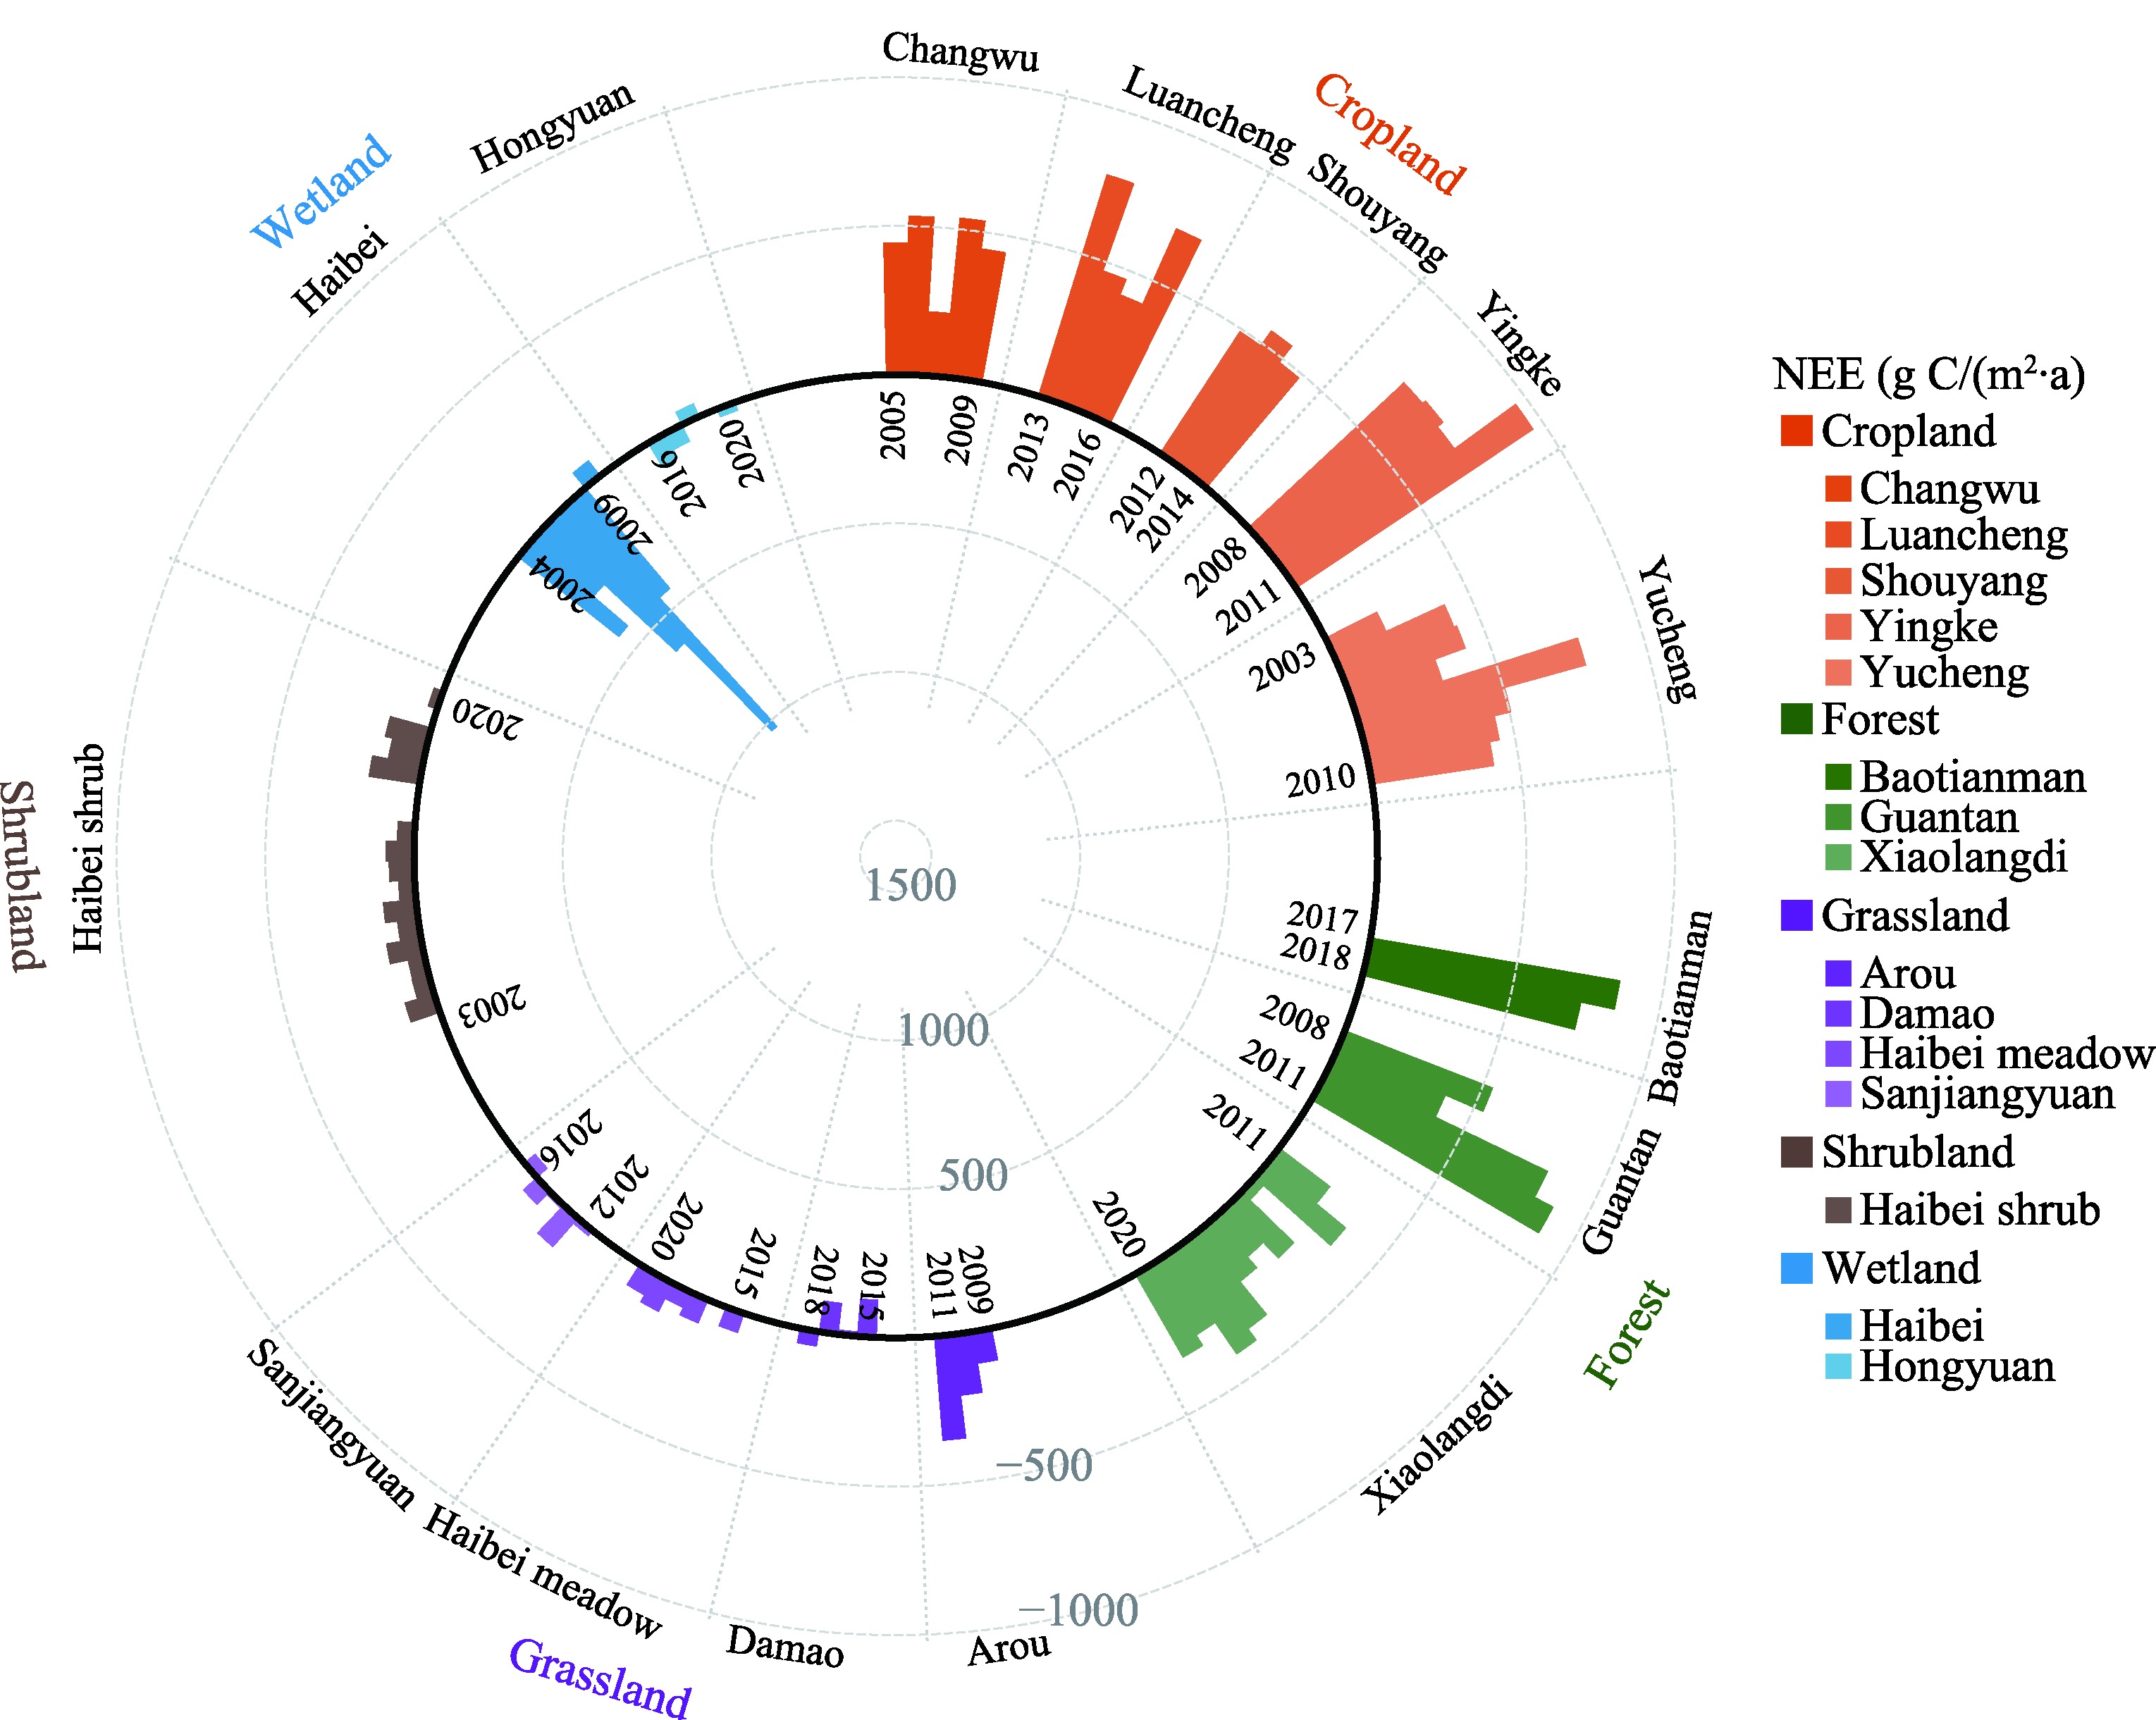
Fig. 5Interannual variations in NEE at selected eddy covariance sites within the YRB. Negative NEE values indicate net ecosystem CO2 uptake, whereas positive values indicate net CO2 release.
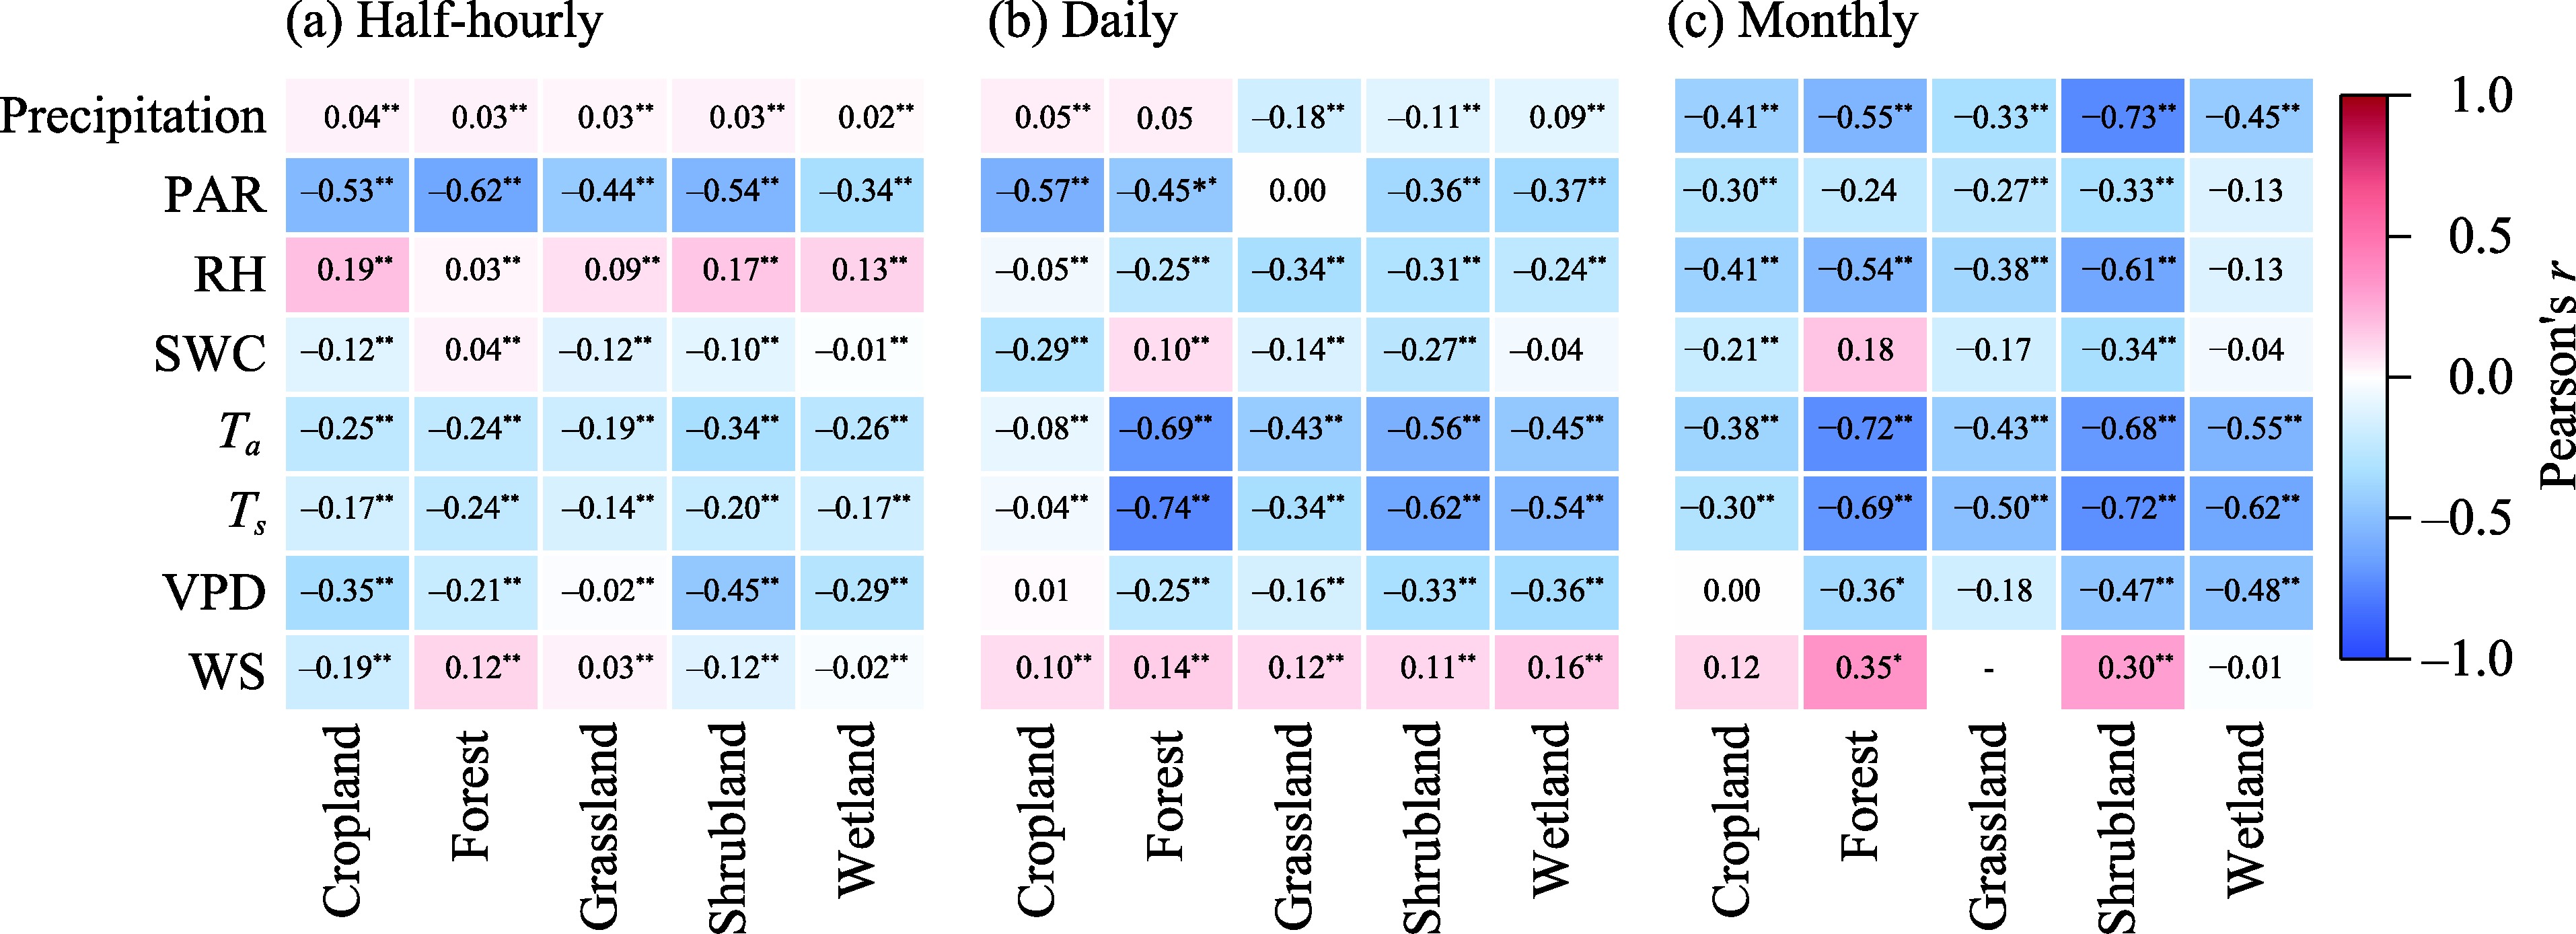
Fig. 6Pearson's correlation coefficient (r) values between NEE and environmental variables across ecosystem types at the half-hourly (a), daily (b), and monthly (c) scales. PAR, photosynthetically active radiation; RH, relative humidity; SWC, soil water content; Ta, air temperature; Ts, soil temperature; VPD, vapor pressure deficit; WS, wind speed; *, significance at P<0.05 level; **, significance at P<0.01 level. "-" indicates that the correlation coefficient was not calculated because of insufficient valid data.
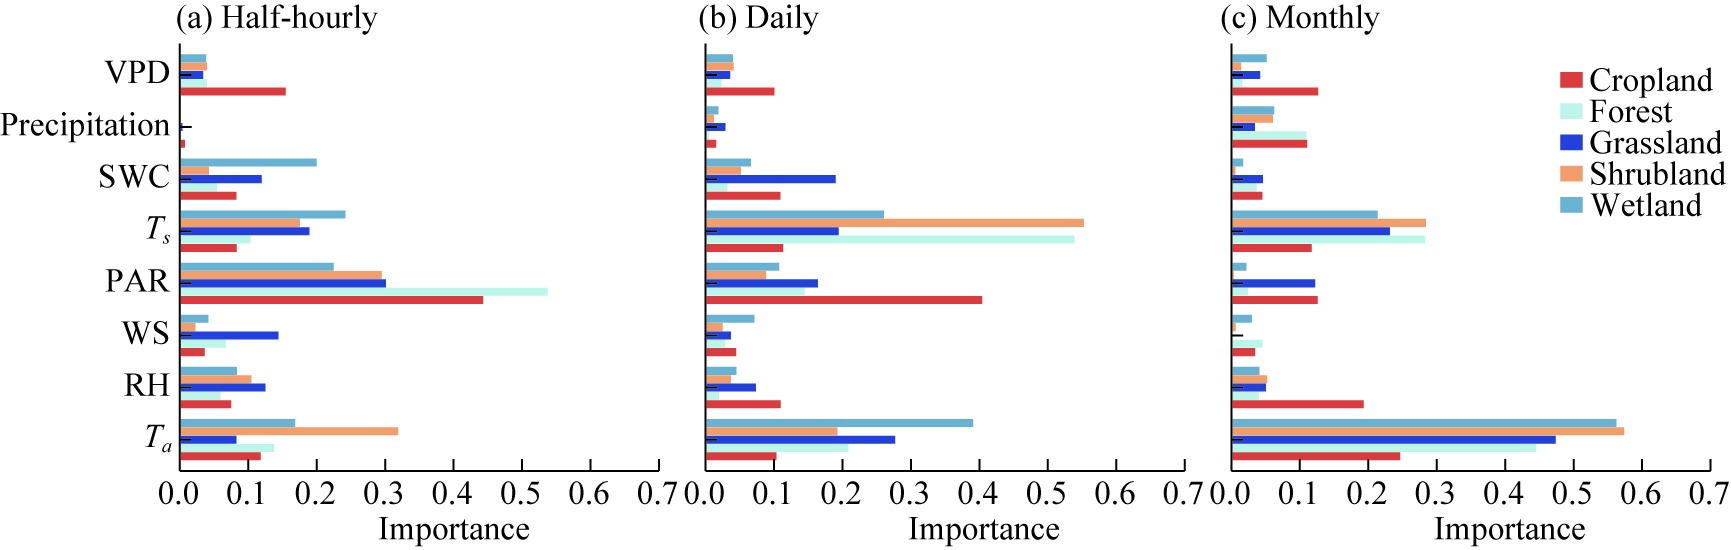
Fig. 7Relative importance rankings of environmental factors influencing NEE at the half-hourly (a), daily (b), and monthly (c) scales.
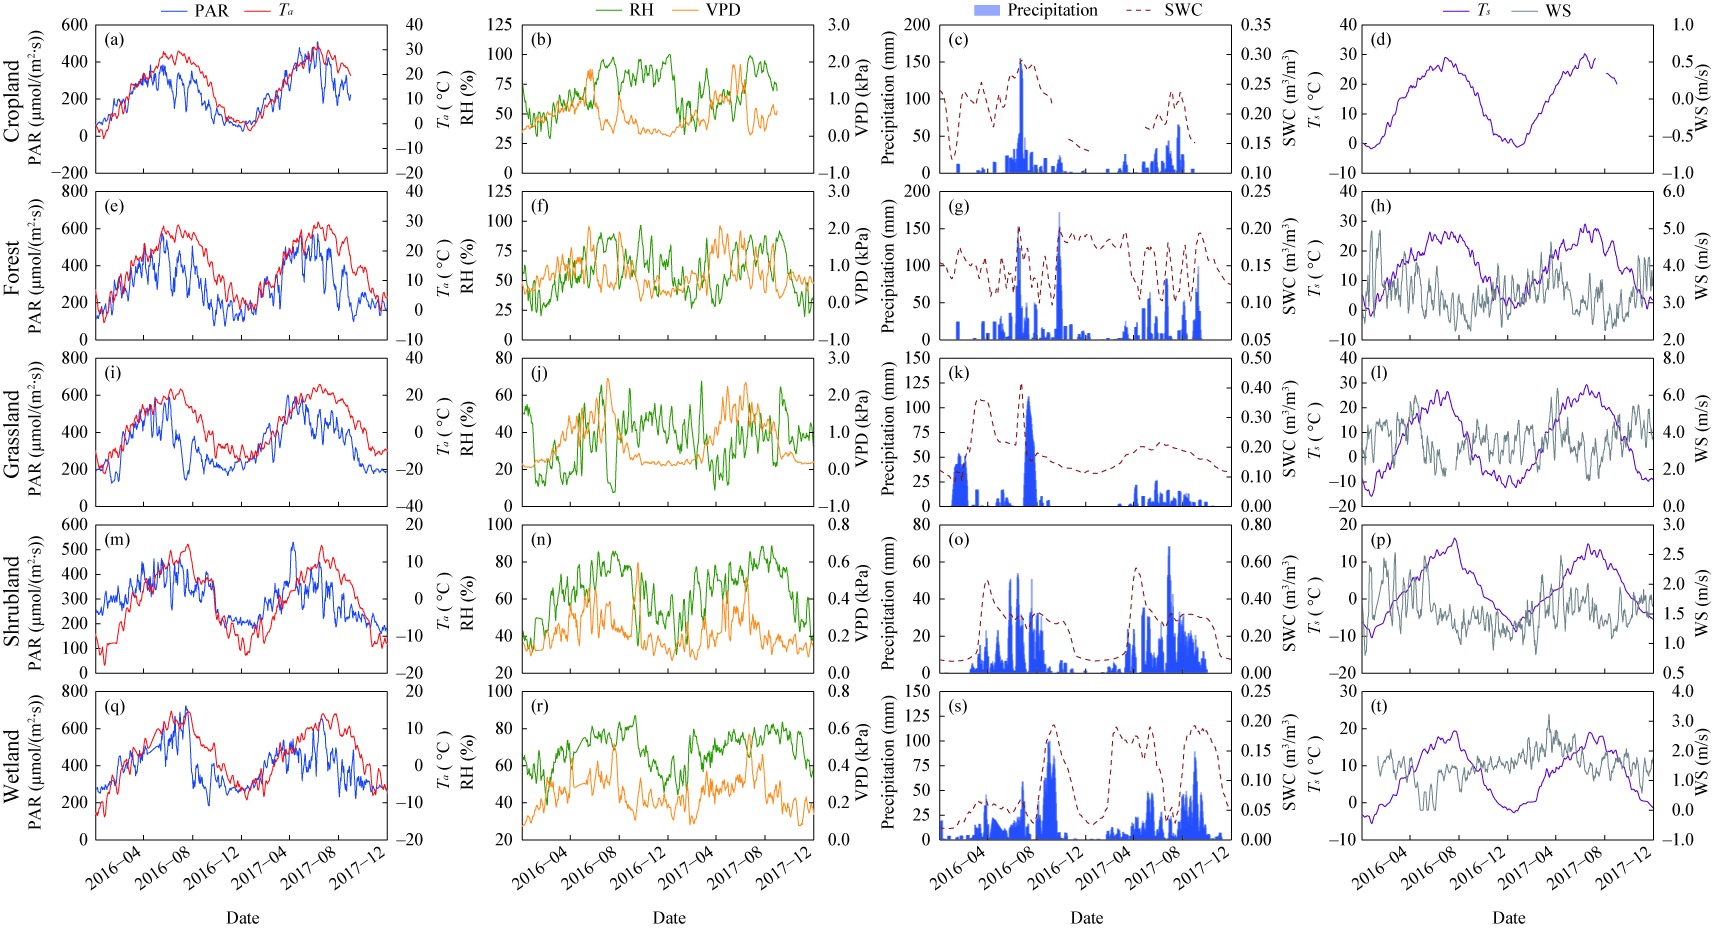
Fig. 8Temporal variations in environmental variables across five ecosystem types during 2016-2017. (a-d), cropland; (e-h), forest; (i-l), grassland; (m-p), shrubland; (q-t), wetland. For ease of comparison, variables with closely related environmental meanings were paired as follows: PAR-Ta for radiative and thermal conditions, RH-VPD for atmospheric moisture conditions, and precipitation-SWC for water input and soil-moisture response; Ts and WS were displayed together as the remaining variables. PAR, Ta, RH, VPD, SWC, Ts, and WS are the 7-day centered moving averages, while precipitation is shown as a 7-day cumulative value. Gaps or absent curves indicate periods or variables with insufficient valid observations.
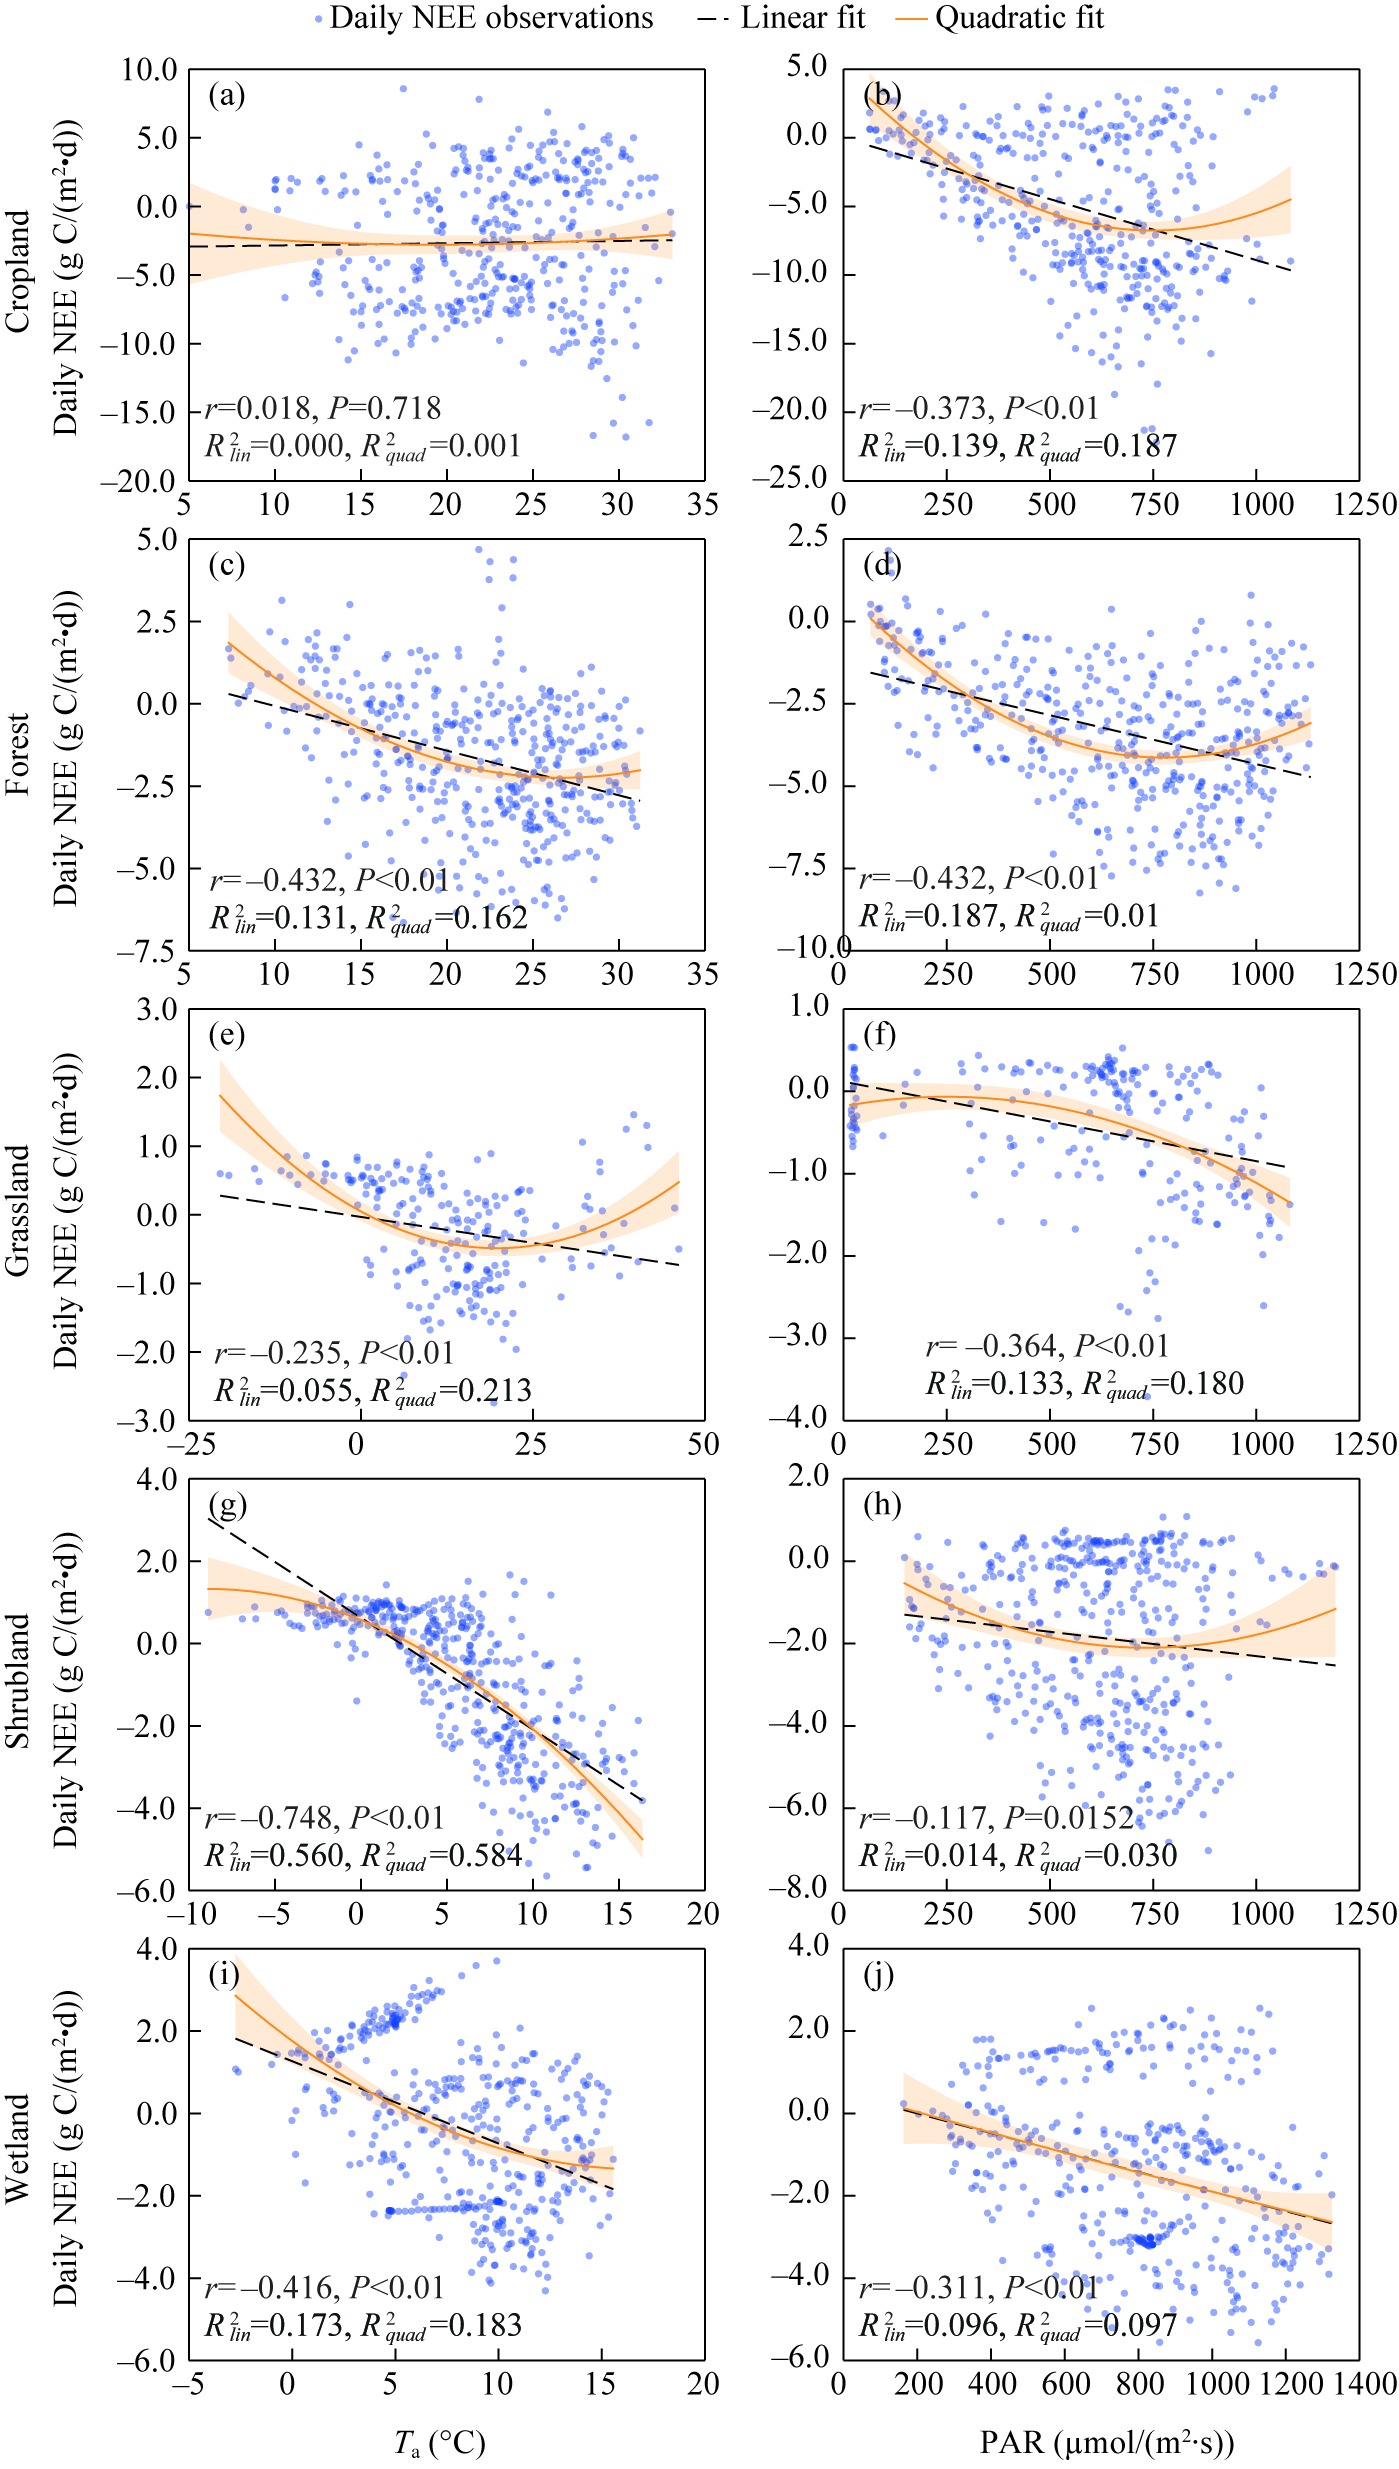
Fig. 9Relationships between daily NEE and Ta (a, c, e, g, and i) and between daily NEE and PAR (b, d, f, h, and j) across five ecosystem types. Shaded areas denote the 95% confidence intervals.
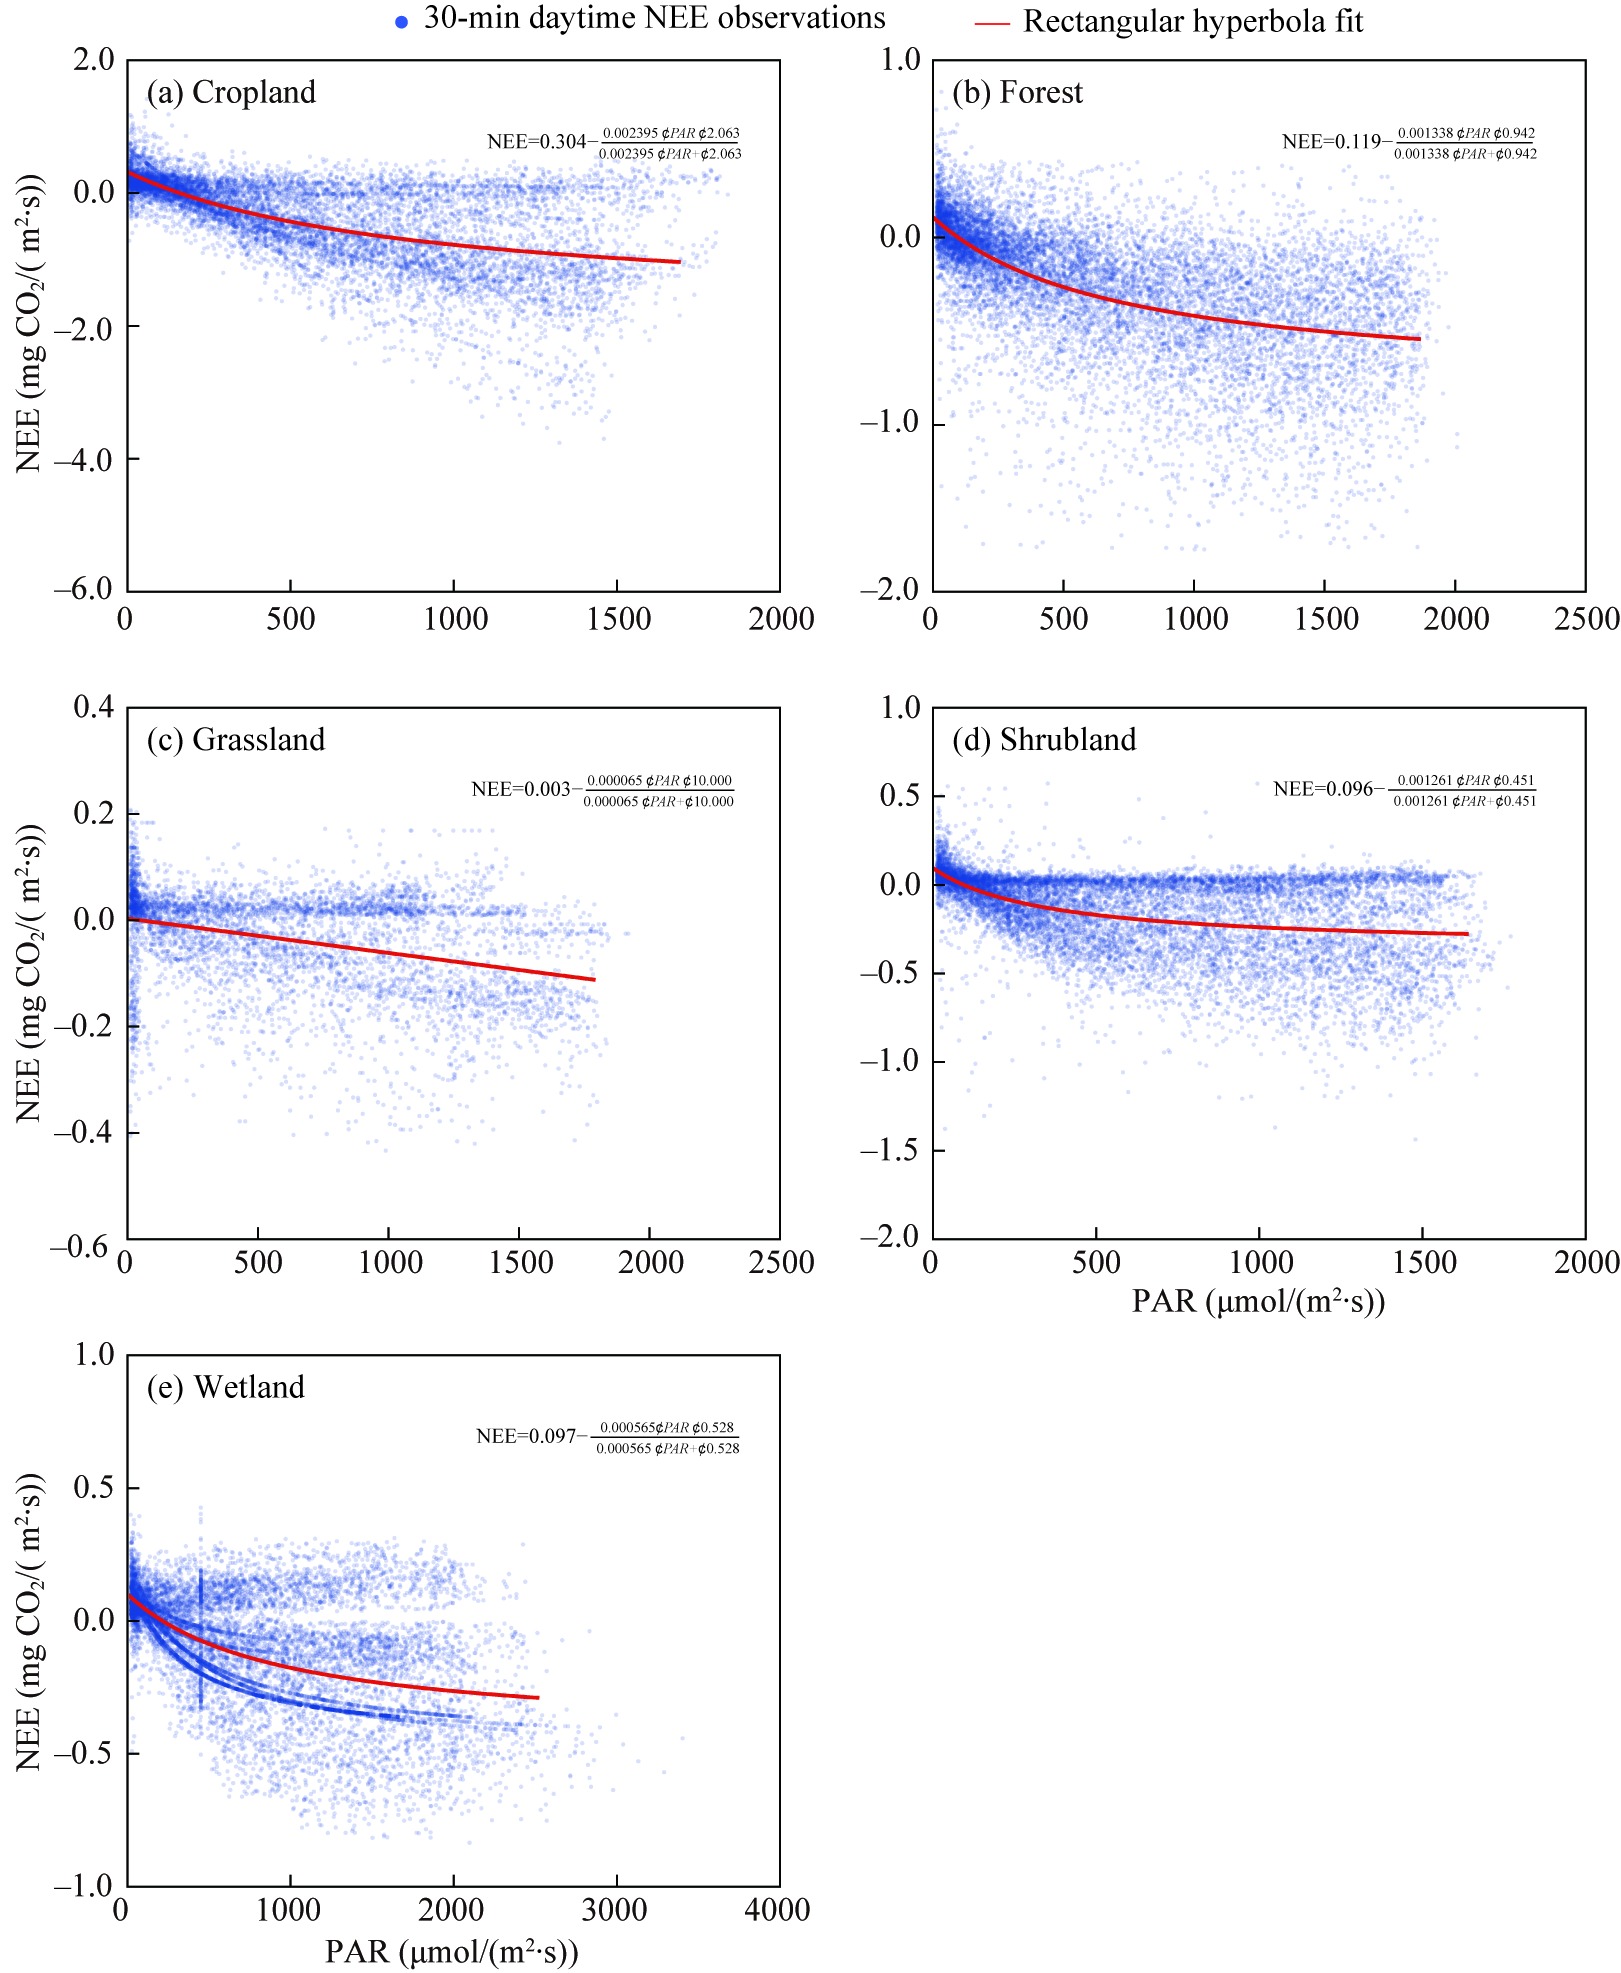
Fig. 10Daytime half-hourly relationships between NEE and PAR during the 2016-2017 growing seasons. (a), cropland; (b), forest; (c), grassland; (d), shrubland; (e), wetland.
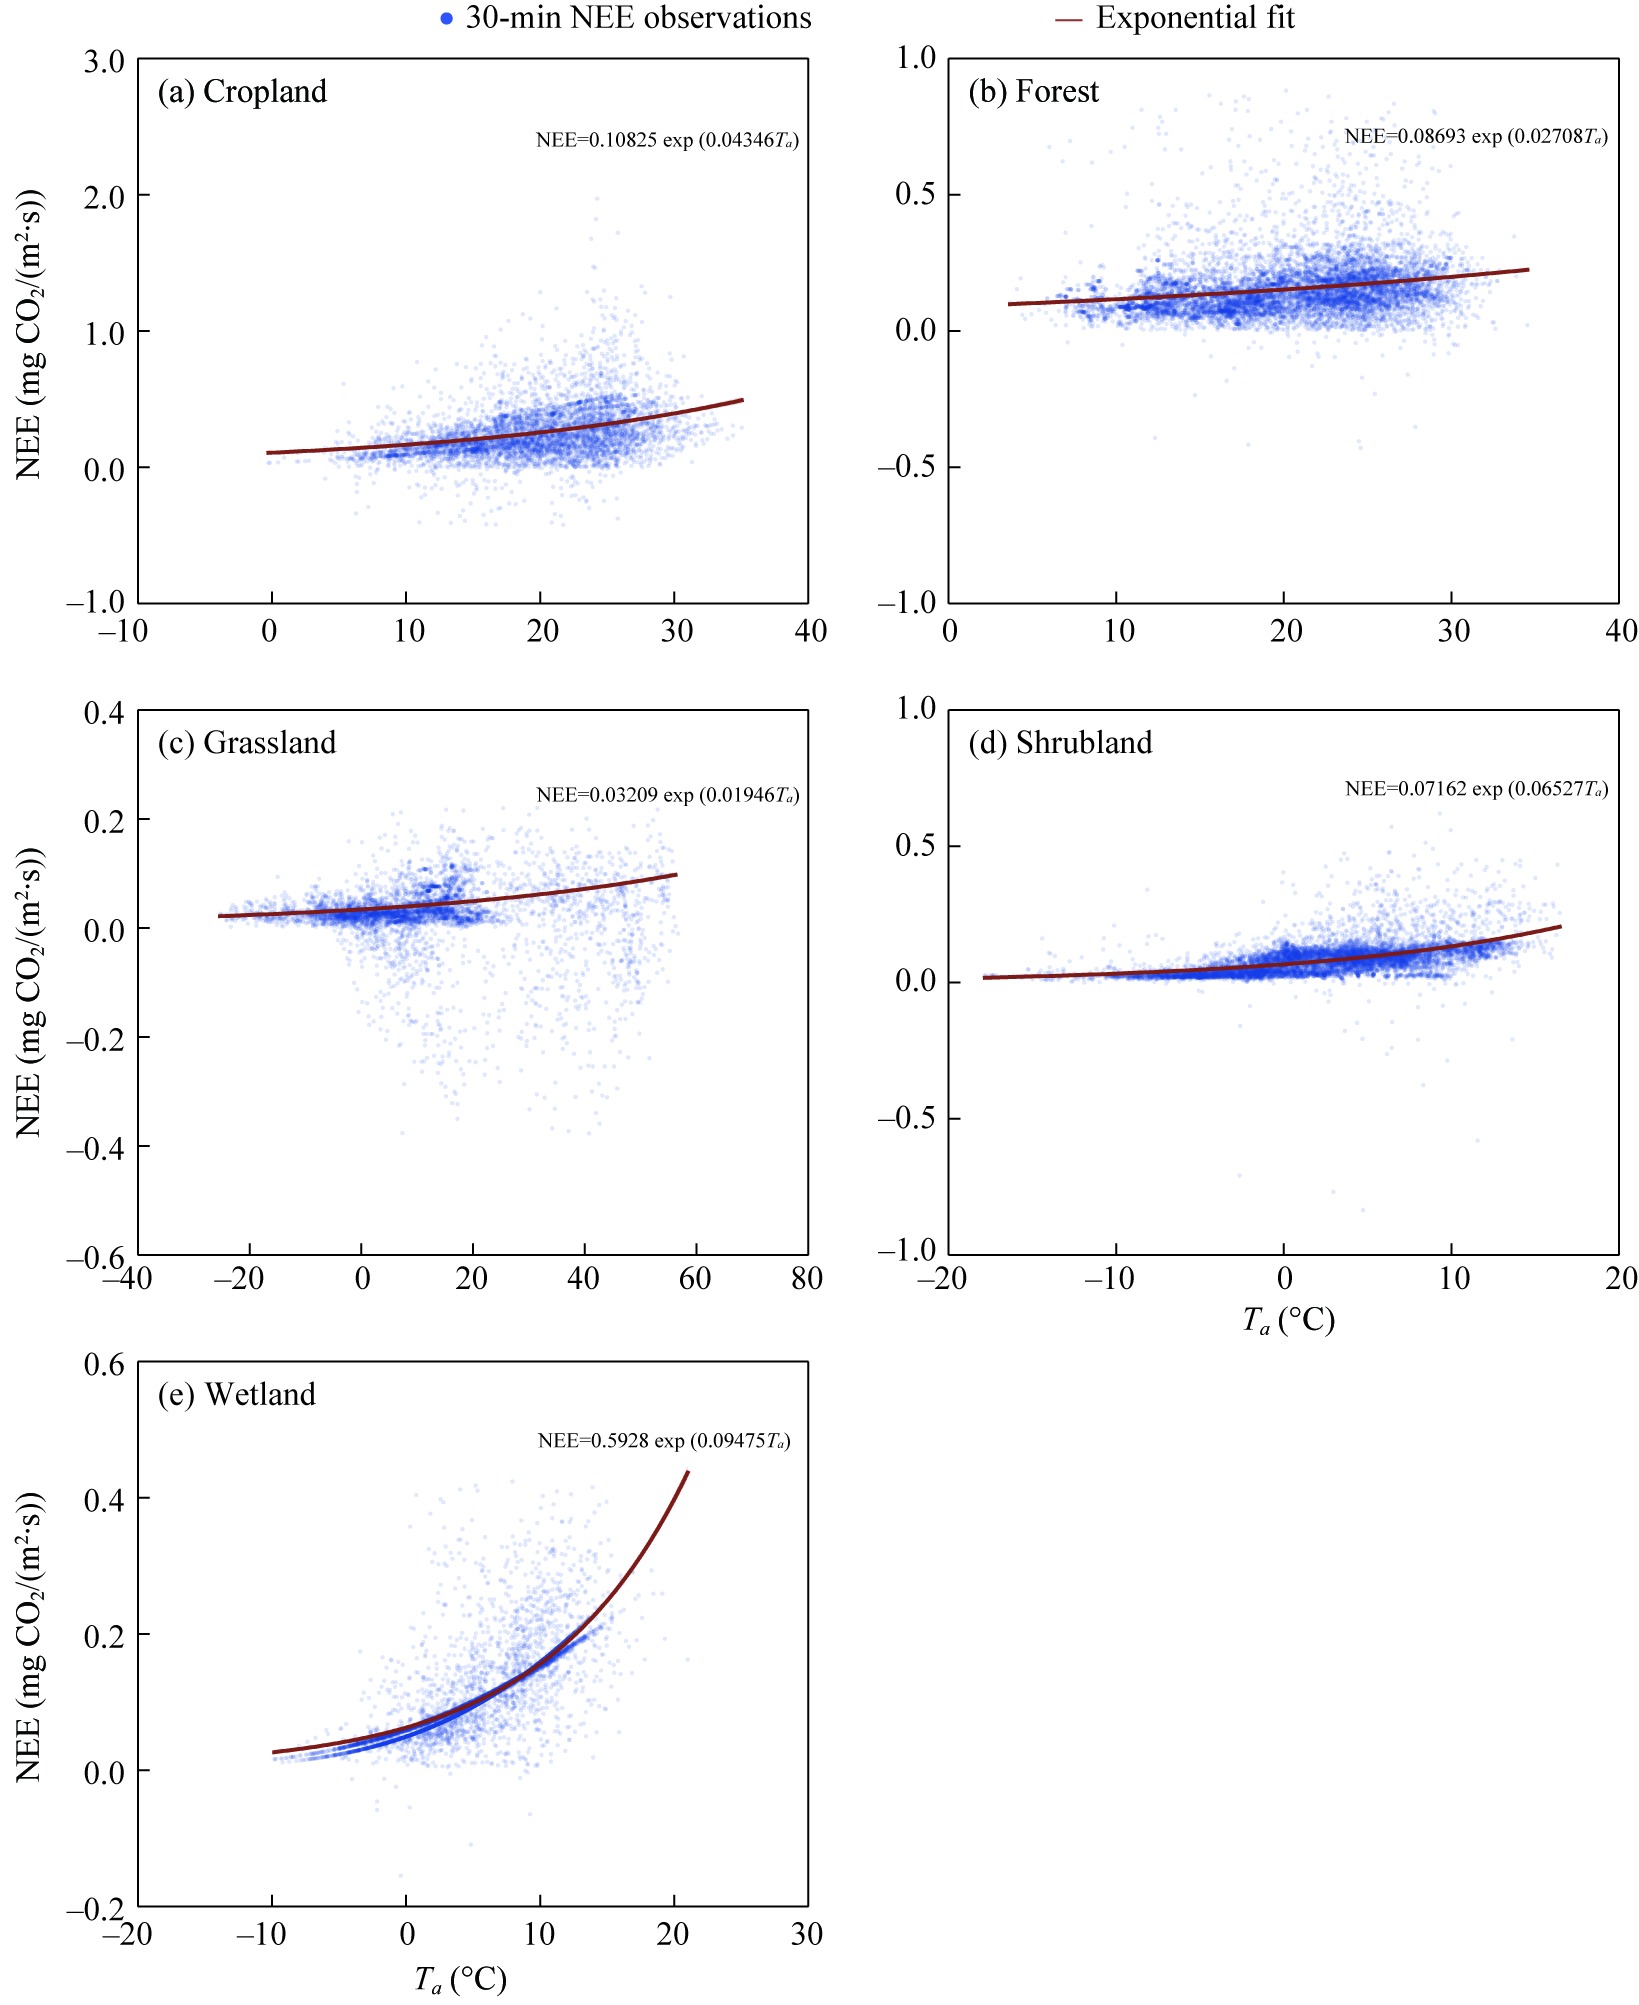
Fig. 11Nighttime half-hourly relationships between NEE and Ta during the 2016-2017 growing seasons. (a), cropland; (b), forest; (c), grassland; (d), shrubland; (e), wetland.
Ecosystem type
Study area
Time scale
CO2 emission/uptake (g C/m2)
Reference
Cropland
Wheat fields in the North China Plain
Growing season
-437.90
Zhang et al. (2020)
Cropland
Jinzhou agroecosystem site, Liaoning Province, China
Annual mean
-270.00±31.00
Zhang et al. (2021c)
Cropland
Yellow River Basin (YRB)
Annual mean
-447.28
This study
Forest
Qilian Mountains
Annual
-545.99
Du et al. (2022)
Forest
Field poplar forest in Hongze Lake
Growing season
-1758.10
Xu et al. (2018)
Forest
YRB
Annual mean
-350.04
This study
Grassland
Horqin sandy grassland
Growing season
-139.83
Niu et al. (2018)
Grassland
Xilinhot grassland
Annual
-120.00
Wang et al. (2015b)
Grassland
YRB
Annual mean
-25.98
This study
Shrubland
East scrub meadow in Qilian Mountains
Growing season
-662.98
Gao et al. (2022)
Shrubland
Yanchi Research Station, Ningxia Hui Autonomous Region, China
Annual
-77.00
Jia et al. (2014)
Shrubland
YRB
Annual mean
-85.76
This study
Wetland
Chongming Dongtan Coastal Reclamation Wetland
Growing season
-1033.20
Wang et al. (2015a)
Wetland
Liaohe Delta
Annual mean
-556.00
Jia et al. (2017)
Wetland
YRB
Annual mean
286.28
This study
Table 3 Comparison of CO2 fluxes among different terrestrial ecosystems
Year
NEE (g C/(m2•a))
Reco (g C/(m2•a))
GPP (g C/(m2•a))
2004
431.91
1969.94
1538.03
2005
279.68
2088.97
1809.30
2006
610.55
2198.73
1585.17
2007
1027.97
2490.73
1462.34
2008
442.12
2081.46
1639.34
2009
-65.27
2057.68
2122.95
Table S1 Annual net ecosystem CO2 exchange (NEE) and its partitioned components at the Haibei wetland site during 2004-2009
[1]
Ahlström A, Raupach M R, Schurgers G, et al. 2015. The dominant role of semi-arid ecosystems in the trend and variability of the land CO2 sink. Science, 348(6237): 895-899.
doi: 10.1126/science.aaa1668
pmid: 25999504
[2]
Bai Y, Zhu Y Q, Liu Y Z, et al. 2024. Vegetation greening and its response to a warmer and wetter climate in the Yellow River Basin from 2000 to 2020. Remote Sensing, 16(5): 790, doi: 10.3390/rs16050790.
[3]
Baldocchi D. 2008. 'Breathing' of the terrestrial biosphere: lessons learned from a global network of carbon dioxide flux measurement systems. Australian Journal of Botany, 56(1): 1-26.
doi: 10.1071/BT07151
[4]
Baldocchi D D, Black T A, Curtis P S, et al. 2005. Predicting the onset of net carbon uptake by deciduous forests with soil temperature and climate data: a synthesis of FLUXNET data. International Journal of Biometeorology, 49: 377-387.
pmid: 15688192
[5]
Bao X Y, Wen X F, Sun X M, et al. 2014. Interannual variation in carbon sequestration depends mainly on the carbon uptake period in two croplands on the North China Plain. PLoS ONE, 9(10): e110021, doi: 10.1371/journal.pone.0110021.
Campbell G S, Norman J M. 1998. An Introduction to Environmental Biophysics (2nd ed.). New York: Springer, 40-43.
[8]
Chen W N, Wang S, Niu S L. 2023. A dataset of carbon, water and heat fluxes of Zoige alpine meadow from 2015 to 2020. China Scientific Data, 8(2): 70-77. (in Chinese)
[9]
Chen Z Q, Wu L, Chen N C, et al. 2025. Modeling terrestrial net ecosystem exchange based on deep learning in China. Remote Sensing, 17(1): 92, doi: 10.3390/rs17010092.
[10]
Chu X J, Han G X, Zhu S Y, et al. 2016. Effect of environmental and biotic factors on net ecosystem CO2 exchange over a coastal wetland in the Yellow River Delta. Chinese Journal of Applied Ecology, 27(7): 2091-2100. (in Chinese)
[11]
Ciais P, Tan J, Wang X, et al. 2019. Five decades of northern land carbon uptake revealed by the interhemispheric CO2 gradient. Nature, 568: 221-225.
doi: 10.1038/s41586-019-1078-6
[12]
Cui L J, Kang X M, Li W, et al. 2017. Rewetting decreases carbon emissions from the Zoige alpine peatland on the Tibetan Plateau. Sustainability, 9(6): 948, doi: 10.3390/su9060948.
[13]
de Pue J, Wieneke S, Bastos A, et al. 2023. Temporal variability of observed and simulated gross primary productivity, modulated by vegetation state and hydrometeorological drivers. Biogeosciences, 20: 4795-4818.
doi: 10.5194/bg-20-4795-2023
[14]
Du Q, Liu H Z. 2013. Seven years of carbon dioxide exchange over a degraded grassland and a cropland with maize ecosystems in a semiarid area of China. Agriculture, Ecosystems and Environment, 173: 1-12.
doi: 10.1016/j.agee.2013.04.009
[15]
Du Y G, Pei W W, Zhou H K, et al. 2022. Net ecosystem exchange of carbon dioxide fluxes and its driving mechanism in the forests on the Tibetan Plateau. Biochemical Systematics and Ecology, 103: 104451, doi: 10.1016/j.bse.2022.104451.
[16]
Duursma R A, Kolari P, Perämäki M, et al. 2009. Contributions of climate, leaf area index and leaf physiology to variation in gross primary production of six coniferous forests across Europe: a model-based analysis. Tree Physiology, 29(5): 621-639.
doi: 10.1093/treephys/tpp010
pmid: 19324698
[17]
Feng X M, Fu B J, Piao S L, et al. 2016. Revegetation in China's Loess Plateau is approaching sustainable water resource limits. Nature Climate Change, 6: 1019-1022.
doi: 10.1038/nclimate3092
[18]
Foken T, Wichura B. 1996. Tools for quality assessment of surface-based flux measurements. Agricultural and Forest Meteorology, 78(1-2): 83-105.
doi: 10.1016/0168-1923(95)02248-1
[19]
Friedlingstein P, O'Sullivan M, Jones M W, et al. 2023. Global carbon budget 2023. Earth System Science Data, 15(12): 5301-5369.
doi: 10.5194/essd-15-5301-2023
[20]
Fu B J, Wang S, Liu Y, et al. 2017. Hydrogeomorphic ecosystem responses to natural and anthropogenic changes in the Loess Plateau of China. Annual Review of Earth and Planetary Sciences, 45: 223-243.
doi: 10.1146/earth.2017.45.issue-1
[21]
Gao Y F, Yi L B, Zhang F W, et al. 2022. The relationship between CO2 flux and vegetation leaf area index of four alpine grassland types in Qilian Mountains. Chinese Journal of Grassland, 44(5): 1-8. (in Chinese)
[22]
Grossiord C, Buckley T N, Cernusak L A, et al. 2020. Plant responses to rising vapor pressure deficit. New Phytologist, 226(6): 1550-1566.
doi: 10.1111/nph.16485
pmid: 32064613
[23]
Gu H S, Qiao Y X, Xi Z X, et al. 2022. Warming-induced increase in carbon uptake is linked to earlier spring phenology in temperate and boreal forests. Nature Communications, 13: 3698, doi: 10.1038/s41467-022-31496-w.
pmid: 35760820
[24]
Harris N L, Gibbs D A, Baccini A, et al. 2021. Global maps of twenty-first century forest carbon fluxes. Nature Climate Change, 11: 234-240.
doi: 10.1038/s41558-020-00976-6
[25]
He F Q, Li Q, Chen D D, et al. 2023. A dataset of carbon, water and heat fluxes over an Elymus nutans artificial grassland in the Sanjiangyuan Area (2012-2016). China Scientific Data, 8(4), doi: 10.11922/11-6035.csd.2023.0056.zh. (in Chinese)
[26]
Houghton R A, Baccini A, Walker W S. 2018. Where is the residual terrestrial carbon sink? Global Change Biology, 24(8): 3277-3279.
doi: 10.1111/gcb.14313
pmid: 29772099
[27]
Huang H, Zhou Y, Zhang J S, et al. 2023. A dataset of carbon and water flux observations in a Quercus variabilis plantation in Xiaolangdi (2016-2017). China Scientific Data, 8(4), doi: 10.11922/11-6035.csd.2023.0082.zh. (in Chinese)
[28]
Humphrey V, Berg A, Ciais P, et al. 2021. Soil moisture-atmosphere feedback dominates land carbon uptake variability. Nature, 592: 65-69.
doi: 10.1038/s41586-021-03325-5
[29]
Huxman T E, Smith M D, Fay P A, et al. 2004. Convergence across biomes to a common rain-use efficiency. Nature, 429(6992): 651-654.
doi: 10.1038/nature02561
[30]
IPCC Intergovernmental Panel on Climate Change. 2021. Climate Change 2021:The Physical Science Basis. Contribution of Working Group I to the Sixth Assessment Report of the Intergovernmental Panel on Climate Change. Cambridge and New York: Cambridge University Press, 4-5.
[31]
Jia Q Y, Yu W Y, Zhou L, et al. 2017. Atmospheric and surface-condition effects on CO2 exchange in the Liaohe Delta wetland, China. Water, 9(10): 806, doi: 10.3390/w9100806.
[32]
Jia X, Zha T S, Wu B, et al. 2014. Biophysical controls on net ecosystem CO2 exchange over a semiarid shrubland in Northwest China. Biogeosciences, 11(17): 4679-4693.
doi: 10.5194/bg-11-4679-2014
[33]
Kato T, Tang Y H, Gu S, et al. 2004. Carbon dioxide exchange between the atmosphere and an alpine meadow ecosystem on the Qinghai-Tibetan Plateau, China. Agricultural and Forest Meteorology, 124(1-2): 121-134.
doi: 10.1016/j.agrformet.2003.12.008
[34]
Koehler T, Wankmüller F J P, Sadok W, et al. 2023. Transpiration response to soil drying versus increasing vapor pressure deficit in crops: physical and physiological mechanisms and key plant traits. Journal of Experimental Botany, 74(16): 4789-4807.
doi: 10.1093/jxb/erad221
[35]
Kühnhammer K, van Haren J, Kübert A, et al. 2023. Deep roots mitigate drought impacts on tropical trees despite limited quantitative contribution to transpiration. Science of The Total Environment, 893: 164763, doi: 10.1016/j.scitotenv.2023.164763.
[36]
Lasslop G, Reichstein M, Papale D, et al. 2010. Separation of net ecosystem exchange into assimilation and respiration using a light response curve approach: critical issues and global evaluation. Global Change Biology, 16(1): 187-208.
doi: 10.1111/gcb.2010.16.issue-1
[37]
Li N, Shao J J, Zhou G Y, et al. 2022. Improving estimations of ecosystem respiration with asymmetric daytime and nighttime temperature sensitivity and relative humidity. Agricultural and Forest Meteorology, 312: 108709, doi: 10.1016/j.agrformet.2021.108709.
[38]
Liu F, Shen Y J, Cao J S, et al. 2023a. A dataset of water, heat, and carbon fluxes over the winter wheat-summer maize croplands in Luancheng during 2013-2017. China Scientific Data, 8(2), doi: 10.11922/11-6035.csd.2023.0031.zh. (in Chinese)
[39]
Liu P R, Tong X J, Zhang J S, et al. 2022. Effect of diffuse fraction on gross primary productivity and light use efficiency in a warm-temperate mixed plantation. Frontiers in Plant Science, 13: 966125, doi: 10.3389/fpls.2022.966125.
[40]
Liu X Y, Li X H, Gao L X, et al. 2023b. Early-season and refined mapping of winter wheat based on phenology algorithms—a case of Shandong, China. Frontiers in Plant Science, 14: 1016890, doi: 10.3389/fpls.2023.1016890.
[41]
Lu H B, Qin Z C, Lin S R, et al. 2022. Large influence of atmospheric vapor pressure deficit on ecosystem production efficiency. Nature Communications, 13: 1653, doi: 10.1038/s41467-022-29009-w.
pmid: 35351892
[42]
Mauder M, Foken T. 2004. Documentation and Instruction Manual of the Eddy Covariance Software Package TK2. Arbeitsergebnisse, No. 26. Bayreuth: University of Bayreuth, Department of Micrometeorology, 8-24.
[43]
Mei X R, Gao X, Sun D B, et al. 2023. An observation dataset of carbon fluxes of a rainfed spring maize cropland in Shouyang, Shan Xi (2012-2014). Science Data Bank, doi: 10.57760/sciencedb.07304. (in Chinese)
[44]
Mitsch W J, Bernal B, Nahlik A M, et al. 2013. Wetlands, carbon, and climate change. Landscape Ecology, 28: 583-597.
doi: 10.1007/s10980-012-9758-8
[45]
Moffat A M, Papale D, Reichstein M, et al. 2007. Comprehensive comparison of gap-filling techniques for eddy covariance net carbon fluxes. Agricultural and Forest Meteorology, 147(3-4): 209-232.
doi: 10.1016/j.agrformet.2007.08.011
[46]
Niu X D, Sun P S, Tao S R, et al. 2023. A dataset of carbon and water fluxes in a natural oak forest of Baotianman in Henan Province (2017-2018). China Scientific Data, doi: 10.11922/11-6035.csd.2023.0124.zh. (in Chinese)
[47]
Niu Y Y, Li Y Q, Wang X Y, et al. 2018. Characteristics of annual variation in net carbon dioxide flux in a sandy grassland ecosystem during dry years. Acta Prataculturae Sinica, 27(1): 215-221. (in Chinese)
[48]
Novick K A, Ficklin D L, Stoy P C, et al. 2016. The increasing importance of atmospheric demand for ecosystem water and carbon fluxes. Nature Climate Change, 6: 1023-1027.
doi: 10.1038/nclimate3114
[49]
Pan Y D, Birdsey R A, Fang J Y, et al. 2011. A large and persistent carbon sink in the world’s forests. Science, 333(6045): 988-993.
doi: 10.1126/science.1201609
[50]
Pan Y D, Birdsey R A, Phillips O L, et al. 2024. The enduring world forest carbon sink. Nature, 631: 563-569.
doi: 10.1038/s41586-024-07602-x
[51]
Papale D, Reichstein M, Aubinet M, et al. 2006. Towards a standardized processing of net ecosystem exchange measured with eddy covariance technique: algorithms and uncertainty estimation. Biogeosciences, 3(4): 571-583.
doi: 10.5194/bg-3-571-2006
[52]
Pedregosa F, Varoquaux G, Gramfort A, et al. 2011. Scikit-learn: machine learning in Python. Journal of Machine Learning Research, 12: 2825-2830.
[53]
Piao S L, Fang J Y, Ciais P, et al. 2009. The carbon balance of terrestrial ecosystems in China. Nature, 458: 1009-1013.
doi: 10.1038/nature07944
[54]
Poulter B, Frank D, Ciais P, et al. 2014. Contribution of semi-arid ecosystems to interannual variability of the global carbon cycle. Nature, 509: 600-603.
doi: 10.1038/nature13376
[55]
Qiao B Y, Sheng L L, Chen K L, et al. 2025. Net ecosystem exchanges of spruce forest carbon dioxide fluxes in two consecutive years in Qilian Mountains. Applied Sciences, 15(12): 6845, doi: 10.3390/app15126845.
[56]
Ren T J, Cai A D. 2025. Global patterns and drivers of soil dissolved organic carbon concentrations. Earth System Science Data, 17(6): 2873-2885.
doi: 10.5194/essd-17-2873-2025
[57]
Smith P, Martino D, Cai Z C, et al. 2008. Greenhouse gas mitigation in agriculture. Philosophical Transactions of the Royal Society B: Biological Sciences, 363(1492): 789-813.
doi: 10.1098/rstb.2007.2184
[58]
Song J X, Zhou L, Zhou G S, et al. 2023. A dataset of carbon and water fluxes of the temperate desert steppe in Damao Banner, Inner Mongolia (2015-2018). China Scientific Data, 8(2), doi: 10.11922/11-6035.csd.2023.0021.zh. (in Chinese)
[59]
Sun S C, Shao M A, Gao H B. 2016. Energy and CO2 exchanges and influencing factors in spring wheat ecosystem along the Heihe River, northwestern China. Journal of Earth System Science, 125(8): 1667-1679.
doi: 10.1007/s12040-016-0750-6
[60]
Sun X P, Xiao Y, Wang J H, et al. 2024. The respective effects of vapor pressure deficit and soil moisture on ecosystem productivity in Southwest China. Remote Sensing, 16(8): 1316, doi: 10.3390/rs16081316.
[61]
Tang X L, Zhao X, Bai Y F, et al. 2018. Carbon pools in China's terrestrial ecosystems: new estimates based on an intensive field survey. Proceedings of the National Academy of Sciences of the United States of America, 115(16): 4021-4026.
[62]
Tao F L, Li Y B, Chen Y, et al. 2022. Daily, seasonal and inter-annual variations in CO2 fluxes and carbon budget in a winter-wheat and summer-maize rotation system in the North China Plain. Agricultural and Forest Meteorology, 324: 109098, doi: 10.1016/j.agrformet.2022.109098.
[63]
Wang J T, Zhong Q C, Ou Q, et al. 2015a. Characteristic of CO2 flux in the coastal reclaimed wetland of Chongming Dongtan during the growing season. Resources and Environment in the Yangtze Basin, 24(3): 416-425. (in Chinese)
[64]
Wang L J, Zhao M L, Nie M, et al. 2025a. Thresholds of wetland carbon sink regulation by water level. Environmental Science & Technology, 59(27): 13811-13819.
doi: 10.1021/acs.est.5c03410
[65]
Wang W Y, Guo J X, Wang Y S, et al. 2015b. Observing characteristics of CO2 flux and its influencing factors over Xilinhot grassland. Journal of the Meteorological Sciences, 35(1): 100-107. (in Chinese)
[66]
Wang X F, Ma M G, Huang G H, et al. 2012. Vegetation primary production estimation at maize and alpine meadow over the Heihe River Basin, China. International Journal of Applied Earth Observation and Geoinformation, 17: 94-101.
doi: 10.1016/j.jag.2011.09.009
[67]
Wang X F, Che T, Xiao J F, et al. 2025b. A post-processed carbon flux dataset for 34 eddy covariance flux sites across the Heihe River Basin, China. Earth System Science Data, 17(4): 1329-1346.
doi: 10.5194/essd-17-1329-2025
[68]
Wang Y Y, Hu C S, Dong W X, et al. 2015c. Carbon budget of a winter-wheat and summer-maize rotation cropland in the North China Plain. Agriculture, Ecosystems and Environment, 206: 33-45.
doi: 10.1016/j.agee.2015.03.016
[69]
Wang Z Q, Fang F R, Zhou L, et al. 2024. A dataset of meteorological observations at the National Field Scientific Observation and Research Station of Farmland Ecosystem in Changwu County, Shaanxi Province (2005-2019). China Scientific Data, 9(3), doi: 10.11922/11-6035.csd.2024.0053.zh. (in Chinese)
[70]
Webb E K, Pearman G I, Leuning R. 1980. Correction of flux measurements for density effects due to heat and water vapour transfer. Quarterly Journal of the Royal Meteorological Society, 106(447): 85-100.
doi: 10.1002/qj.v106:447
[71]
Wei J Q, Li X Y, Liu L, et al. 2022. Radiation, soil water content, and temperature effects on carbon cycling in an alpine swamp meadow of the northeastern Qinghai-Tibetan Plateau. Biogeosciences, 19(3): 861-875.
doi: 10.5194/bg-19-861-2022
[72]
Xia H Y, Jiang H L, Zhang C H, et al. 2024. Light saturation and temperature jointly dominate the diurnal variation of net ecosystem exchange in grassland ecosystems. Ecological Indicators, 168: 112737, doi: 10.1016/j.ecolind.2024.112737.
[73]
Xu Y F, Ji H, Han J G, et al. 2018. Variation of net ecosystem carbon flux in growing season and its driving factors in a poplar plantation from Hung-tse Lake wetland. Chinese Journal of Ecology, 37(2): 322-331. (in Chinese)
[74]
Yan Y J, Zhou L, Zhou G S, et al. 2023. Extreme temperature events reduced carbon uptake of a boreal forest ecosystem in Northeast China: evidence from an 11-year eddy covariance observation. Frontiers in Plant Science, 14: 1119670, doi: 10.3389/fpls.2023.1119670.
[75]
Yang P, Wang N A, Zhao L Q, et al. 2022. Responses of grassland ecosystem carbon fluxes to precipitation and their environmental factors in the Badain Jaran Desert. Environmental Science and Pollution Research, 29: 75805-75821.
doi: 10.1007/s11356-022-21098-w
[76]
Yang T W, Sun J J, Li Y F, et al. 2025. Impact of climate-induced water-table drawdown on carbon and nitrogen sequestration in a Kobresia-dominated peatland on the central Qinghai-Tibetan Plateau. Communications Earth & Environment, 6: 188, doi: 10.1038/s43247-025-02168-6.
[77]
Yuan R R, Huang X L, Hao L. 2021. Spatio-temporal variation of vapor pressure deficit and impact factors in China in the past 40 years. Climatic and Environmental Research, 26(4): 413-424. (in Chinese)
[78]
Zhang F W, Li H Q, Zhao L, et al. 2021a. An observation dataset of carbon, water and heat fluxes in an alpine wetland in Haibei (2004-2009). China Scientific Data, 6(1), doi: 10.11922/csdata.2020.0033.zh. (in Chinese)
[79]
Zhang F W, Li H Q, Zhao L, et al. 2021b. An observation dataset of carbon, water and heat fluxes over an alpine shrubland in Haibei (2003-2010). China Scientific Data, 6(1), doi: 10.11922/csdata.2020.0034.zh. (in Chinese)
[80]
Zhang F W, Li H Q, Zhang L M, et al. 2023a. A dataset of the observations of carbon, water and heat fluxes over an alpine shrubland in Haibei (2011-2020). China Scientific Data, 8(2), doi: 10.11922/11-6035.csd.2023.0013.zh. (in Chinese)
[81]
Zhang F W, Si M K, Guo X W, et al. 2023b. A dataset of the observations of carbon, water and heat fluxes over an alpine meadow in Haibei (2015-2020). China Scientific Data, 8(2), doi: 10.11922/11-6035.csd.2023.0012.zh. (in Chinese)
[82]
Zhang H, Zhao T H, Lü S D, et al. 2021c. Interannual variability in net ecosystem carbon production in a rain-fed maize ecosystem and its climatic and biotic controls during 2005-2018. PLoS One, 16(5): e0237684, doi: 10.1371/journal.pone.0237684.
[83]
Zhang J, Chen H, Wang M, et al. 2024. An optimized water table depth detected for mitigating global warming potential of greenhouse gas emissions in wetland of Qinghai-Tibetan Plateau. iScience, 27(2): 108856, doi: 10.1016/j.isci.2024.108856.
[84]
Zhang K, Wang Y, Mamtimin A, et al. 2023c. Temporal and spatial variations in carbon flux and their influencing mechanisms on the Middle Tien Shan region grassland ecosystem, China. Remote Sensing, 15(16): 4091, doi: 10.3390/rs15164091.
[85]
Zhang Q, Lei H M, Yang D W, et al. 2020. Decadal variation in CO2 fluxes and its budget in a wheat and maize rotation cropland over the North China Plain. Biogeosciences, 17(8): 2245-2262.
doi: 10.5194/bg-17-2245-2020
[86]
Zhang W G, Tian J J, Zhang X H, et al. 2023d. Which land cover product provides the most accurate land use land cover map of the Yellow River Basin? Frontiers in Ecology and Evolution, 11: 1275054, doi: 10.3389/fevo.2023.1275054.
[87]
Zhang X J, Wang G Q, Xue B L, et al. 2021d. Dynamic landscapes and the driving forces in the Yellow River Delta wetland region in the past four decades. Science of The Total Environment, 787: 147644, doi: 10.1016/j.scitotenv.2021.147644.
[88]
Zhang Y C, Guo X N, Pei H W, et al. 2022. Evapotranspiration and carbon exchange of the main agroecosystems and their responses to agricultural land use change in North China Plain. Agriculture, Ecosystems & Environment, 338: 108103, doi: 10.1016/j.agee.2022.108103.
[89]
Zhao F H, Li F D, Zhan C S, et al. 2021. A carbon and water fluxes dataset of the farmland ecosystem of winter wheat and summer maize in Yucheng (2003-2010). China Scientific Data, 6(2), doi: 10.11922/csdata.2020.0044.zh. (in Chinese)
[90]
Zhao L, Li J, Xu S, et al. 2010. Seasonal variations in carbon dioxide exchange in an alpine wetland meadow on the Qinghai-Tibetan Plateau. Biogeosciences, 7(4): 1207-1221.
doi: 10.5194/bg-7-1207-2010
[91]
Zhao M L, Li P G, Song W M, et al. 2023. Inundation depth stimulates plant-mediated CH4 emissions by increasing ecosystem carbon uptake and plant height in an estuarine wetland. Functional Ecology, 37(3): 536-550.
doi: 10.1111/fec.v37.3
[92]
Zhu X J, Fan R X, Chen Z, et al. 2022. Eddy covariance-based differences in net ecosystem productivity values and spatial patterns between naturally regenerating forests and planted forests in China. Scientific Reports, 12: 20556, doi: 10.1038/s41598-022-25025-4.