Enhanced InVEST modeling reveals divergent trajectories of carbon storage in the eastern Qinghai-Xizang Plateau during 1990-2100
HUANG Kepan1, XU Haojie1,2,*(), LIU Zhifei1, WANG Dawei1
1State Key Laboratory of Herbage Improvement and Grassland Agro-ecosystems/Key Laboratory of Grassland Livestock Industry Innovation, Ministry of Agriculture and Rural Affairs/Engineering Research Center of Grassland Industry, Ministry of Education; College of Pastoral Agriculture Science and Technology, Lanzhou University, Lanzhou 730020, China 2Center for Remote Sensing of Ecological Environments in Cold and Arid Regions, Lanzhou University, Lanzhou 730000, China
As a critical ecological barrier and carbon reservoir on the eastern Qinghai-Xizang Plateau, the Qilian Mountains (QLMs) play a vital role in maintaining regional ecological security. This study employed an enhanced Integrated Valuation of Ecosystem Services and Trade-offs (InVEST) model with dynamic interannual carbon density parameterization to evaluate carbon storage (CS) variations in the QLMs during the historical period of 1990-2020 and future period of 2030-2100 under climate scenarios (SSP126, SSP245, and SSP585, where SSP is the Shared Socio-economic Pathway). By integrating GeoDetector analysis, random forest modeling, and scenario simulations, we further assessed climate-human interactions and their impacts on CS. The QLMs had a multi-year average CS of 1.49×10⁹ t during 1990-2020, with higher values in the southeast and lower values in the northwest. The spatial heterogeneity of CS was primarily driven by warming-wetting climatic gradients. Multi-scenario projections revealed divergent trajectories: under the SSP126 scenario, ecological restoration measures (e.g., mountain closure and afforestation) increased CS, whereas CS under SSP245 and SSP585 scenarios exhibited inverted U-shaped patterns. Notably, SSP585 resulted in 8.00×10⁷ t losses due to extensive conversions from grassland to urban area during 2050-2100. Grassland and cropland CS, together with precipitation, emerged as the key determinants of regional CS dynamics, with a synergistic interaction between precipitation and temperature. This study introduced a century-scale, multi-scenario framework that captures temporal interactions and dynamically parameterizes carbon density coefficients for era-specific accuracy. The findings suggest optimizing vegetation coverage, managing urban expansion, and implementing climate adaptation strategies to enhance the total CS of this ecologically sensitive region.
Received: 16 October 2025
Published: 31 August 2026
HUANG Kepan, XU Haojie, LIU Zhifei, WANG Dawei. Enhanced InVEST modeling reveals divergent trajectories of carbon storage in the eastern Qinghai-Xizang Plateau during 1990-2100. Journal of Arid Land, 2026, 18(8): 1283-1303.
Fig. 1Elevation distribution of the Qilian Mountains (QLMs). The elevation data are sourced from the Resource and Environmental Science Data Platform (https://www.resdc.cn/data.aspx?DATAID=123).
Data type
Unit
Spatial resolution
Time period
Data source
Land use and land cover (LULC)
-
300 m
1990-2020
ESA CCI Land Cover (http://www.esa-landcover-cci.org/)
1 km
2030-2100
Zhang et al. (2023) (https://doi.org/10.6084/m9.figshare.23542860)
Net primary productivity (NPP)
g C/m2
5 km
1982-2018
National Earth System Science Data Center (https://www.glass.hku.hk/download.html)
Forest aboveground biomass (AGB)
Mg/hm2
30 m
1985-2023
Cai et al. (2025) (https://code.earthengine.google.com/4f8ad8d32ddb84e826e941a95f31f9be)
Soil organic carbon density (SOCD)
kg C/m2
250 m
2010-2018
National Tibetan Plateau Scientific Data Center (https://cstr.cn/18406.11.Terre.tpdc.272482)
Precipitation (PRE)
mm
1 km
1990-2020
Resource and Environmental Science Data Platform (https://www.resdc.cn/data.aspx?DATAID=379)
1 km
2030-2100
National Tibetan Plateau Scientific Data Center (https://data.tpdc.ac.cn/zh-hans/data/90a7b4b6-4009-463a-b34f-e8ebd0238617)
Mean annual temperature (MAT)
°C
1 km
1990-2020
Resource and Environmental Science Data Platform (https://www.resdc.cn/data.aspx?DATAID=379)
1 km
2030-2100
National Tibetan Plateau Scientific Data Center (https://data.tpdc.ac.cn/zh-hans/data/169d91c0-c38f-4253-84ae-03f3e18ba643)
Sunshine duration (SSD)
h
1 km
1990-2020
Resource and Environmental Science Data Platform (https://www.resdc.cn/data.aspx?DATAID=379)
Population density (PD)
persons/km2
1 km
1990-2020
Resource and Environmental Science Data Platform (https://www.resdc.cn/DOI/DOI.aspx?DDOII=32)
Gross domestic product (GDP)
104 CNY/km2
1 km
1990-2020
Resource and Environmental Science Data Platform (https://www.resdc.cn/DOI/DOI.aspx?DOIID=33)
Grazing intensity (GI)
SU/hm2
250 m
1990-2020
National Ecosystem Science Data Center (https://www.nesdc.org.cn/sdo/detail?id=672aea607e28174998e63234)
Table 1 Description of the data used in this study
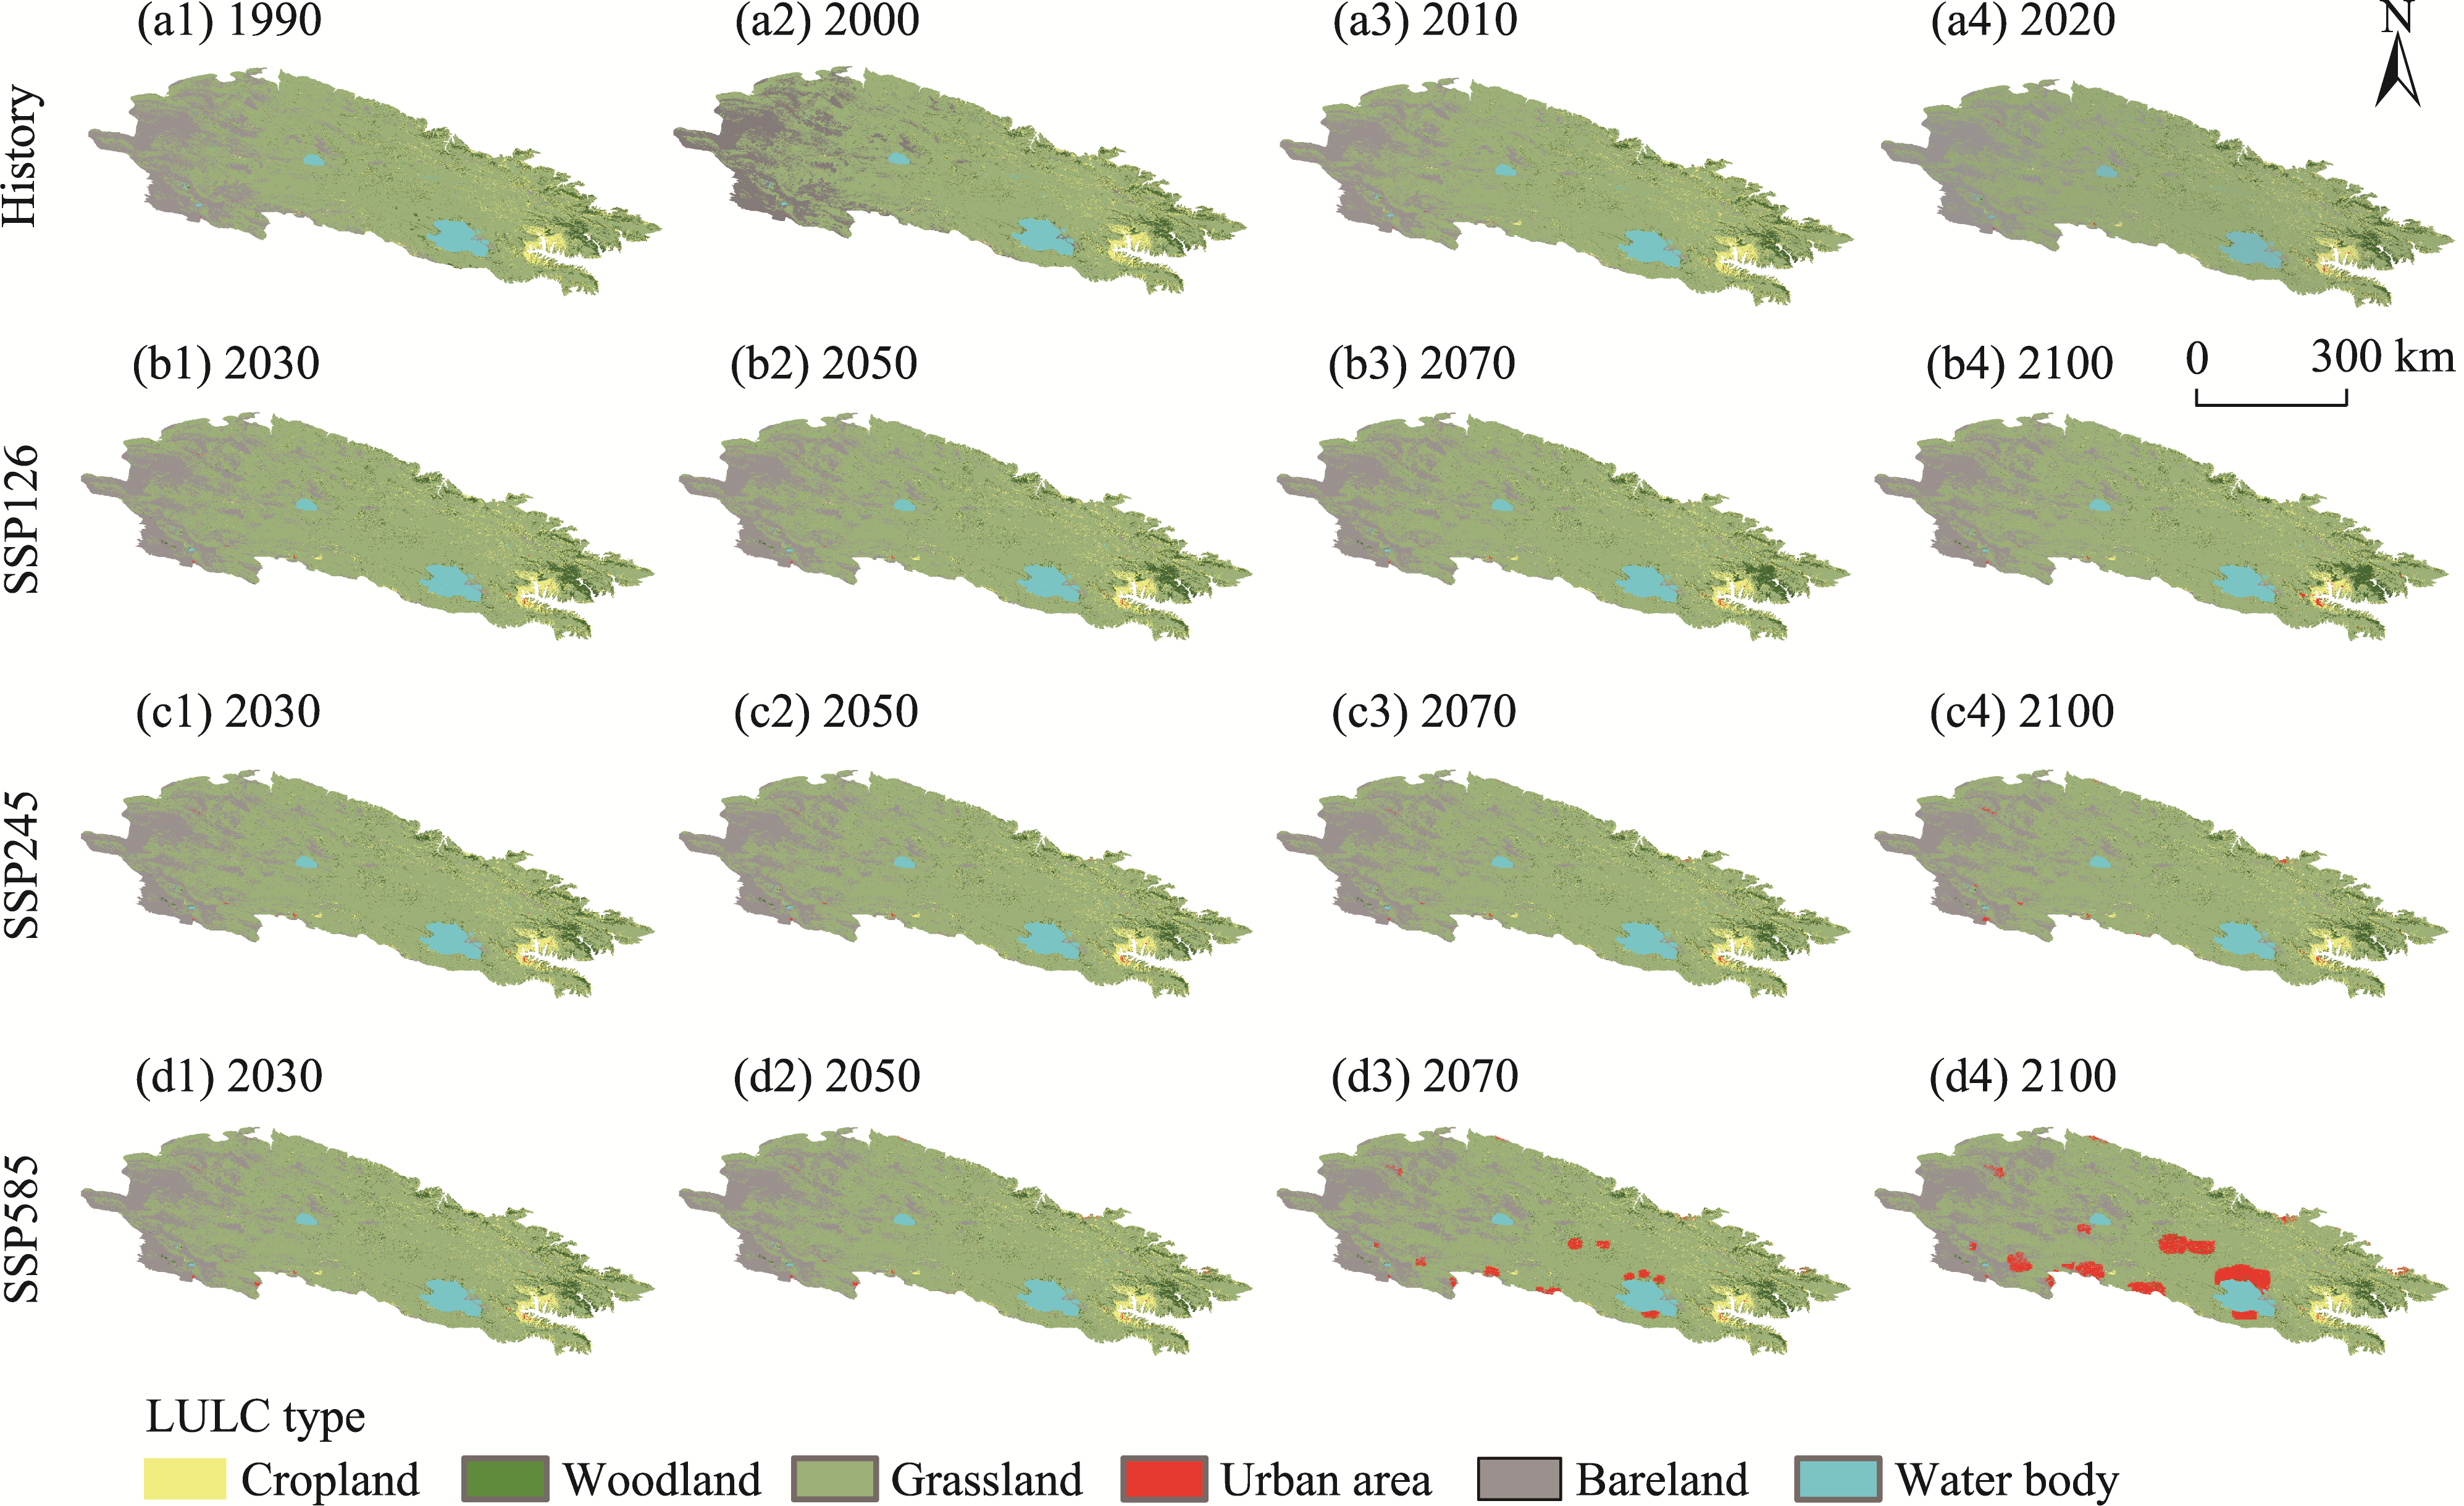
Fig. 2Spatial distribution of land use and land cover (LULC) types during the historical period of 1990-2020 (a1-a4) and future period of 2030-2100 under SSP126 (b1-b4), SSP245 (c1-c4), and SSP585 (d1-d4) scenarios. SSP, Shared Socio-economic Pathway.
Fig. 3String plot of LULC types transfer during the historical period of 1990-2020 (a) and future period of 2030-2100 under SSP126 (b), SSP245 (c), and SSP585 (d) scenarios
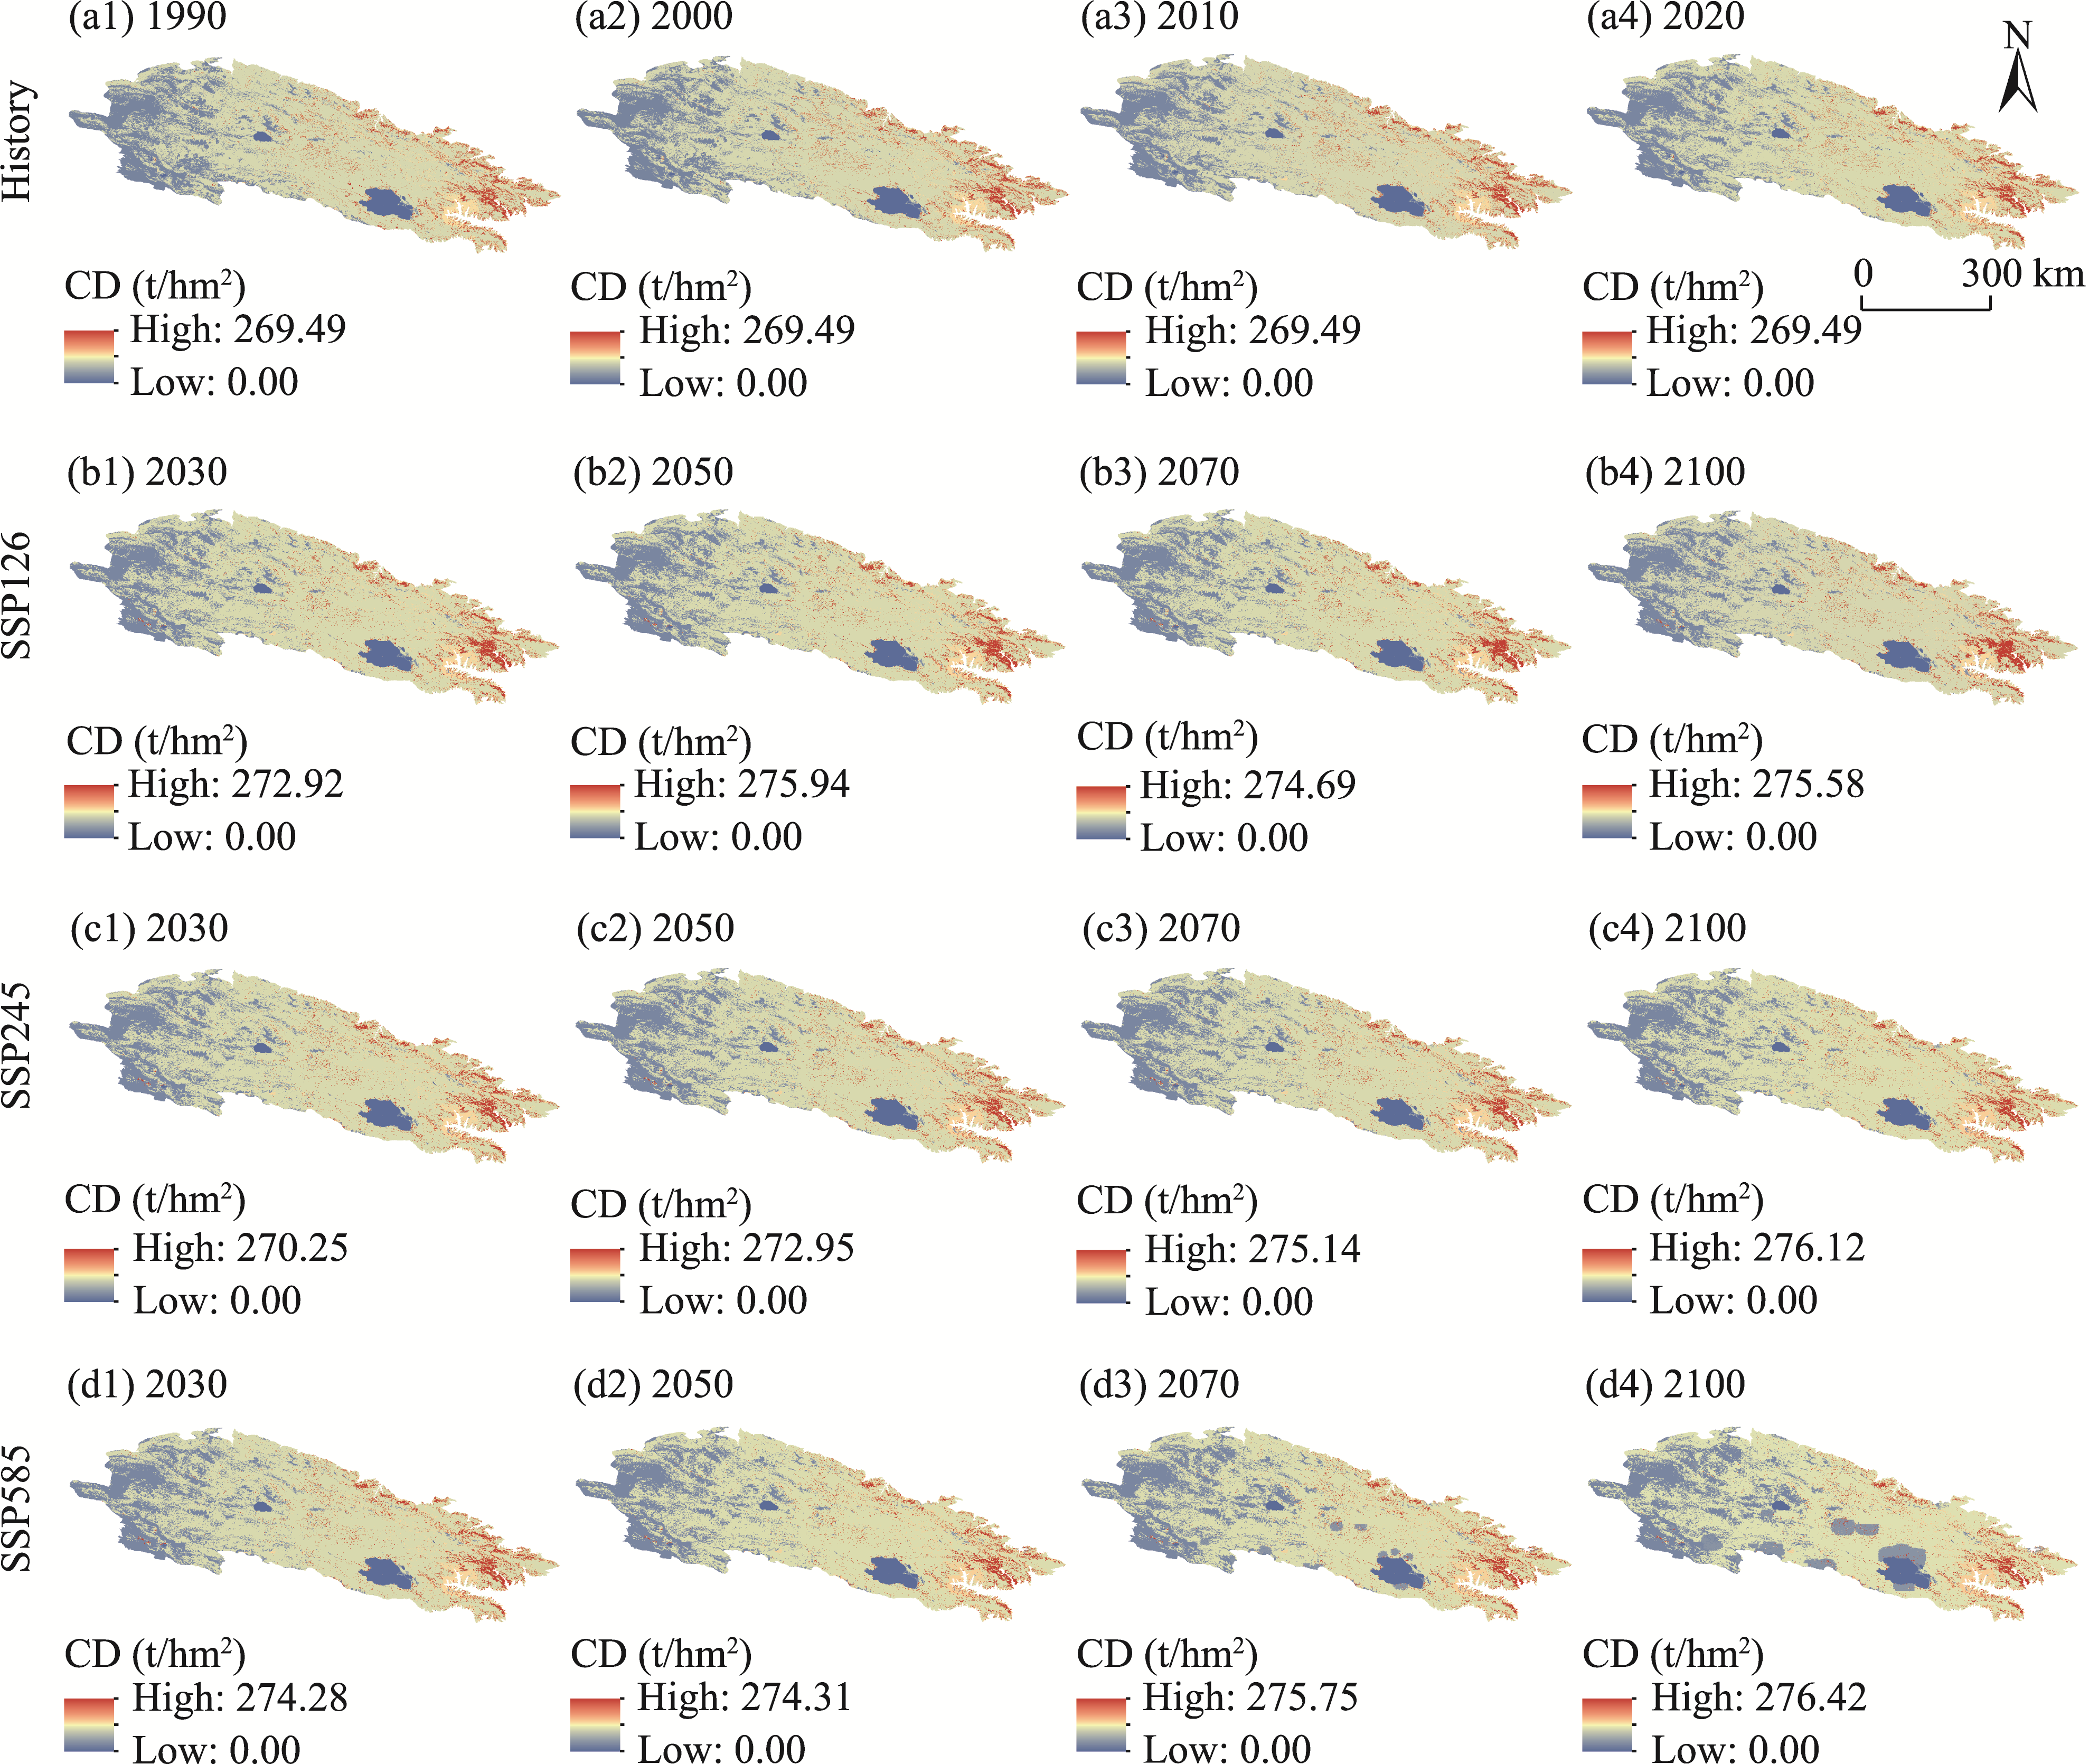
Fig. 4Spatial distribution of carbon density (CD) during the historical period of 1990-2020 (a1-a4) and future period of 2030-2100 under SSP126 (b1-b4), SSP245 (c1-c4), and SSP585 (d1-d4) scenarios
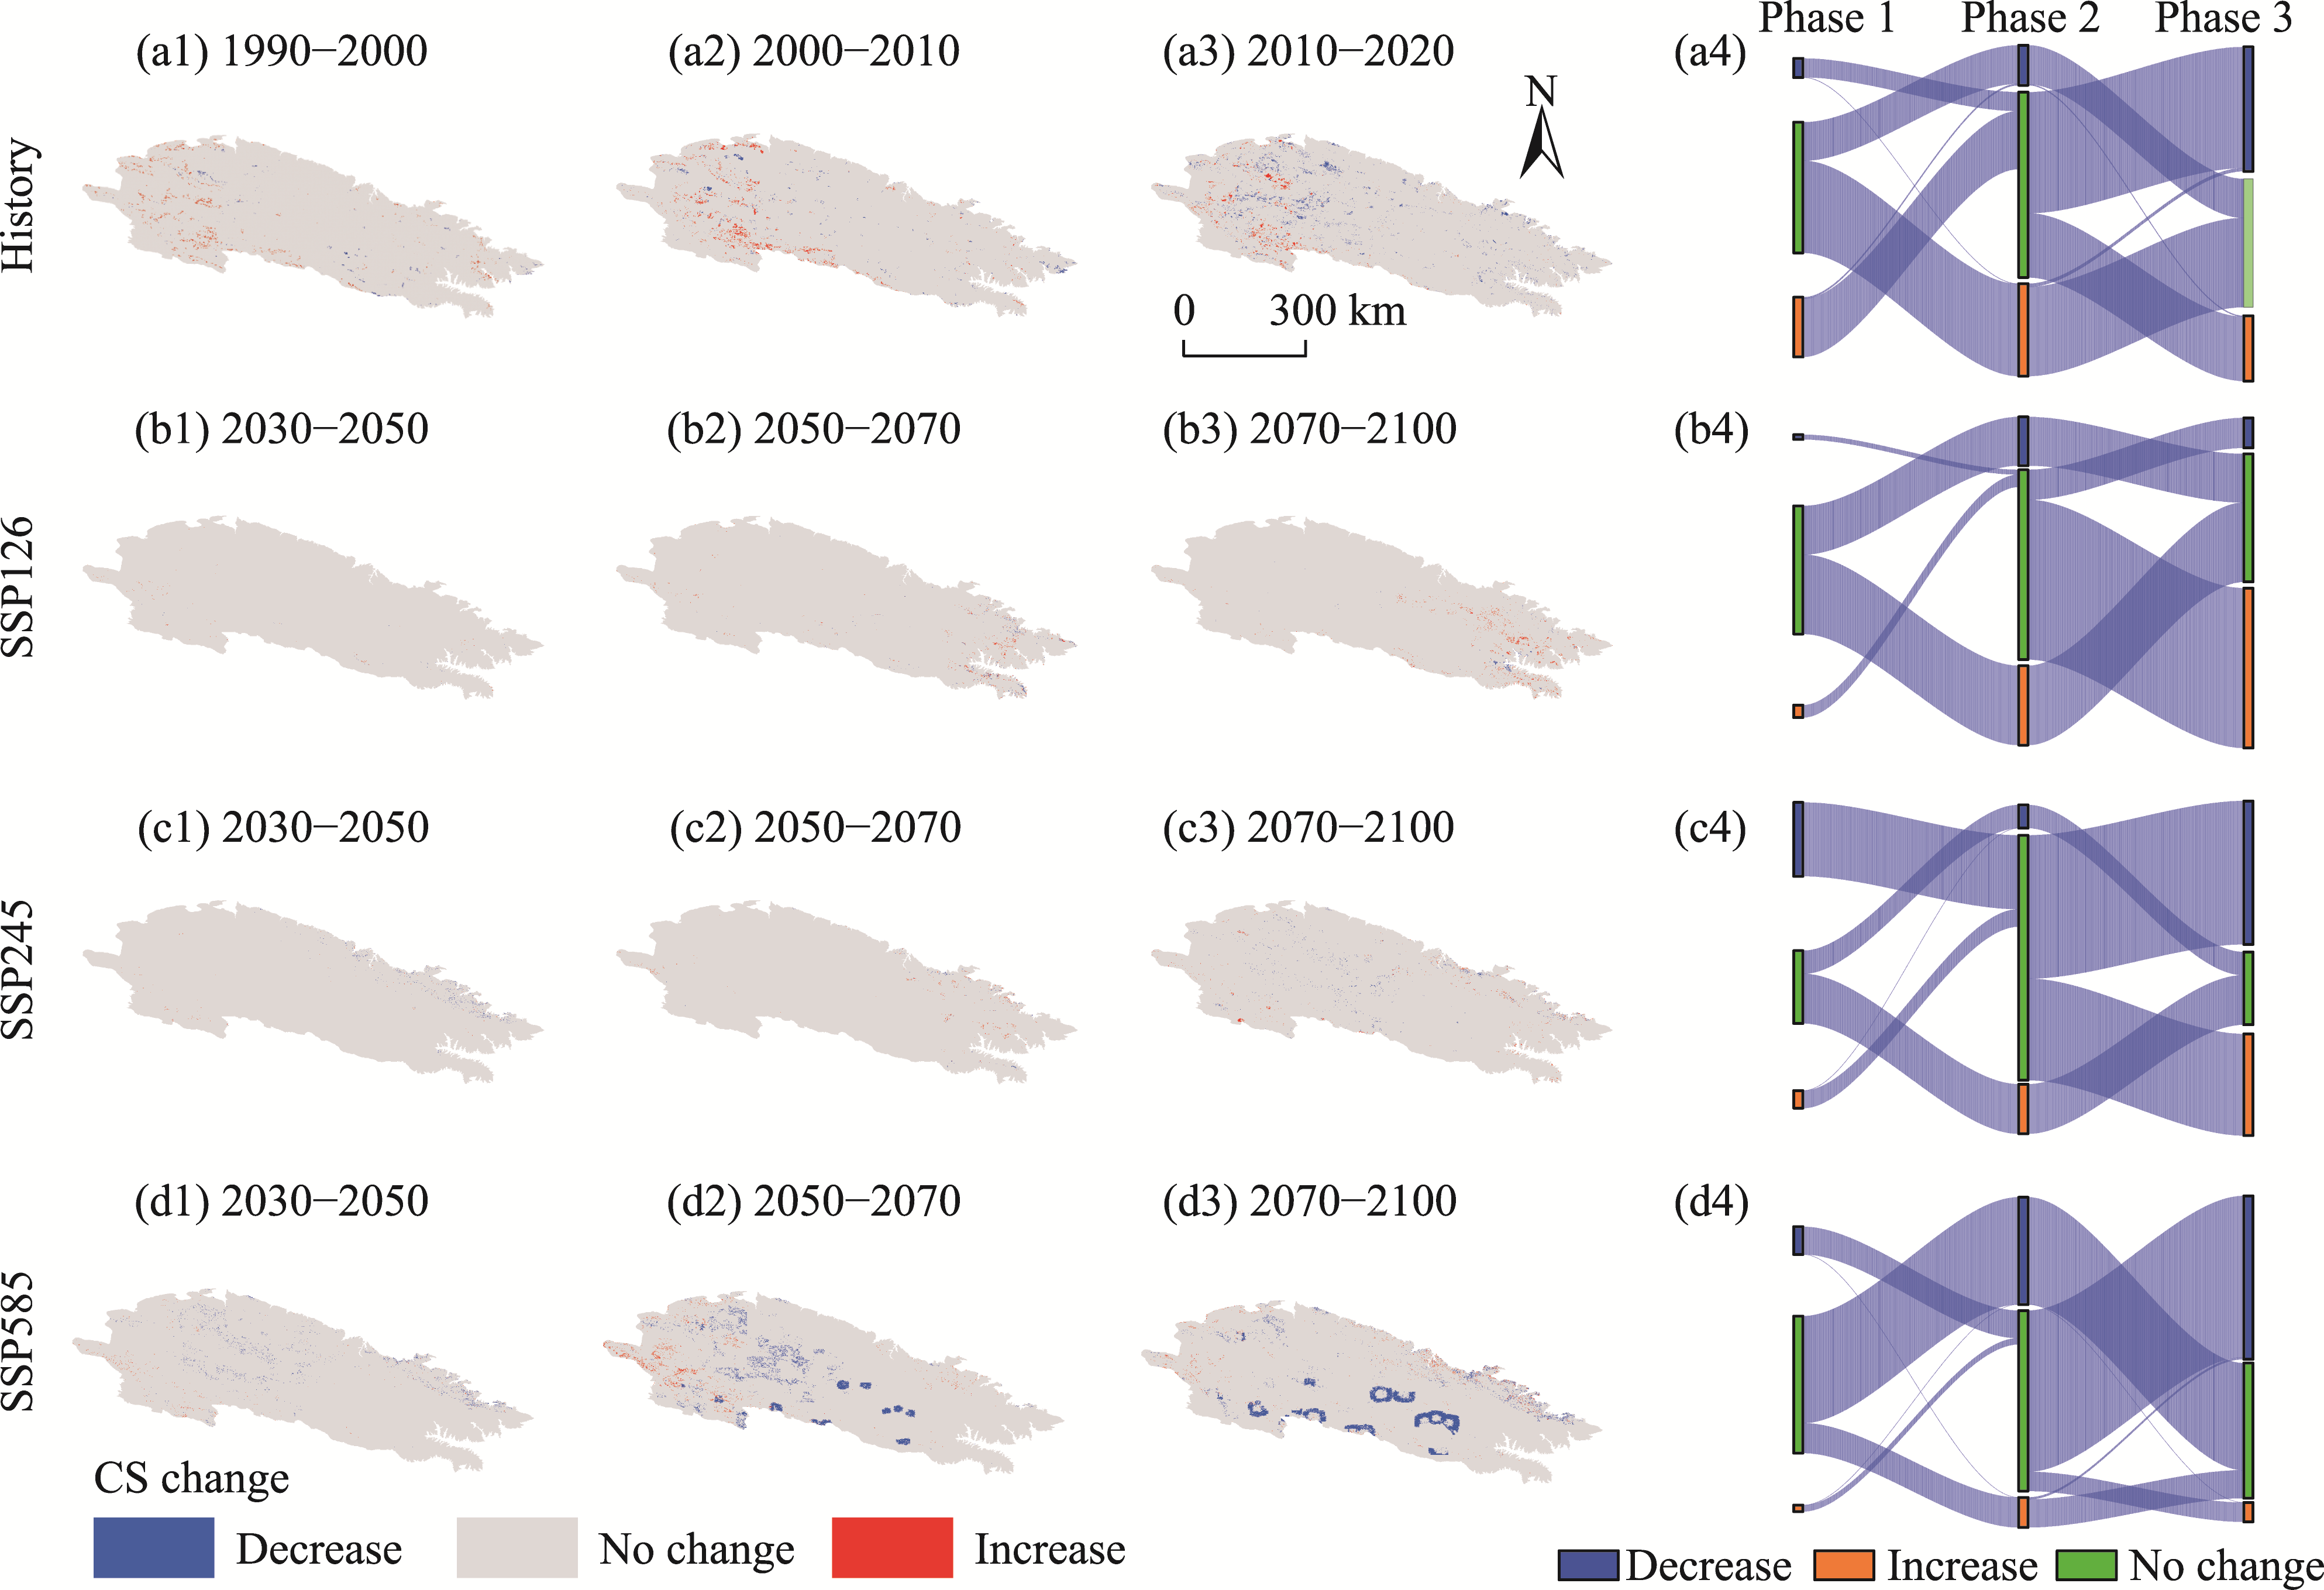
Fig. 5Spatial variations and transfer matrices of terrestrial carbon storage (CS) during the historical period of 1990-2020 (a1-a4) and future period of 2030-2100 under SSP126 (b1-b4), SSP245 (c1-c4), and SSP585 (d1-d4) scenarios. The historical period is subdivided into three phases: 1990-2000, 2000-2010, and 2010-2020. The future period is subdivided into three phases: 2030-2050, 2050-2070, and 2070-2100.
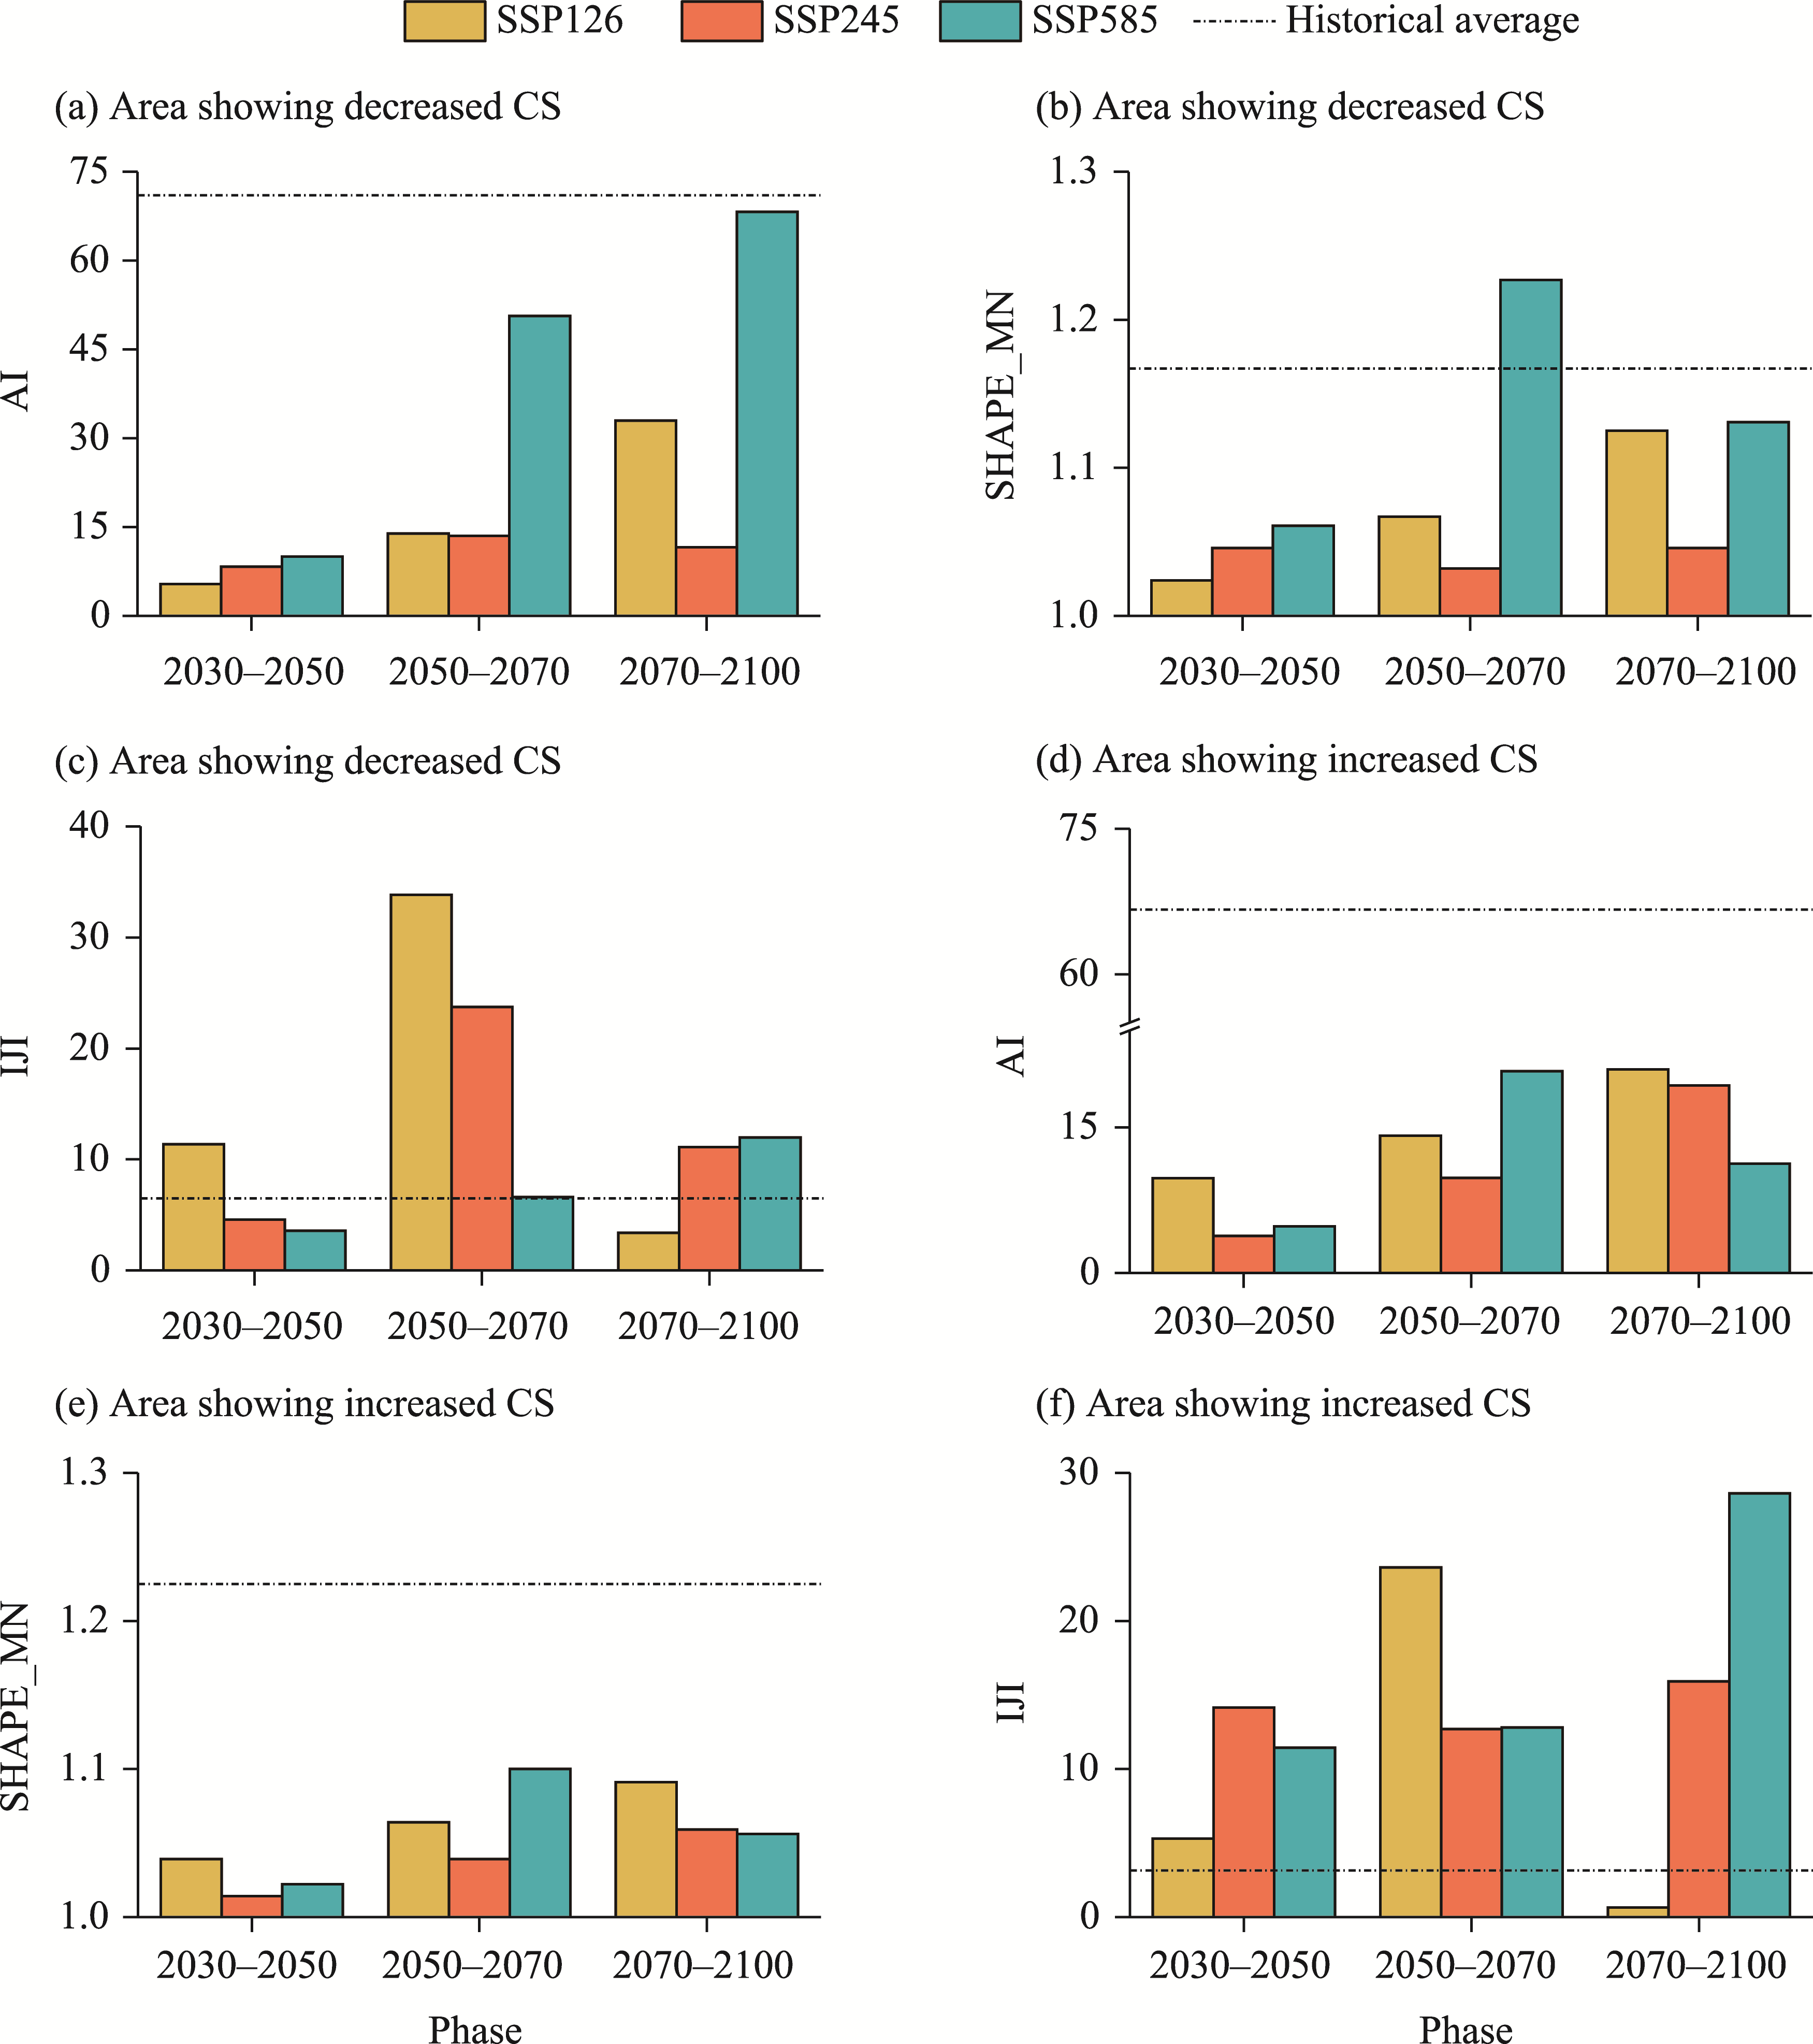
Fig. 6Landscape indices of the Aggregation Index (AI), Mean Shape Index (SHAPE_MN), and Interspersion and Juxtaposition Index (IJI) for areas showing decreased CS (a-c) and increased CS (d-f) during the historical period of 1990-2020 and future period of 2030-2100 under SSP126, SSP245, and SSP585 scenarios. The future period is subdivided into three phases: 2030-2050, 2050-2070, and 2070-2100.
Fig. 7Results of factor detection (a) and interaction detection (b) of factors influencing terrestrial CS. PRE, precipitation; SSD, sunshine duration; PD, population density; GI, grazing intensity; GDP, gross domestic product; MAT, mean annual temperature. The q value indicates the factor's explanatory power for terrestrial CS. * and ** denote the statistical significance at the 95.00% and 99.00% confidence levels, respectively.
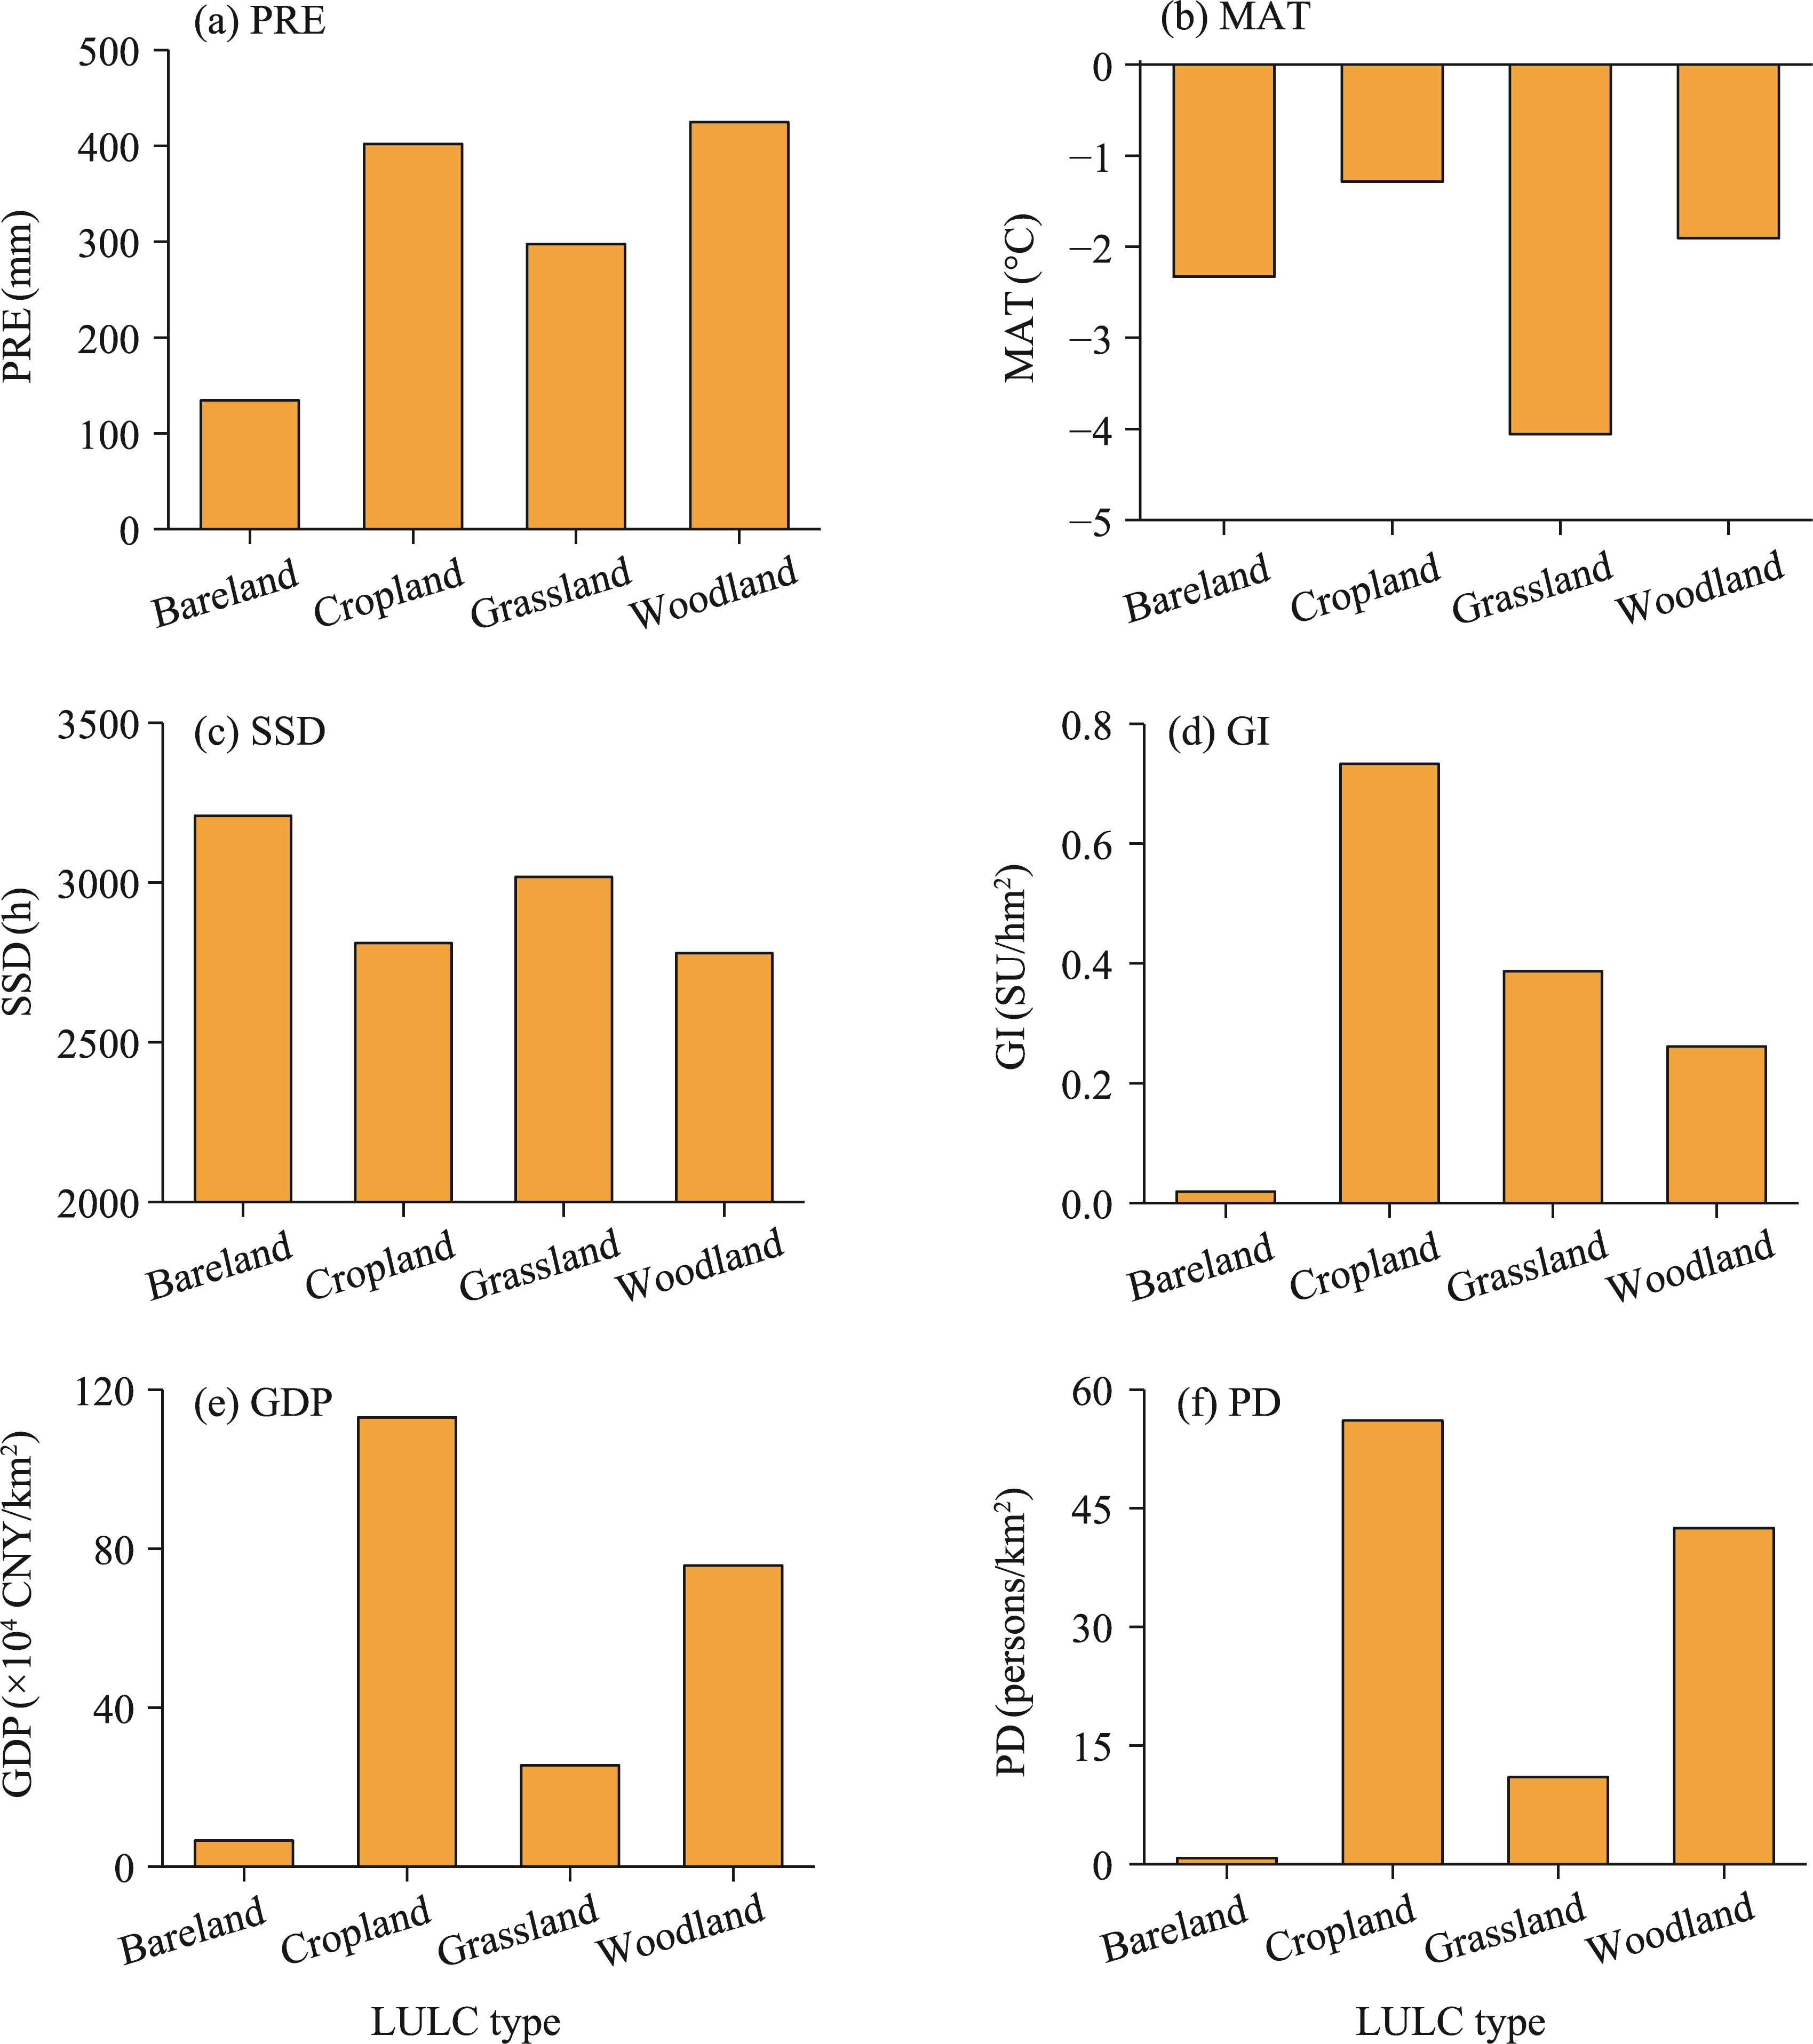
Fig. 8Multi-year average values of climatic (a-c) and anthropogenic (d-f) factors during 1990-2020 under different LULC types
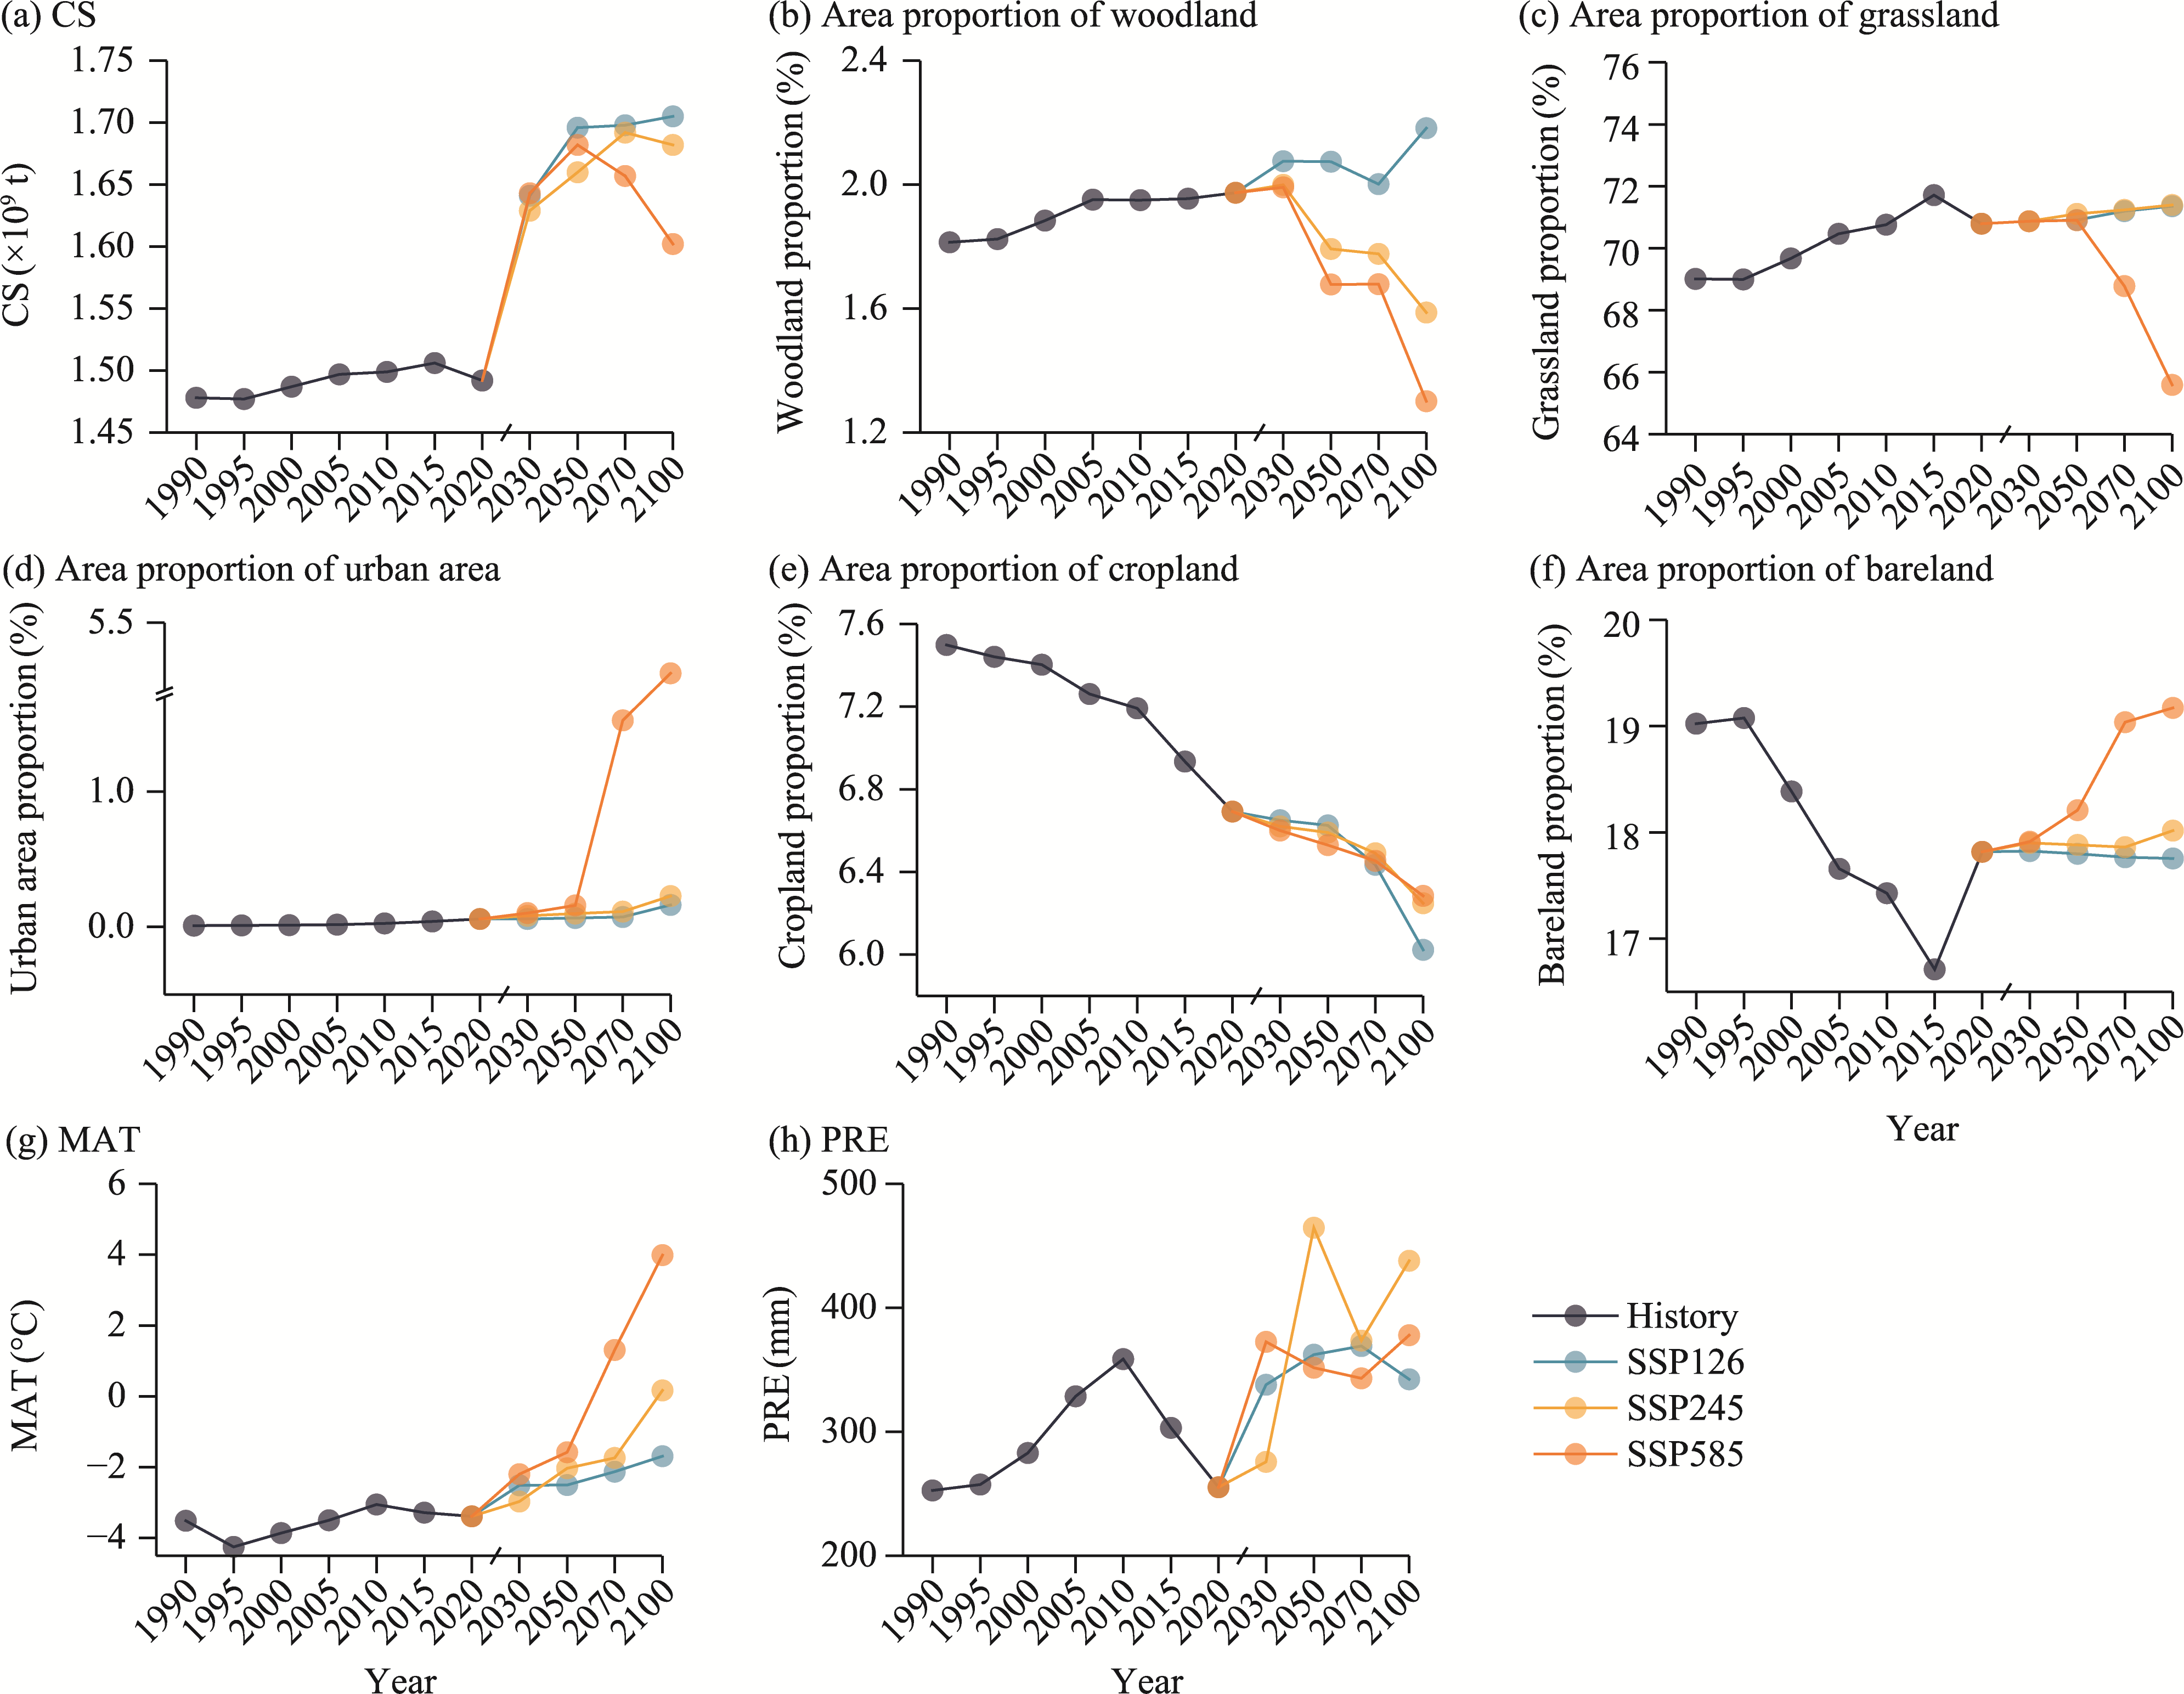
Fig. 9Temporal variations in terrestrial CS (a), area proportions of different LULC types (b-f), MAT (g), and PRE (h) from 1990 to 2100
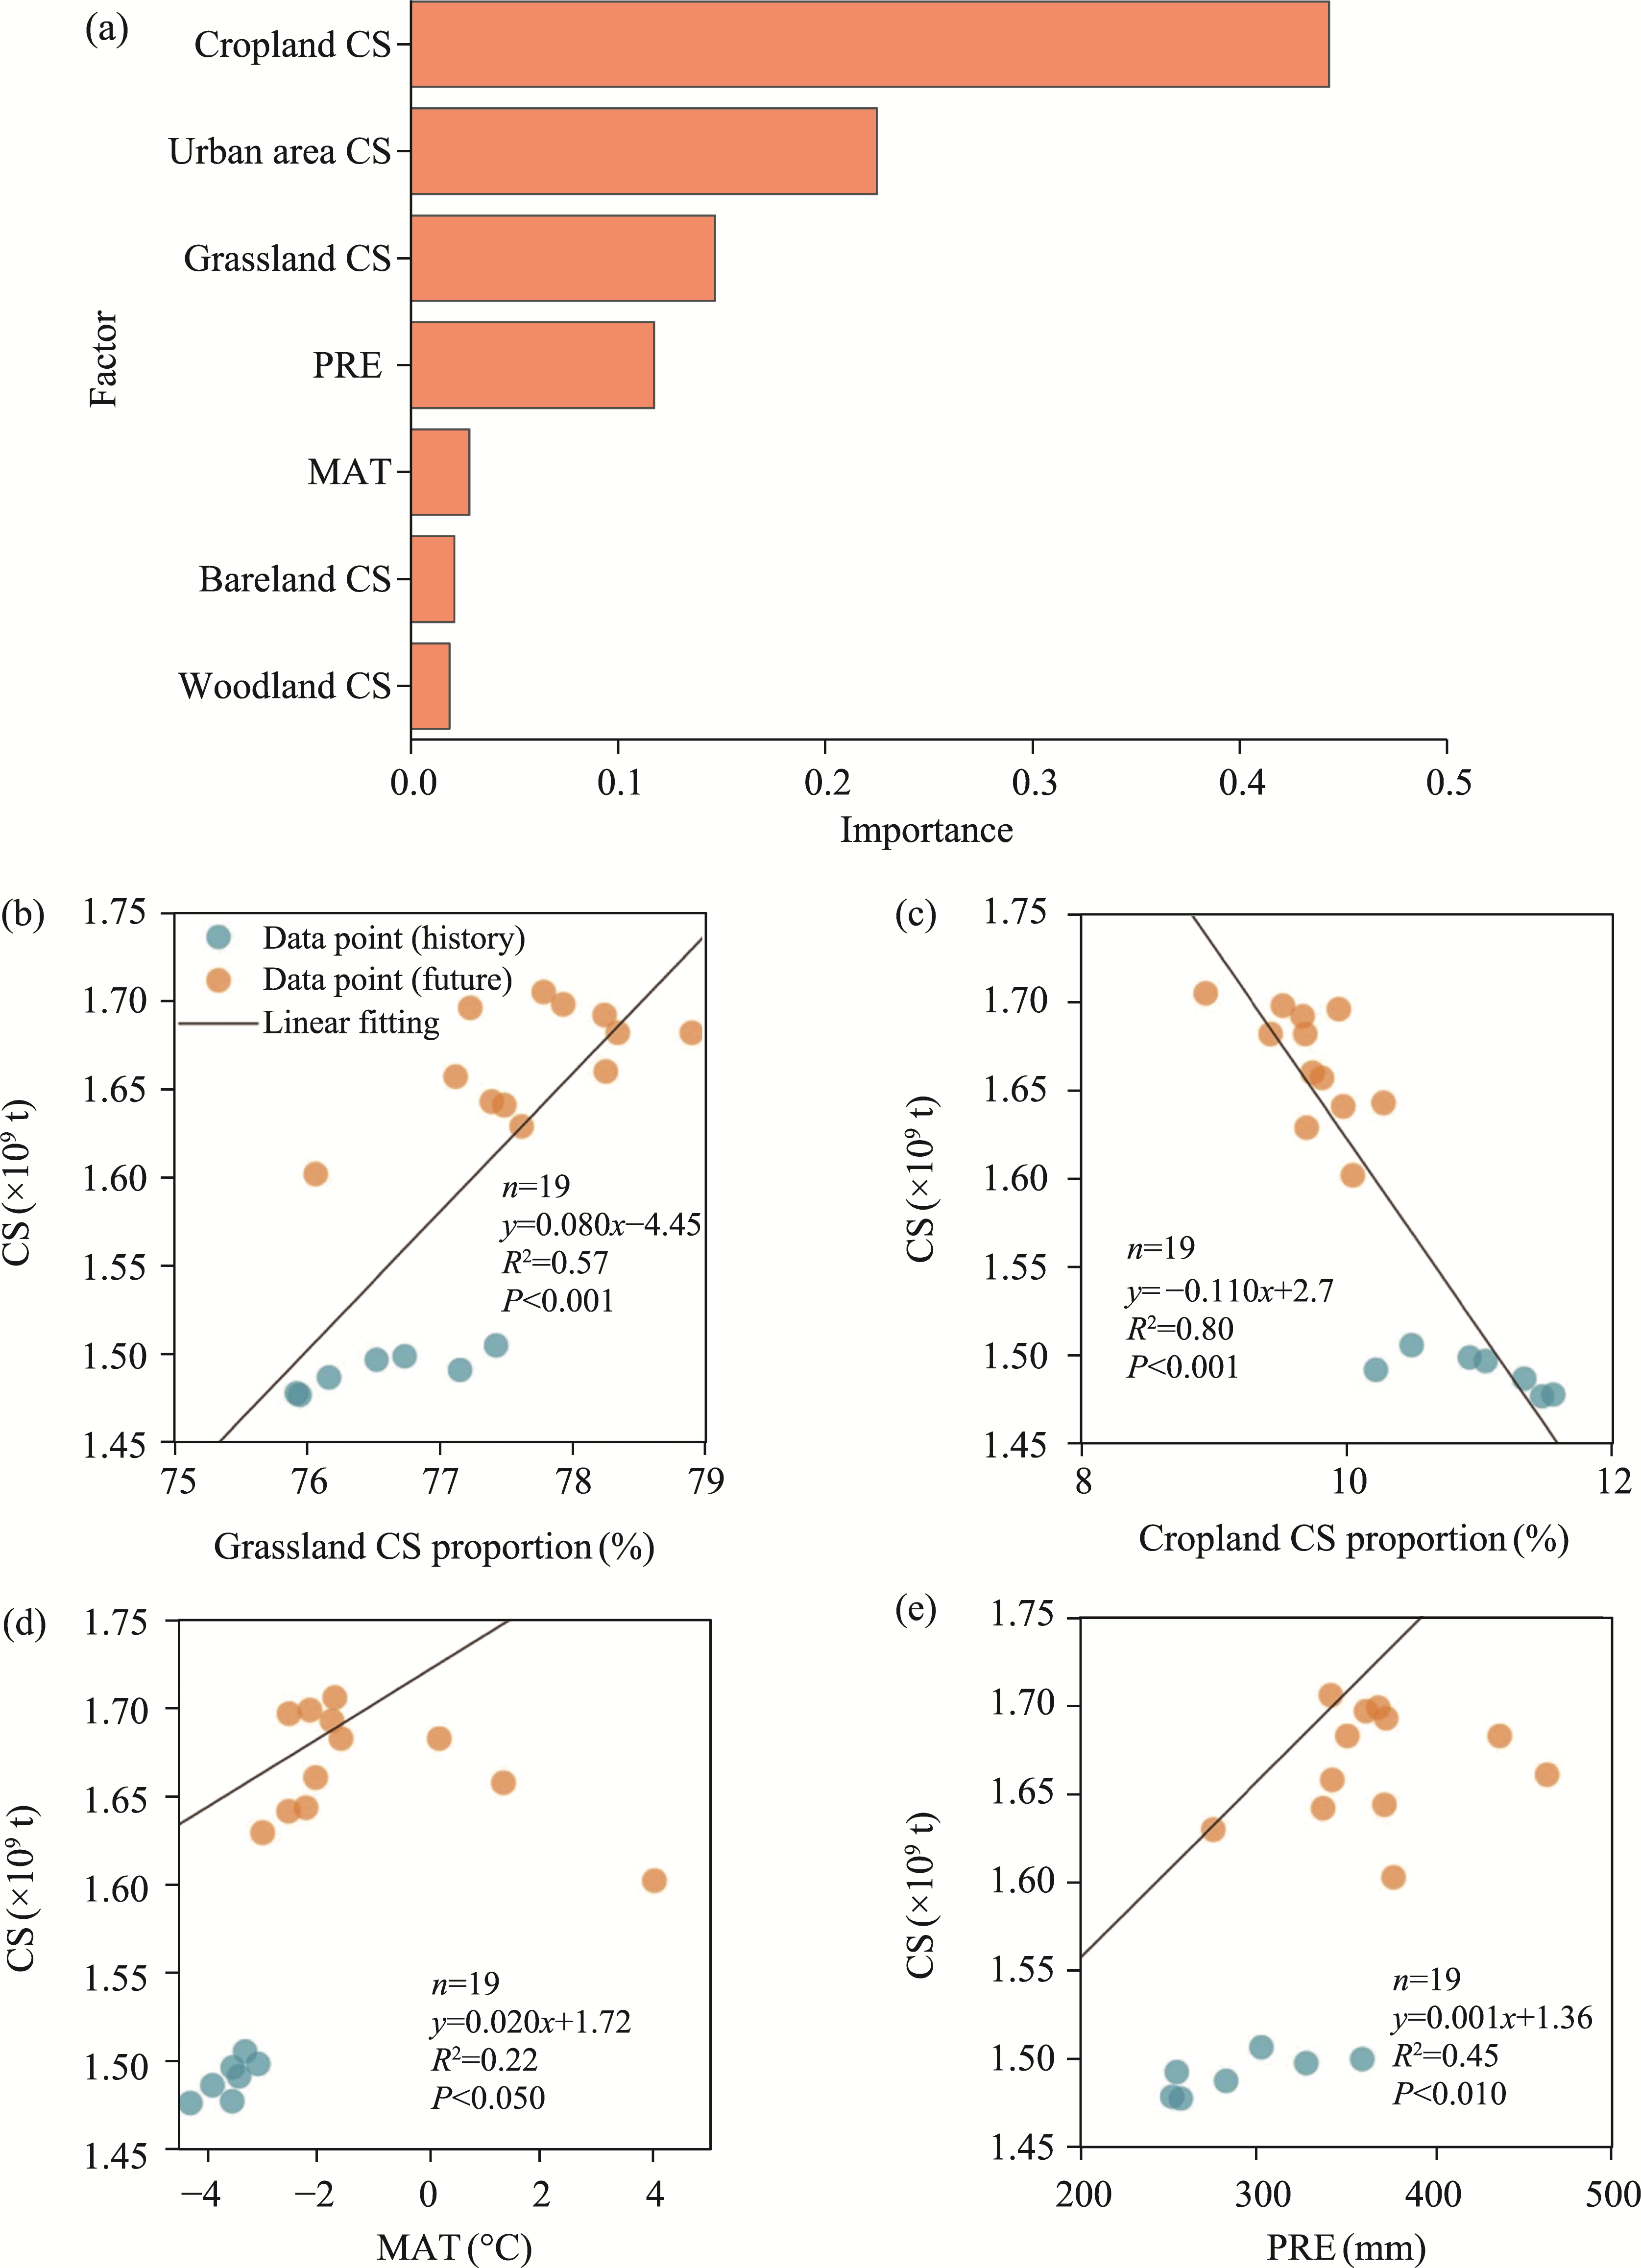
Fig. 10Importance of seven driving factors for explaining the temporal dynamics of terrestrial CS (a) in the study area and dependence of the interannual variation in terrestrial CS on grassland and cropland components (b and c), MAT (d), and PRE (e)
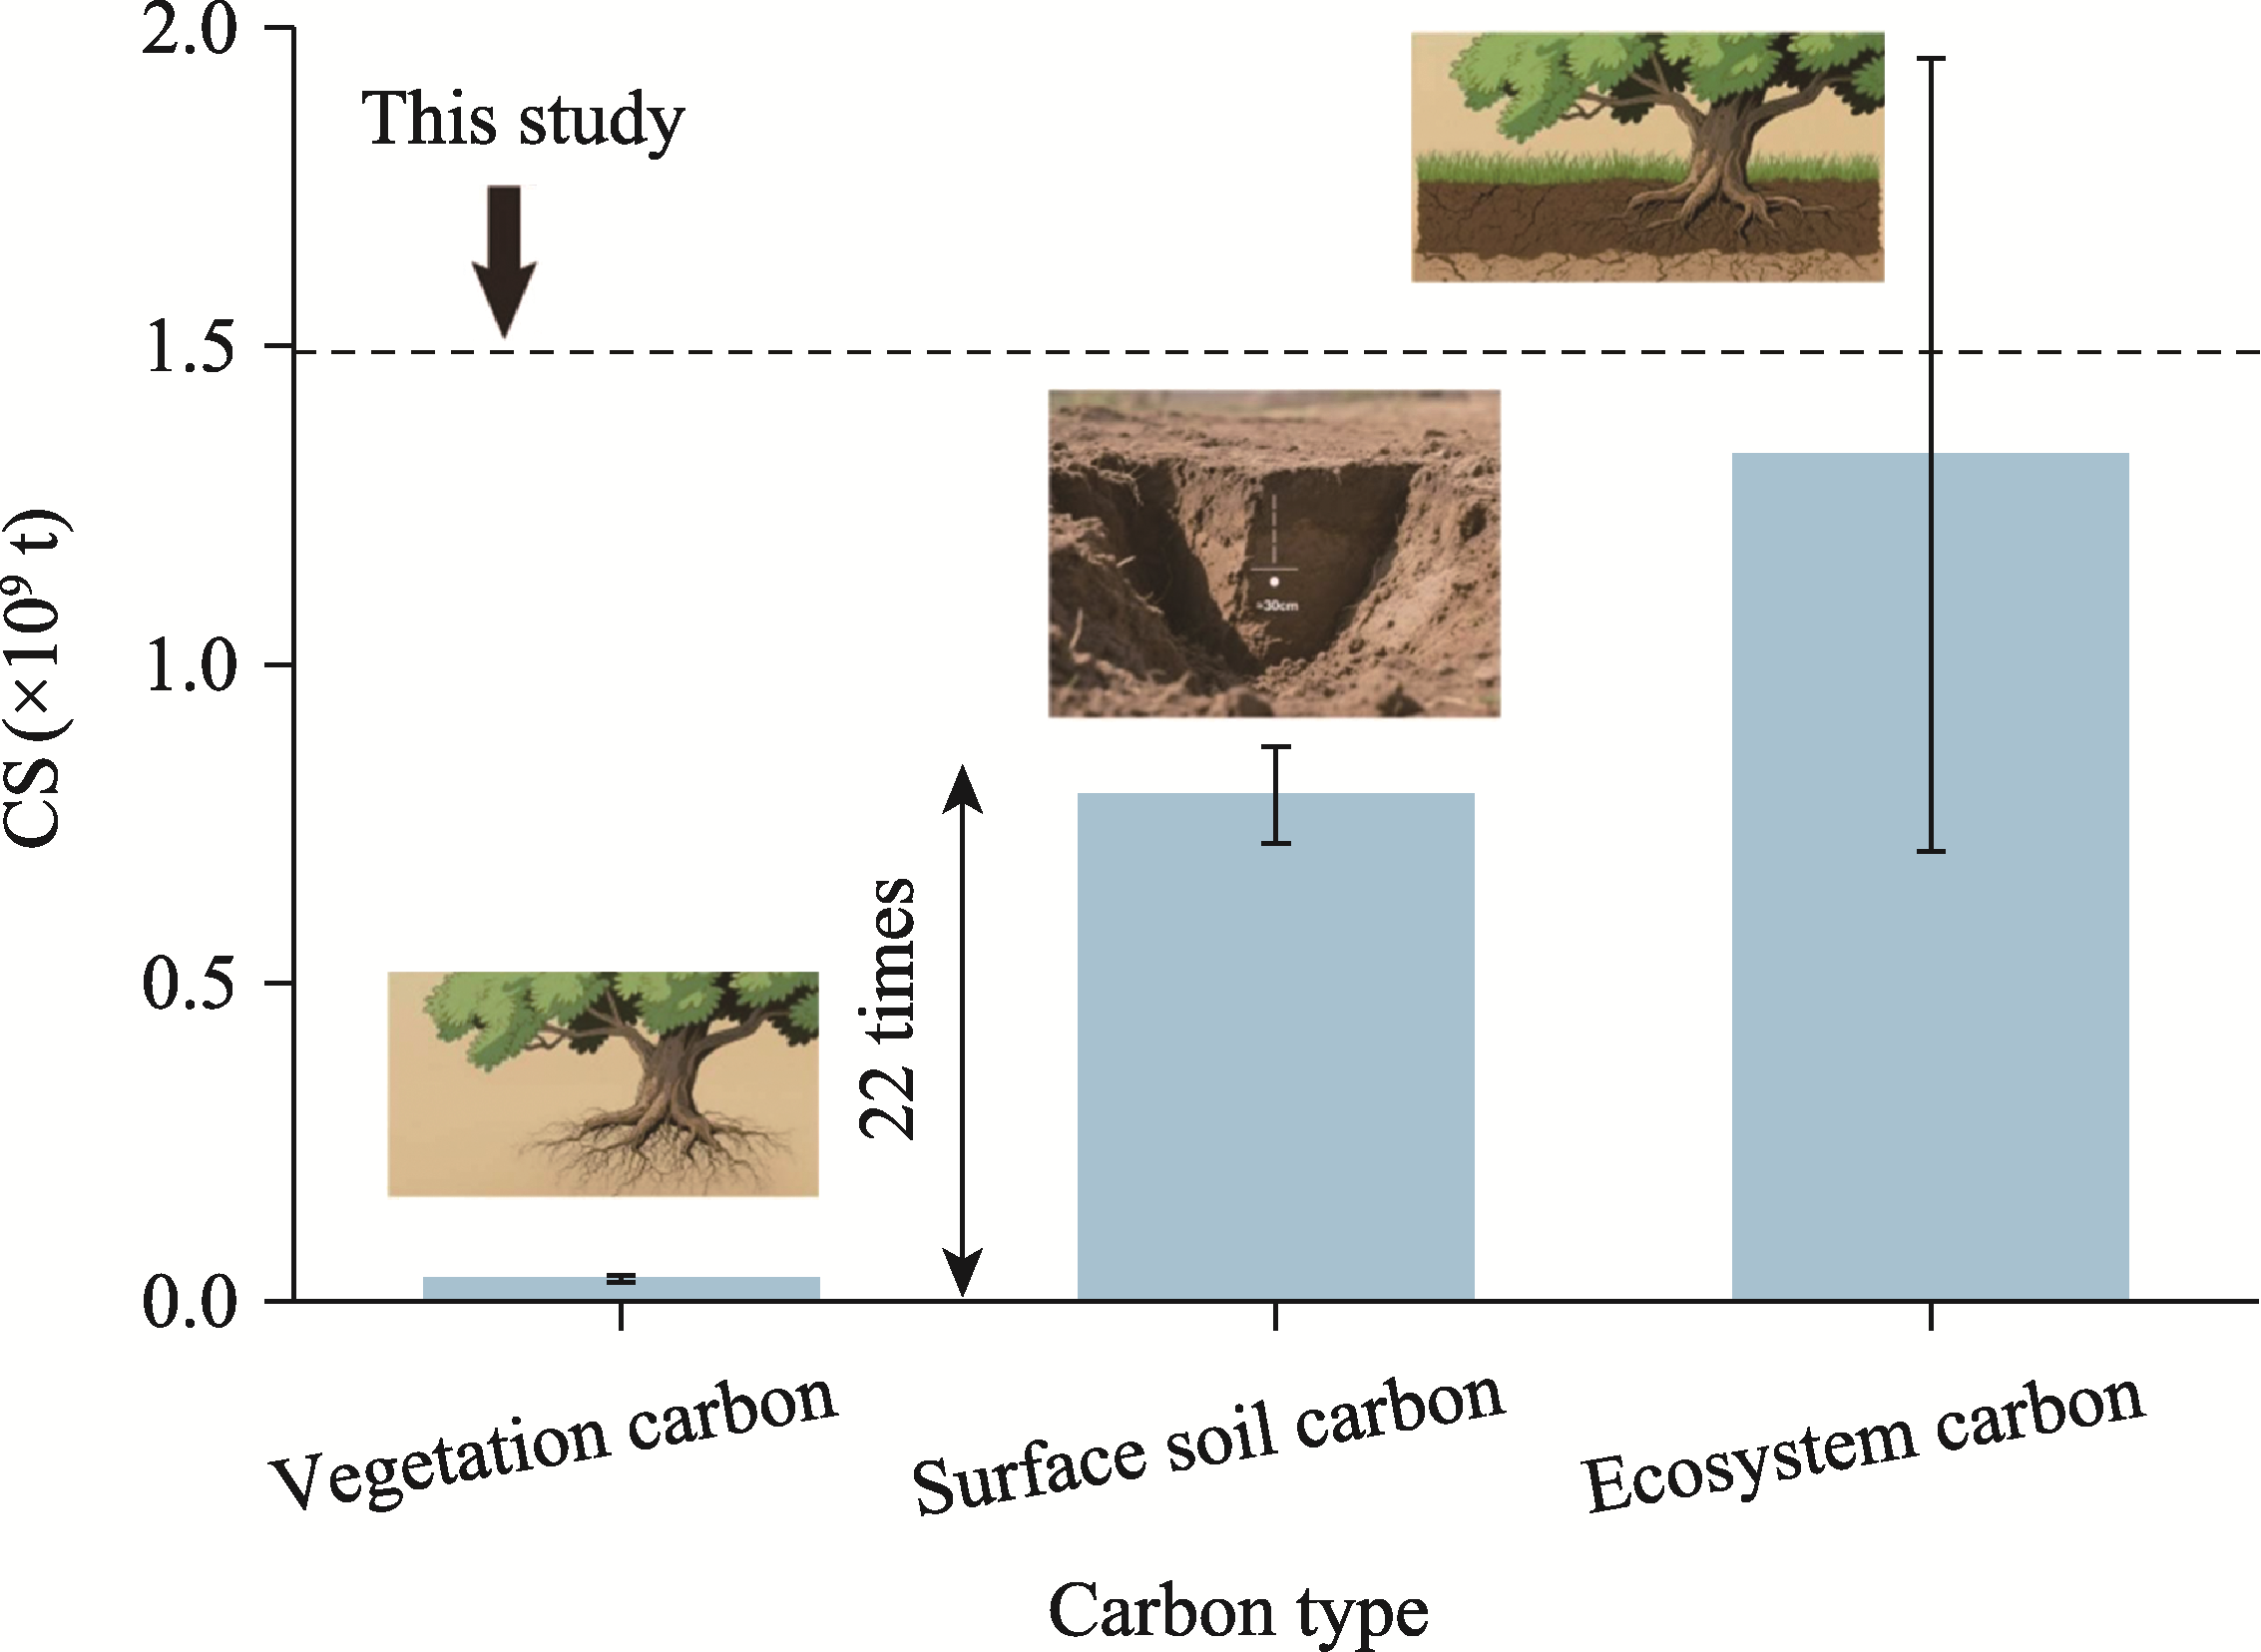
Fig. 11Uncertainty analysis of the CS modelling result. Error bars represent standard deviations.
Scenario
Period
LULC type
Cabove (t/hm2)
Cbelow (t/hm2)
Csoil (t/hm2)
Cdead (t/hm2)
History
1990-2020
Cropland
2.28
0.46
109.74
2.84
Woodland
99.14
25.71
142.64
2.00
Grassland
0.55
0.99
79.93
0.95
Urban area
0.00
0.00
36.01
0.00
Bareland
0.10
0.21
23.23
0.10
Water body
0.00
0.00
0.00
0.00
SSP126
2030
Cropland
2.46
0.49
118.58
3.07
Woodland
100.40
26.04
144.45
2.03
Grassland
0.60
1.10
88.23
1.05
Urban area
0.00
0.00
36.01
0.00
Bareland
0.12
0.23
26.23
0.11
Water body
0.00
0.00
0.00
0.00
2050
Cropland
2.54
0.51
122.60
3.17
Woodland
101.51
26.33
146.05
2.05
Grassland
0.62
1.13
90.83
1.08
Urban area
0.00
0.00
36.01
0.00
Bareland
0.13
0.26
29.22
0.13
Water body
0.00
0.00
0.00
0.00
2070
Cropland
2.51
0.50
121.00
3.13
Woodland
101.05
26.21
145.39
2.04
Grassland
0.62
1.14
91.35
1.09
Urban area
0.00
0.00
36.01
0.00
Bareland
0.13
0.26
29.22
0.13
Water body
0.00
0.00
0.00
0.00
2100
Cropland
2.53
0.51
121.80
3.15
Woodland
101.38
26.29
145.86
2.05
Grassland
0.62
1.14
91.35
1.09
Urban area
0.00
0.00
36.01
0.00
Bareland
0.13
0.27
29.97
0.13
Water body
0.00
0.00
0.00
0.00
SSP245
2030
Cropland
2.38
0.48
114.96
2.98
Woodland
99.42
25.78
143.04
2.01
Grassland
0.60
1.09
87.72
1.04
Urban area
0.00
0.00
36.01
0.00
Bareland
0.12
0.25
27.73
0.12
Water body
0.00
0.00
0.00
0.00
2050
Cropland
2.45
0.49
118.18
3.06
Woodland
100.41
26.04
144.47
2.03
Grassland
0.61
1.12
89.79
1.07
Urban area
0.00
0.00
36.01
0.00
Bareland
0.13
0.25
28.48
0.12
Water body
0.00
0.00
0.00
0.00
2070
Cropland
2.52
0.50
121.40
3.14
Woodland
101.22
26.25
145.63
2.04
Grassland
0.62
1.14
91.35
1.09
Urban area
0.00
0.00
36.01
0.00
Bareland
0.13
0.27
29.97
0.13
Water body
0.00
0.00
0.00
0.00
SSP245
2100
Cropland
2.53
0.51
122.20
3.16
Woodland
101.58
26.34
146.15
2.05
Grassland
0.62
1.14
91.35
1.09
Urban area
0.00
0.00
36.01
0.00
Bareland
0.13
0.27
29.97
0.13
Water body
0.00
0.00
0.00
0.00
SSP585
2030
Cropland
2.51
0.50
123.41
3.13
Woodland
100.90
26.17
145.17
2.04
Grassland
0.60
1.10
88.23
1.05
Urban area
0.00
0.00
36.01
0.00
Bareland
0.12
0.23
26.23
0.11
Water body
0.00
0.00
0.00
0.00
2050
Cropland
2.49
0.50
120.19
3.11
Woodland
100.91
26.17
145.19
2.04
Grassland
0.62
1.14
91.35
1.09
Urban area
0.00
0.00
36.01
0.00
Bareland
0.13
0.27
29.97
0.13
Water body
0.00
0.00
0.00
0.00
2070
Cropland
2.52
0.50
121.40
3.14
Woodland
101.44
26.31
145.95
2.05
Grassland
0.62
1.14
91.35
1.09
Urban area
0.00
0.00
36.01
0.00
Bareland
0.13
0.27
29.97
0.13
Water body
0.00
0.00
0.00
0.00
2100
Cropland
2.56
0.51
123.41
3.19
Woodland
101.69
26.37
146.31
2.05
Grassland
0.62
1.14
91.35
1.09
Urban area
0.00
0.00
36.01
0.00
Bareland
0.13
0.27
29.97
0.13
Water body
0.00
0.00
0.00
0.00
Table S1 Carbon density of different land use and land cover (LULC) types in the Qilian Mountains
[1]
Berardi D, Brzostek E, Blanc-Betes E, et al. 2020. 21st-century biogeochemical modeling: challenges for century-based models and where do we go from here? Global Change Biology Bioenergy, 12(10): 774-788.
doi: 10.1111/gcbb.v12.10
Cai Y T, Zhu P, Li X, et al. 2025. Dynamics of China's forest carbon storage: the first 30 m annual aboveground biomass mapping from 1985 to 2023. Earth System Science Data, 17(12): 6993-7018.
doi: 10.5194/essd-17-6993-2025
[4]
Chang X Q, Xing Y Q, Wang J Q, et al. 2022. Effects of land use and cover change (LUCC) on terrestrial carbon stocks in China between 2000 and 2018. Resources, Conservation and Recycling, 182: 106333, doi: 10.1016/j.resconrec.2022.106333.
[5]
deB Richter D, Houghton R A. 2011. Gross CO2 fluxes from land-use change: implications for reducing global emissions and increasing sinks. Carbon Management, 2(1): 41-47.
doi: 10.4155/cmt.10.43
[6]
Deng H M, Zhang Z J, Wu Y. 2024. Accelerated permafrost degradation in thermokarst landforms in Qilian Mountains from 2007 to 2020 observed by SBAS-InSAR. Ecological Indicators, 159: 111724, doi: 10.1016/j.ecolind.2024.111724.
[7]
Deng Z, Ding W G, Pu X T, et al. 2022. Spatial-temporal distribution of carbon storage in Qilian Mountain National Park based on InVEST model. Bulletin of Soil and Water Conservation, 42(3): 324-334, 396. (in Chinese)
[8]
Ding J Z, Wang T, Piao S L, et al. 2019. The paleoclimatic footprint in the soil carbon stock of the Tibetan permafrost region. Nature Communications, 10: 4195, doi: 10.1038/s41467-019-12214-5.
pmid: 31519899
[9]
Dong C, Yu H Y, Qian X L, et al. 2024. Enhancing ecological connectivity in the Qilian Mountains: integrating GCA and optimized MST models for ecological corridor construction. Ecological Indicators, 166: 112525, doi: 10.1016/j.ecolind.2024.112525.
[10]
Fang J Y, Yu G R, Liu L L, et al. 2018. Climate change, human impacts, and carbon sequestration in China. Proceedings of the National Academy of Sciences, 115(16): 4015-4020.
[11]
Fang M Z, Liu W, Zhang J Y, et al. 2024. Quantitative evaluation of the applicability of classical forest ecosystem carbon cycle models in China: a case study of the Biome-BGC model. Forests, 15(9): 1609, doi: 10.3390/f15091609.
[12]
Fu Q, Li B, Hou Y, et al. 2017. Effects of land use and climate change on ecosystem services in Central Asia's arid regions: a case study in Altay Prefecture, China. Science of The Total Environment, 607-608: 633-646.
doi: 10.1016/j.scitotenv.2017.06.241
[13]
Hou Q Q, Yang H, Wu J S, et al. 2023. Carbon budget response to climate change varies with grassland type in Qilian Mountains, China. Global Ecology and Conservation, 47: e02670, doi: 10.1016/j.gecco.2023.e02670.
[14]
Houghton R A. 2003. Revised estimates of the annual net flux of carbon to the atmosphere from changes in land use and land management 1850-2000. Tellus B, 55(2): 378-390.
[15]
Ito A, Nishina K, Noda H M. 2016. Impacts of future climate change on the carbon budget of northern high-latitude terrestrial ecosystems: an analysis using ISI-MIP data. Polar Science, 10(3): 346-355.
doi: 10.1016/j.polar.2015.11.002
[16]
Jiang W G, Deng Y, Tang Z H, et al. 2017. Modelling the potential impacts of urban ecosystem changes on carbon storage under different scenarios by linking the CLUE-S and the InVEST models. Ecological Modelling, 345: 30-40.
doi: 10.1016/j.ecolmodel.2016.12.002
[17]
Li B B, Fang X Q, Ye Y, et al. 2014. Carbon emissions induced by cropland expansion in Northeast China during the past 300 years. Science China Earth Sciences, 57: 2259-2268.
doi: 10.1007/s11430-014-4894-4
[18]
Li Y G, Liu W, Feng Q, et al. 2022. Effects of land use and land cover change on soil organic carbon storage in the Hexi regions, Northwest China. Journal of Environmental Management, 312: 114911, doi: 10.1016/j.jenvman.2022.114911.
[19]
Li Z X, Feng Q, Li Z J, et al. 2021. Reversing conflict between humans and the environment—The experience in the Qilian Mountains. Renewable and Sustainable Energy Reviews, 148: 111333, doi: 10.1016/j.rser.2021.111333.
[20]
Liang Y J, Hashimoto S, Liu L J. 2021. Integrated assessment of land-use/land-cover dynamics on carbon storage services in the Loess Plateau of China from 1995 to 2050. Ecological Indicators, 120: 106939, doi: 10.1016/j.ecolind.2020.106939.
[21]
Liu W, Liu D F, Liu Y. 2023. Spatially heterogeneous response of carbon storage to land use changes in Pearl River Delta urban agglomeration, China. Chinese Geographical Science, 33(2): 271-286.
doi: 10.1007/s11769-023-1343-3
[22]
Liu X P, Wang S J, Wu P J, et al. 2019. Impacts of urban expansion on terrestrial carbon storage in China. Environmental Science & Technology, 53(12): 6834-6844.
doi: 10.1021/acs.est.9b00103
[23]
Ma R, Xia C L, Liu Y W, et al. 2022. Spatiotemporal change of net primary productivity and its response to climate change in temperate grasslands of China. Frontiers in Plant Science, 13: 899800, doi: 10.3389/fpls.2022.899800.
[24]
Ma X Z, Wang Z. 2015. Progress in the study on the impact of land-use change on regional carbon sources and sinks. Acta Ecologica Sinica, 35(17): 5898-5907. (in Chinese)
[25]
Mukhopadhyay A, Hati J P, Acharyya R, et al. 2025. Global trends in using the InVEST model suite and related research: a systematic review. Ecohydrology & Hydrobiology, 25(2): 389-405.
[26]
Peng Q Y, Li X Q, Shen R Q, et al. 2022. How well can we predict vegetation growth through the coming growing season? Science of Remote Sensing, 5: 100043, doi: 10.1016/j.srs.2022.100043.
[27]
Pongratz J, Reick C, Raddatz T, et al. 2008. A reconstruction of global agricultural areas and land cover for the last millennium. Global Biogeochemical Cycles, 22(3): GB3018, doi: 10.1029/2007GB003153.
[28]
Qi X L, Xu H J, Teng R Y, et al. 2024. Ecological restoration largely alleviates livestock grazing pressure in a montane grassland. Journal of Cleaner Production, 467: 143044, doi: 10.1016/j.jclepro.2024.143044.
[29]
Qian D W, Cao G M, Du Y G, et al. 2019. Impacts of climate change and human factors on land cover change in inland mountain protected areas: a case study of the Qilian Mountain National Nature Reserve in China. Environmental Monitoring and Assessment, 191: 486, doi: 10.1007/s10661-019-7619-5.
pmid: 31289942
[30]
Qin X, Liu W B, Mao R C, et al. 2021. Quantitative assessment of driving factors affecting human appropriation of net primary production (HANPP) in the Qilian Mountains, China. Ecological Indicators, 121: 106997, doi: 10.1016/j.ecolind.2020.106997.
[31]
Rimal B, Sharma R, Kunwar R, et al. 2019. Effects of land use and land cover change on ecosystem services in the Koshi River Basin, Eastern Nepal. Ecosystem Services, 38: 100963, doi: 10.1016/j.ecoser.2019.100963.
[32]
Schuur E A G, McGuire A D, Schädel C, et al. 2015. Climate change and the permafrost carbon feedback. Nature, 520: 171-179.
doi: 10.1038/nature14338
[33]
Shan S Y, Xu H J, Qi X L, et al. 2023. Evaluation and prediction of ecological carrying capacity in the Qilian Mountain National Park, China. Journal of Environmental Management, 339: 117856, doi: 10.1016/j.jenvman.2023.117856.
[34]
Shang Z H, Feng Q S, Wu G L, et al. 2013. Grasslandification has significant impacts on soil carbon, nitrogen and phosphorus of alpine wetlands on the Tibetan Plateau. Ecological Engineering, 58: 170-179.
doi: 10.1016/j.ecoleng.2013.06.035
[35]
Su J D, Zhao X J, Li G X. 2024. Analysis and prediction of carbon storage evolution in Qilian Mountain National Park based on InVEST-FLUS Model. Environmental Engineering, 42(7): 190-199. (in Chinese)
[36]
Tang X L, Zhao X, Bai Y F, et al. 2018. Carbon pools in China's terrestrial ecosystems: new estimates based on an intensive field survey. Proceedings of the National Academy of Sciences:, 115(16): 4021-4026.
[37]
Turner M G. 1989. Landscape Ecology: the effect of pattern on process. Annual Review of Ecology, Evolution and Systematics, 20: 171-197.
[38]
Wang B, Mu C C, Lu H C, et al. 2022. Ecosystem carbon storage and sink/source of temperate forested wetlands in Xiaoxing'anling, northeast China. Journal of Forestry Research, 33: 839-849.
doi: 10.1007/s11676-021-01366-0
[39]
Wang C, Wang L S, Zhao W Z, et al. 2024. Analysis of spatiotemporal change and driving factors of NPP in Qilian Mountains from 2000 to 2020. Rangeland Ecology & Management, 96: 56-66.
doi: 10.1016/j.rama.2024.05.005
[40]
Wang J F, Zhang T L, Fu B J. 2016. A measure of spatial stratified heterogeneity. Ecological Indicators, 67: 250-256.
doi: 10.1016/j.ecolind.2016.02.052
[41]
Wu L Y, Shen X J, Zhang J Q, et al. 2024. Spatial and temporal variation of net primary productivity of herbaceous marshes and its climatic drivers in China. Frontiers in Plant Science, 15: 1380081, doi: 10.3389/fpls.2024.1380081.
[42]
Xu H J, Zhao C Y, Wang X P. 2020. Elevational differences in the net primary productivity response to climate constraints in a dryland mountain ecosystem of northwestern China. Land Degradation & Development, 31(15): 2087-2103.
doi: 10.1002/ldr.v31.15
[43]
Xu L, Yu G R, He N P, et al. 2018. Carbon storage in China's terrestrial ecosystems: A synthesis. Scientific Reports, 8: 2806, doi: 10.1038/s41598-018-20764-9.
pmid: 29434274
[44]
Yan M, Tian X, Li Z Y, et al. 2016. Simulation of forest carbon fluxes using model incorporation and data assimilation. Remote Sensing, 8(7): 567, doi: 10.3390/rs8070567.
[45]
Yan W D, Wang W C, Peng Y Y, et al. 2022. Evaluation of biomass and carbon stocks in three pine forest types in Karst area of southwestern China. Journal of Sustainable Forestry, 41(1): 18-32.
doi: 10.1080/10549811.2020.1830803
[46]
Yang A L, Zhang H, Yang X J, et al. 2023. Quantitative analysis of the impact of climate change and human activities on vegetation NPP in the Qilian Mountain. Human and Ecological Risk Assessment: An International Journal, 29(1): 202-221.
doi: 10.1080/10807039.2022.2152774
[47]
Yuan X, Jiao L, Che X C, et al. 2024. Study on the water-carbon coupling coordination function on the eastern edge of the Qinghai-Tibet plateau. Ecological Modelling, 487: 110572, doi: 10.1016/j.ecolmodel.2023.110572.
[48]
Zeng N, Jiang K J, Han P F, et al. 2022. The Chinese carbon-neutral goal: challenges and prospects. Advances in Atmospheric Sciences, 39(9): 1229-1238.
doi: 10.1007/s00376-021-1313-6
[49]
Zhang J X, Liu Z, Guan Z L, et al. 2025a. Balancing future urban development and carbon sequestration: a multi-scenario InVEST model analysis of China's urban clusters. Journal of Environmental Management, 380: 125003, doi: 10.1016/j.jenvman.2025.125003.
[50]
Zhang M Y, He H L, Zhang L, et al. 2025b. A terrestrial ecosystem carbon sink assessment model considering forest age dynamics (CEVSA-AgeD). Journal of Advances in Modeling Earth Systems, 17(2): e2024MS004575, doi: 10.1029/2024MS004575.
[51]
Zhang T Y, Cheng C X, Wu X D. 2023. Mapping the spatial heterogeneity of global land use and land cover from 2020 to 2100 at a 1 km resolution. Scientific Data, 10: 748, doi: 10.1038/s41597-023-02637-7.
[52]
Zhu G F, Qiu D D, Zhang Z X, et al. 2021. Land-use changes lead to a decrease in carbon storage in arid region, China. Ecological Indicators, 127: 107770, doi: 10.1016/j.ecolind.2021.107770.