Spatiotemporal differentiation characteristics of soil salinization and its driving factors in the lower reaches of the Shiyang River Basin from 2017 to 2023
YANG Jianxia1,2,*(), ZHAO Jun2, MAO Xufeng1, ZHANG Yuan2
1Key Laboratory of Qinghai-Xizang Plateau Land Surface Processes and Ecological Conservation (Ministry of Education), Qinghai Normal University, Xining 810008, China 2College of Geography and Environment Science, Northwest Normal University, Lanzhou 730070, China
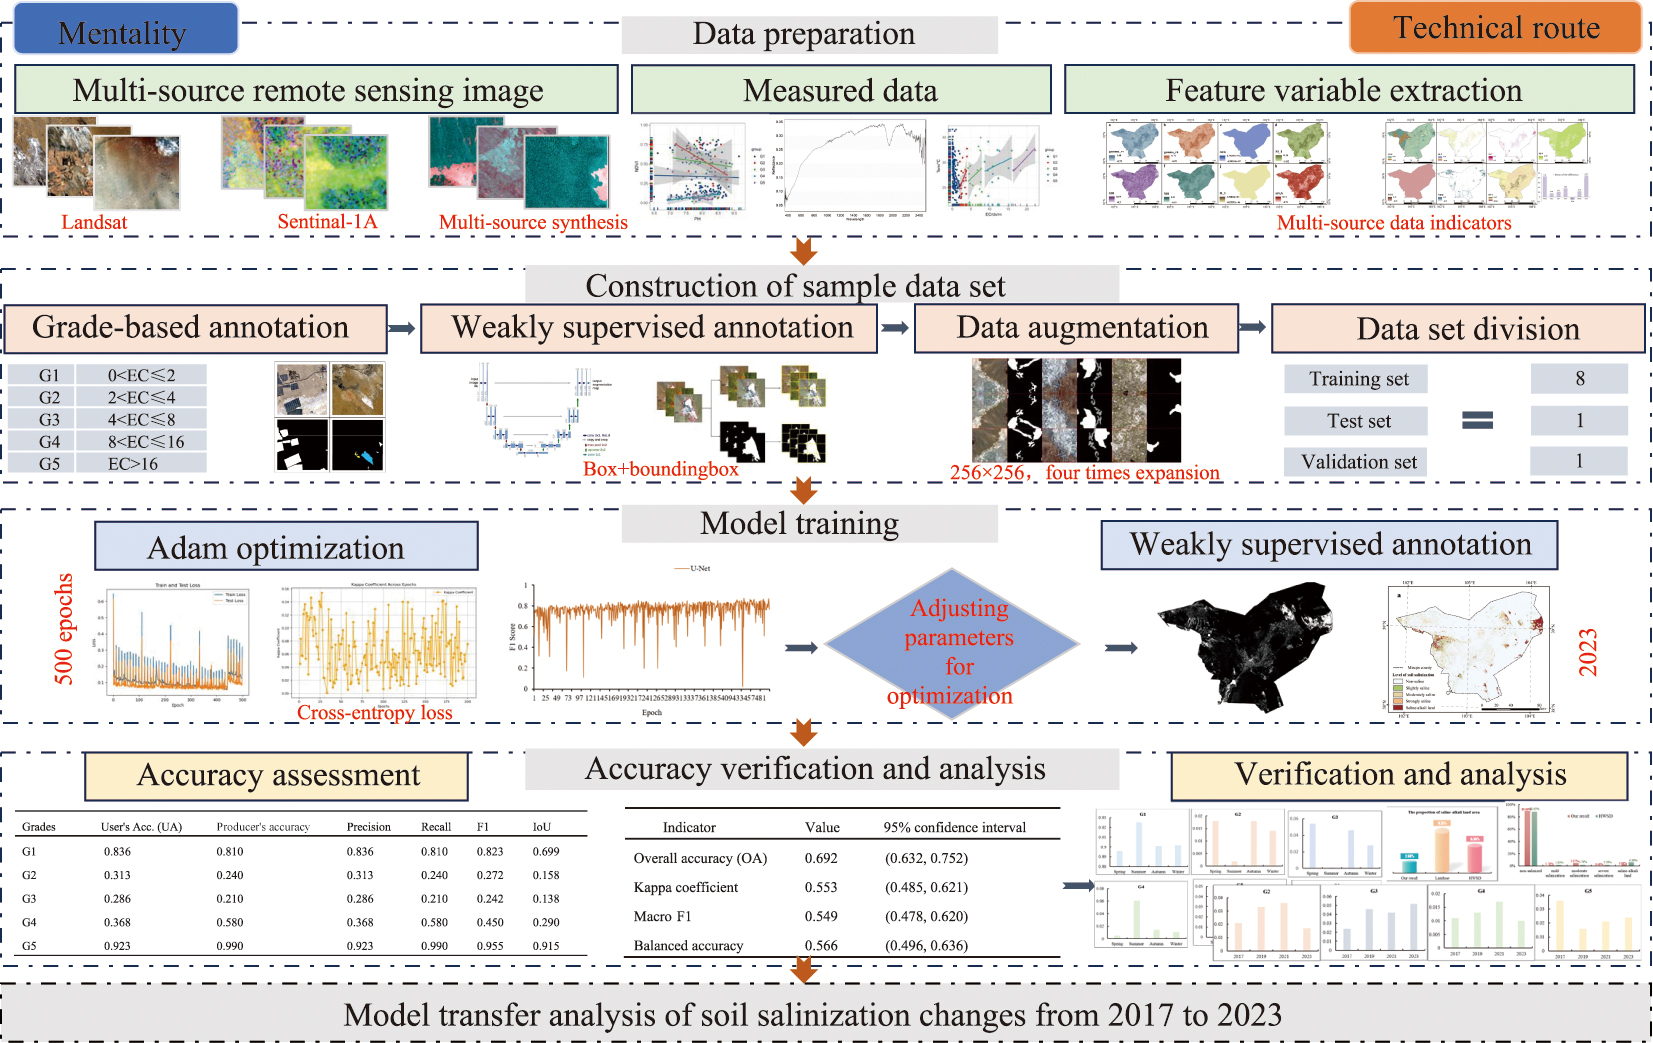
Intelligent and high-precision monitoring of soil salinization is critical for effective soil environmental management and for protecting and improving farmland quality. This study is focused on the ecologically fragile lower reaches of the Shiyang River Basin, China and involves the use of multisource remote sensing data and weakly supervised semantic segmentation to monitor changes in soil salinization from 2017 to 2023. By integrating spatial autocorrelation analysis, geographic detectors, and a coupling coordination degree model, we systematically examined the scale-dependent aggregation effects, key driving factors, and ecological impacts that have arisen since the implementation of environmental interventions. The results reveal that salinization exhibited interannual stability but significant seasonal variation over time. Spatially, this process displayed a pattern characterized by "low-salinity core oases surrounded by high-salinity peripheries". Temperature change and groundwater depth were identified as the primary drivers, whereas interactions among other factors, such as evaporation, demonstrated synergistic enhancement effects. Furthermore, coupling coordination analysis revealed improved coordination between the soil and vegetation systems, indicating that ecological restoration measures effectively reduce the risk of ecosystem degradation. This study provides technical support for the precise management of soil salinization in arid regions and important scientific evidence for ecological restoration and decision-making strategies.
Received: 17 March 2026
Published: 30 September 2026
Conceptualization: YANG Jianxia, ZHAO Jun; Methodology: YANG Jianxia, ZHAO Jun, ZHANG Yuan; Formal analysis: YANG Jianxia; Writing - original draft preparation: YANG Jianxia, ZHAO Jun; Writing - review and editing: YANG Jianxia; Visualization: YANG Jianxia, ZHANG Yuan; Funding acquisition: ZHAO Jun, MAO Xufeng; Resources: ZHAO Jun, MAO Xufeng; Supervision: YANG Jianxia, ZHAO Jun, MAO Xufeng. All authors approved the manuscript.
YANG Jianxia, ZHAO Jun, MAO Xufeng, ZHANG Yuan. Spatiotemporal differentiation characteristics of soil salinization and its driving factors in the lower reaches of the Shiyang River Basin from 2017 to 2023. Journal of Arid Land, 2026, 18(9): 1551-1576.
Fig. 1Sampling site (a), soil sand content (weight percentage; b), carbonate content (weight percentage; c), and land use type (d) distributions in the study area. HWSD, Harmonized World Soil Database (http://www.fao.org/nr/land/soils/harmonized-world-soil-database/en/).
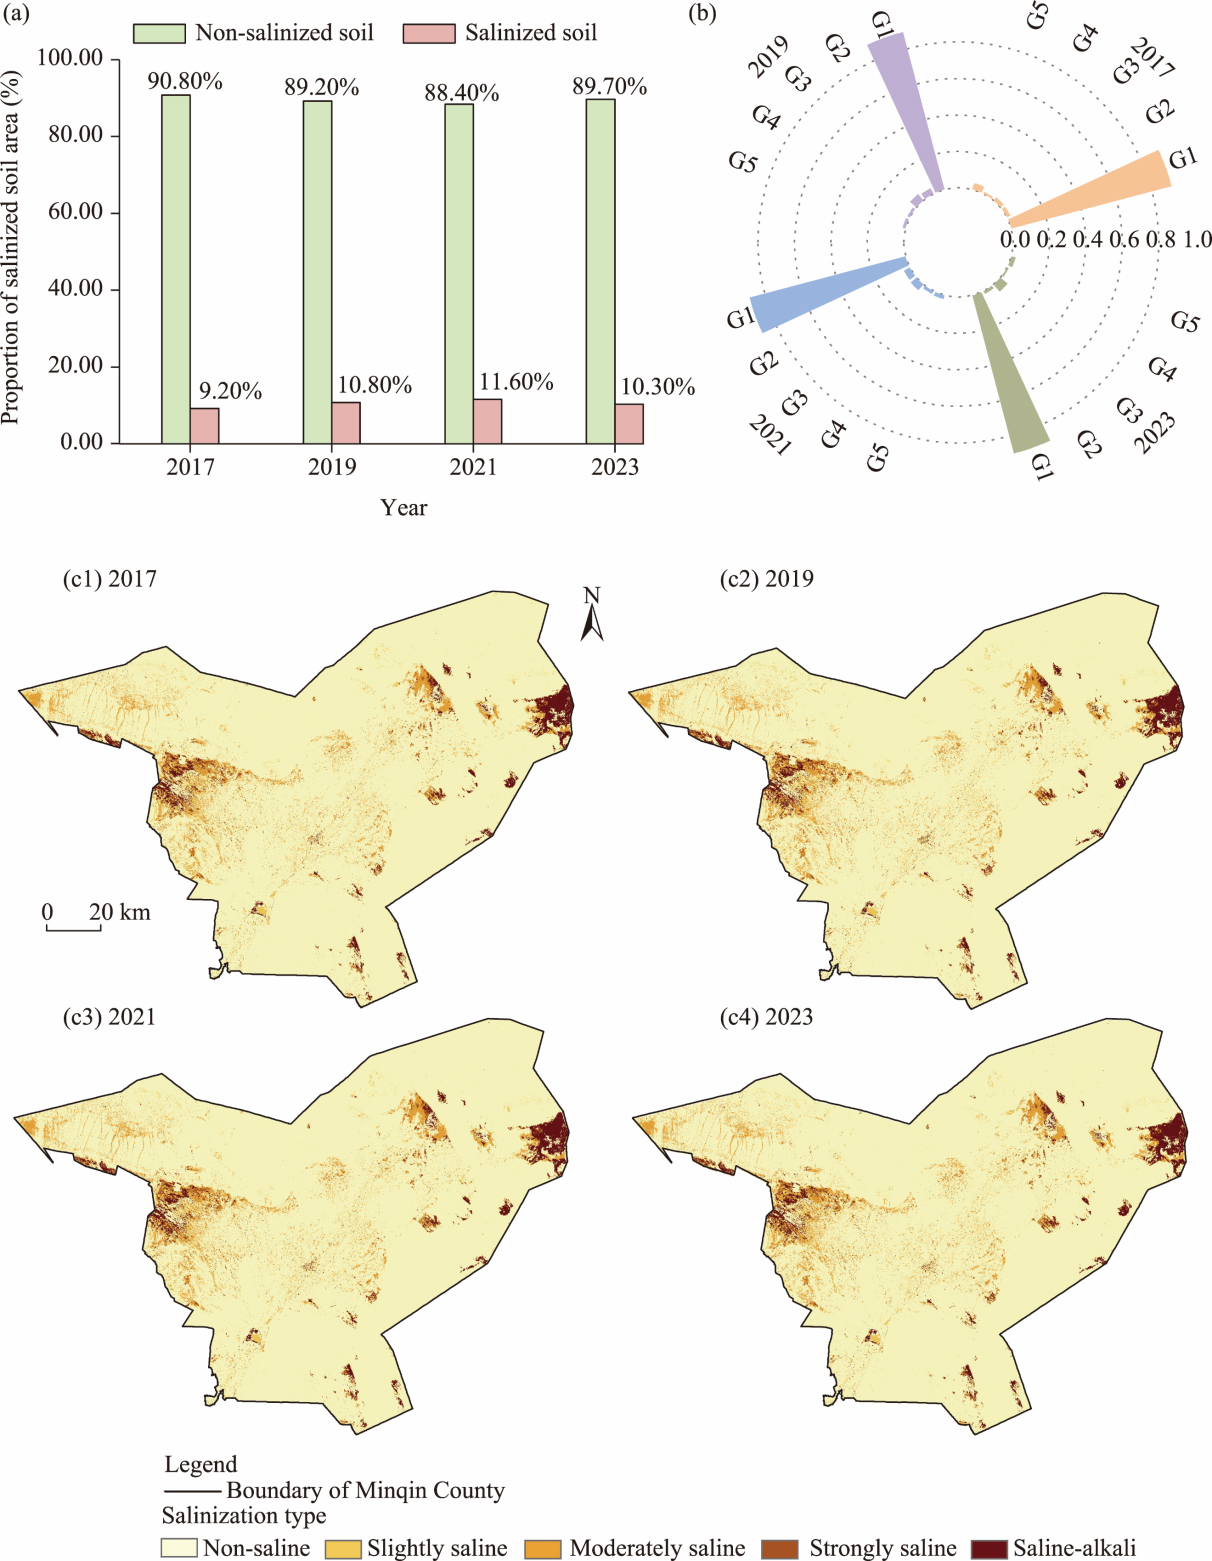
Fig. 3Interannual change statistics of salinized soil in the study area from 2017 to 2023. (a), proportion of non-salinized soil and salinized soil in the total study area; (b), proportion of different grades of salinized soil; (c), spatial distribution of salinized soil in 2017 (c1), 2019 (c2), 2021 (c3), and 2023 (c4).
Classification of salinized soil
Group
Electrical conductivity (EC) (ds/m)
Number of sample points
Verification accuracy
Non-salinized soil
G1
(0, 2]
169
0.81
Slightly salinized soil
G2
(2, 4]
21
0.24
Moderately salinized soil
G3
(4, 8]
14
0.21
Strongly salinized soil
G4
(8, 16]
12
0.58
Saline-alkali soil
G5
(16, +∞]
5
0.99
Table 2 Classification standards and measured verification information of the salinized soils
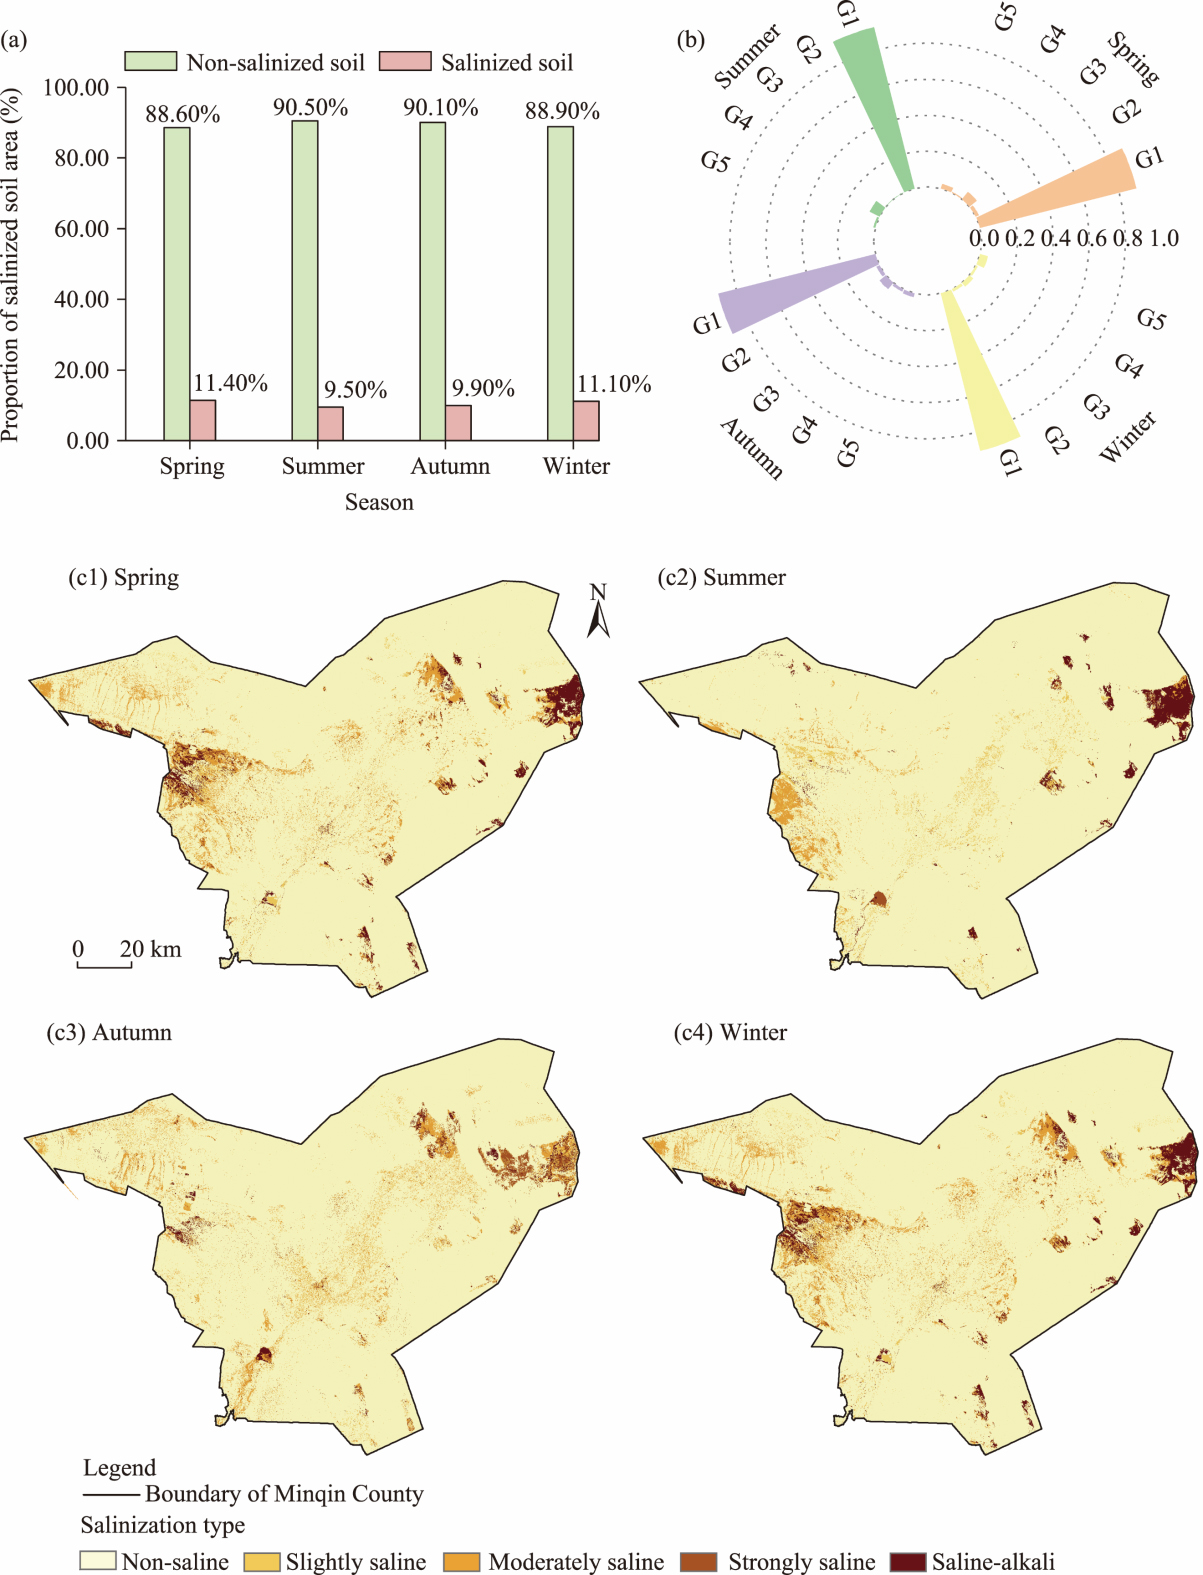
Fig. 4Seasonal variation statistics of salinized soil in the study area. (a), proportion of non-salinized soil and salinized soil in the total study area; (b), proportion of different grades of salinized soil; (c), spatial distribution characteristics of salinized soil during different seasons.
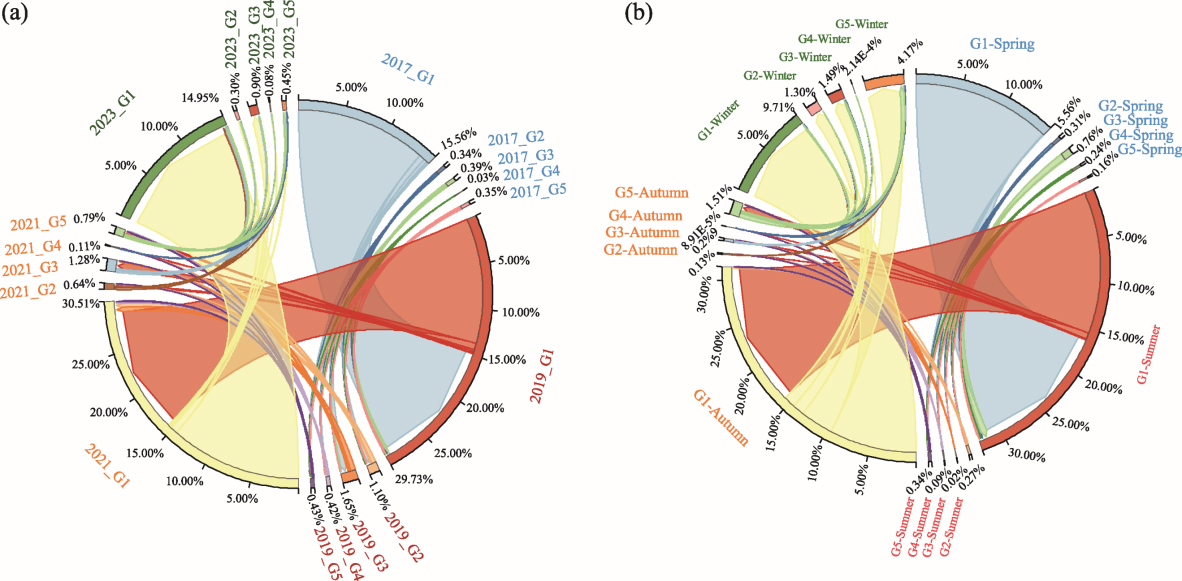
Fig. 5Interannual (a) and seasonal (b) variation characteristics of different grades of salinized soil
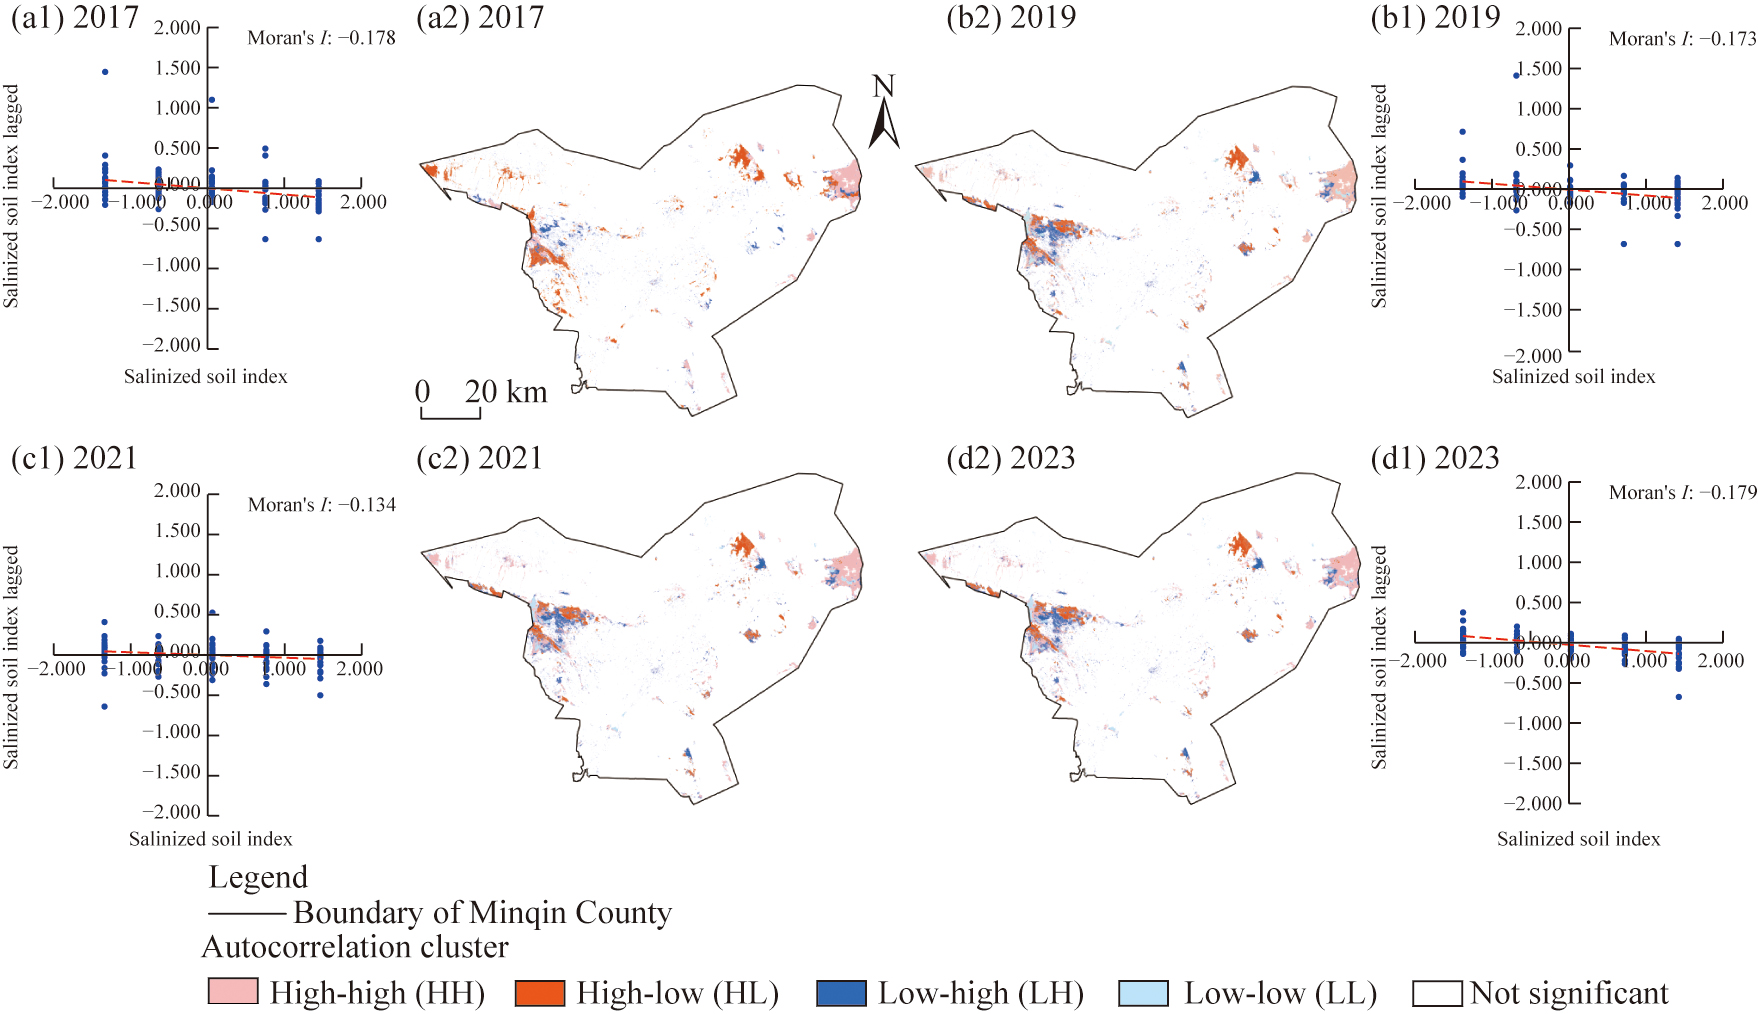
Fig. 6Scatter plots of Moran's I values (a1-d1) and spatial clustering characteristics (a2-d2) of salinized soil. The dashed red line represents the trend.
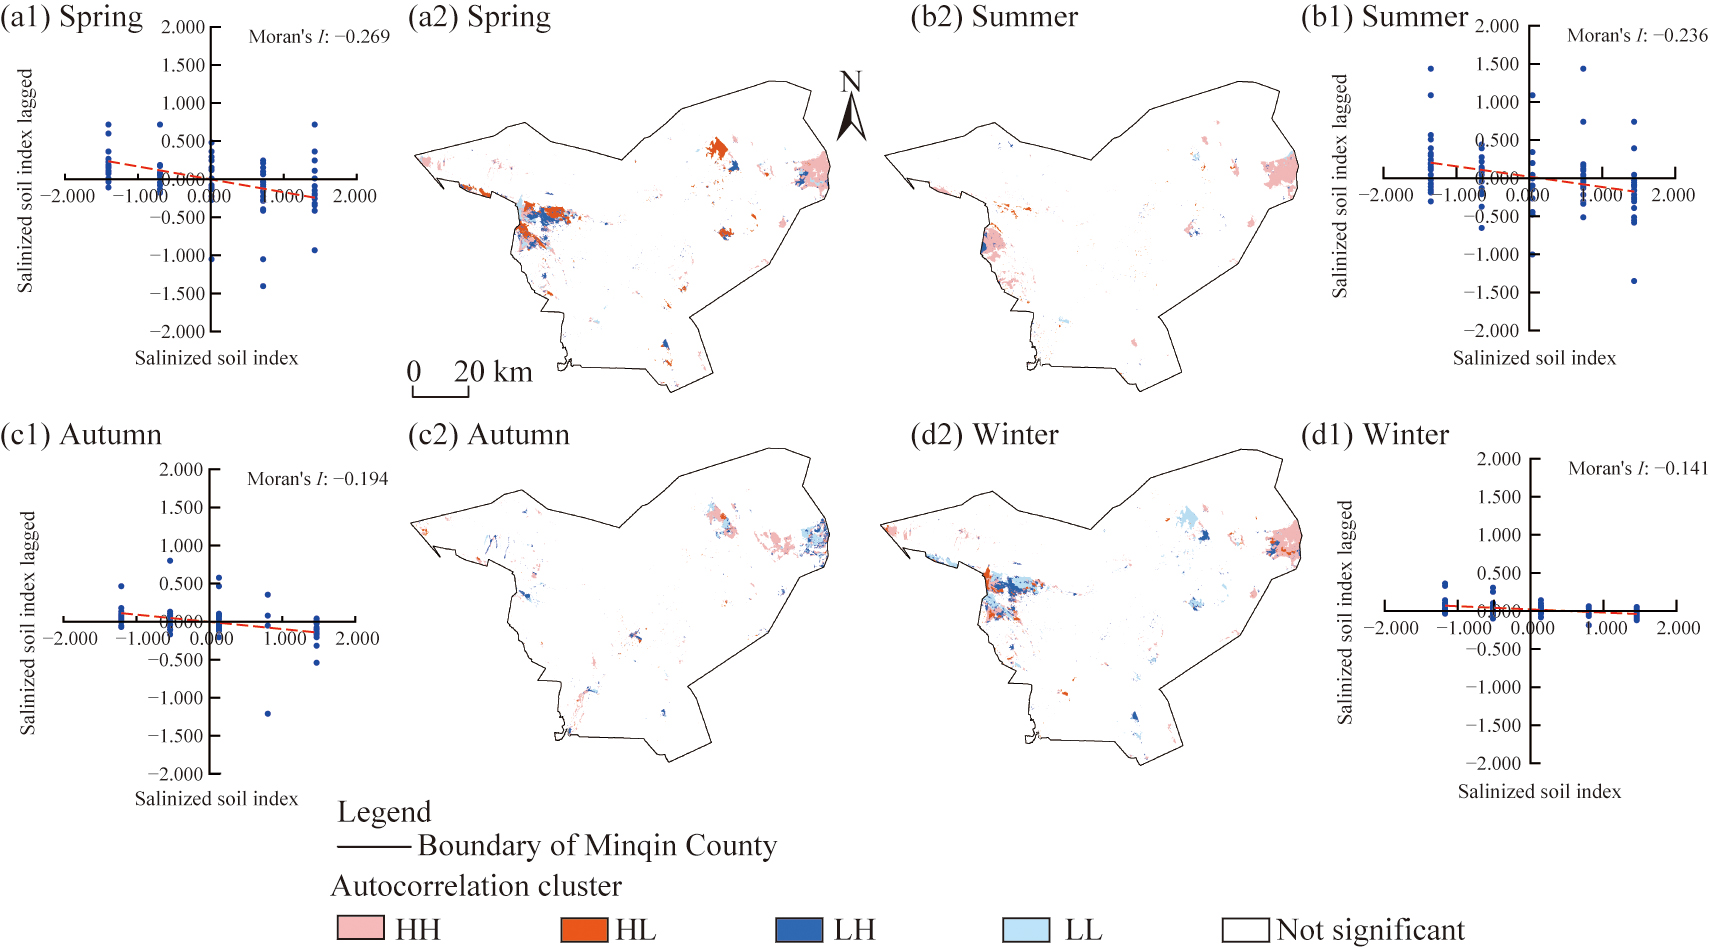
Fig. 7Scatter plots of Moran's I values (a1-d1) and spatial clustering characteristics (a2-d2) of salinized soil during different seasons. The dashed red line represents the trend.
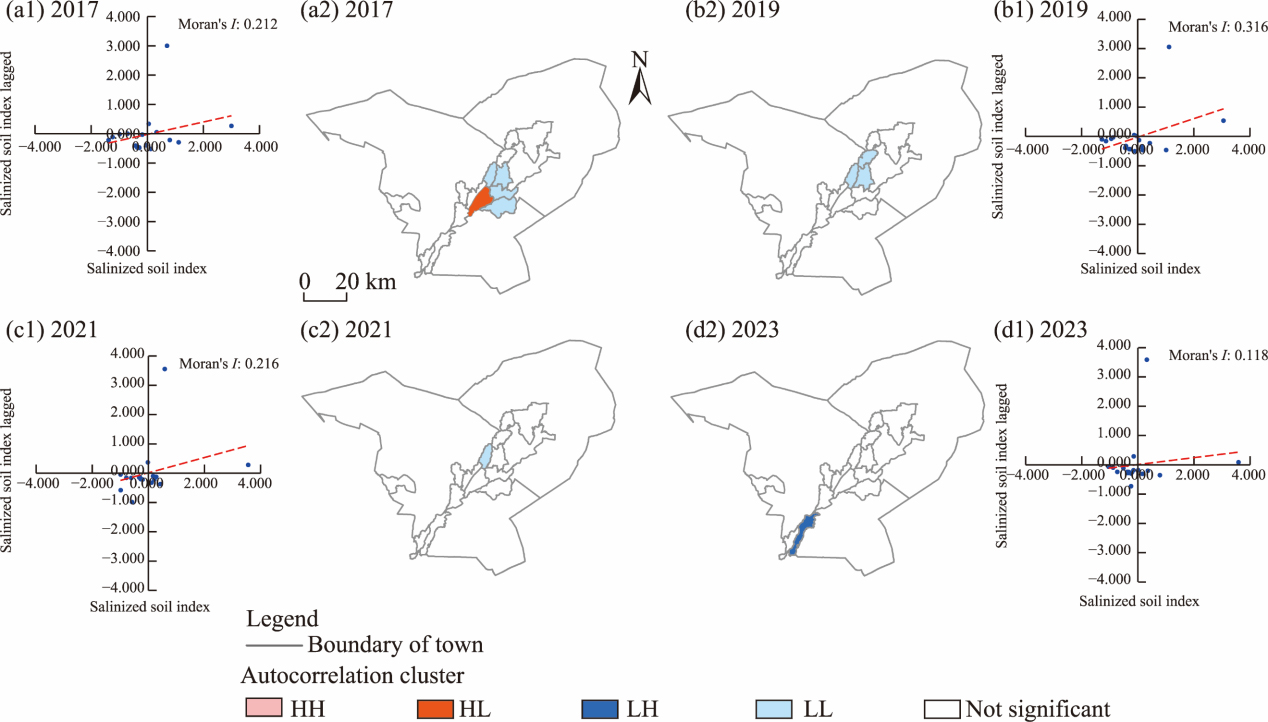
Fig. 8Moran's I values (a1-d1) and spatial clustering characteristics (a2-d2) of salinized soil in different years at the township scale. The dashed red line represents the trend.
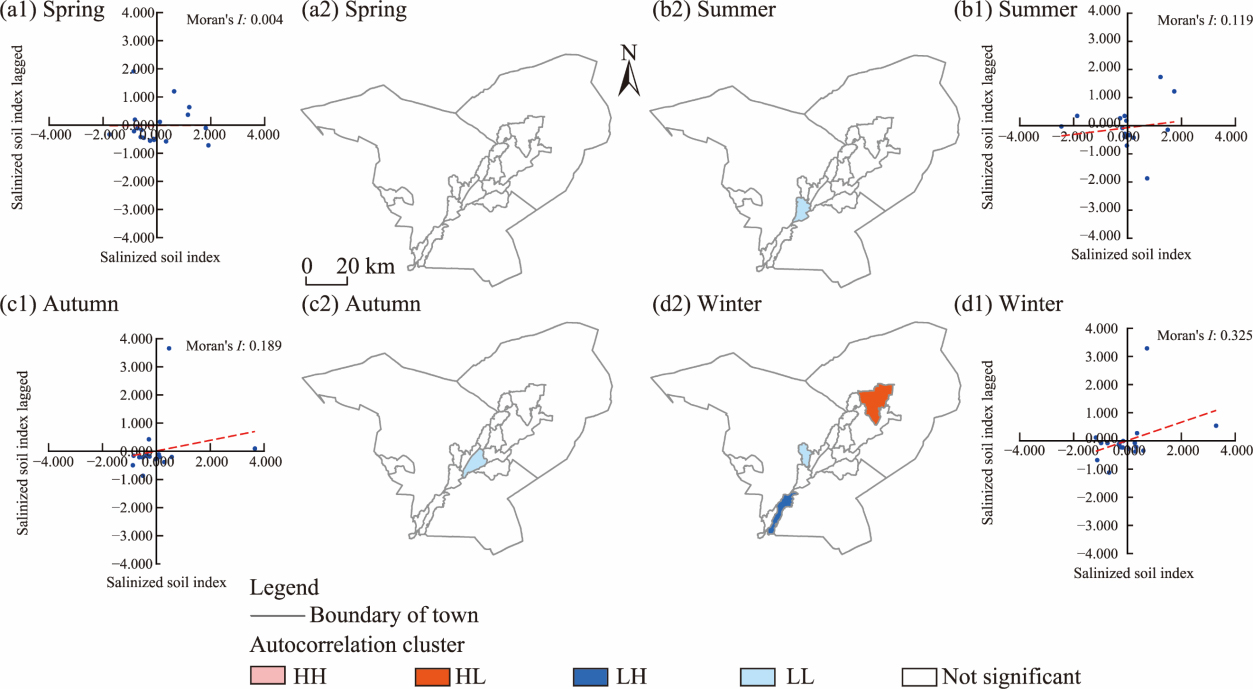
Fig. 9Moran's I values (a1-d1) and spatial clustering characteristics (a2-d2) of salinized soil in different seasons at the township scale. The dashed red line represents the trend.
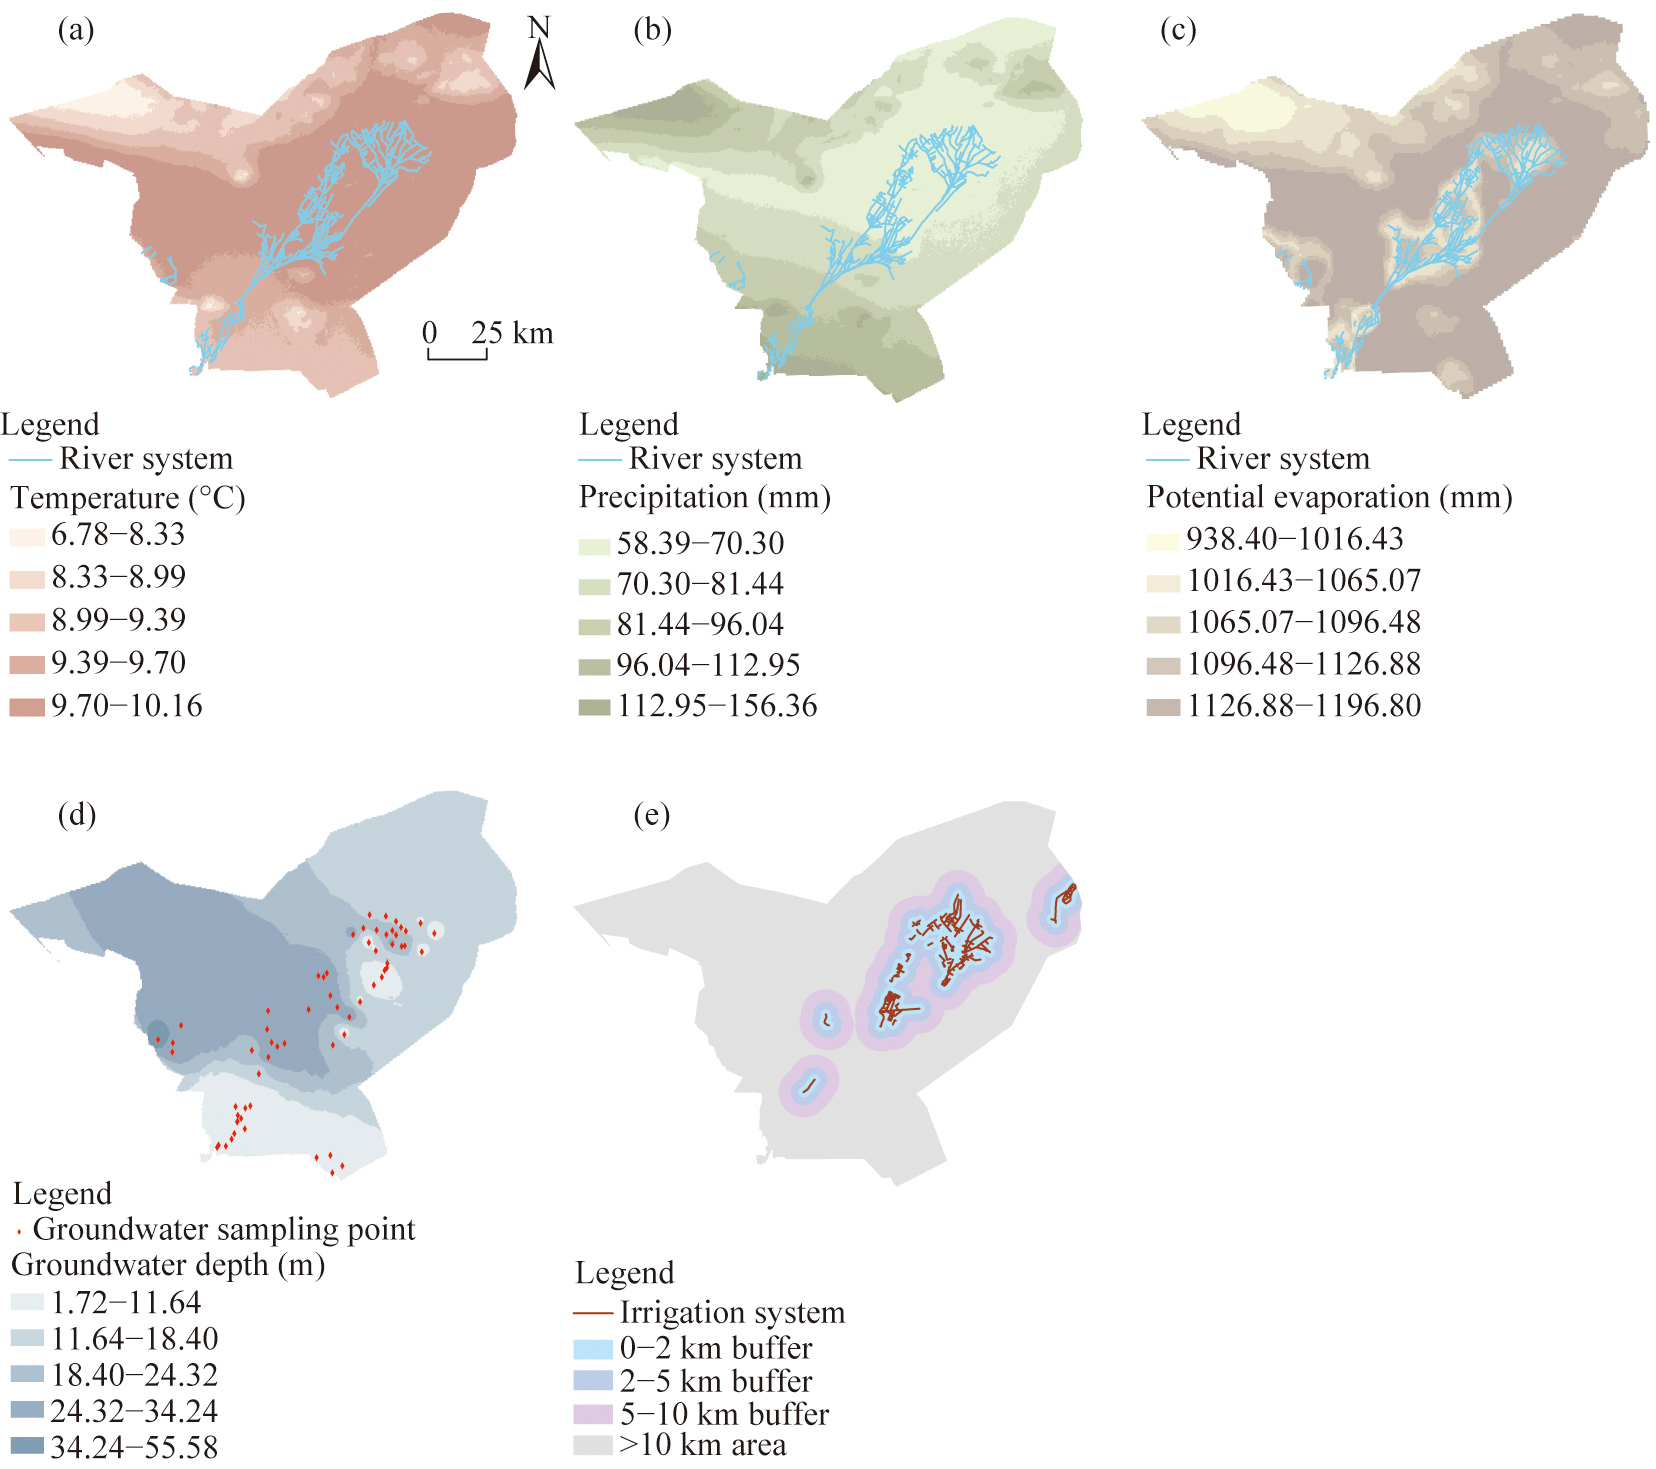
Fig. 10Spatial distribution correlation between impact factors and salinized soil. (a), spatial interpolation of temperature; (b), spatial interpolation of precipitation; (c), spatial interpolation of potential evaporation; (d), spatial interpolation of groundwater depth; (e), buffer zone of the irrigation channel.
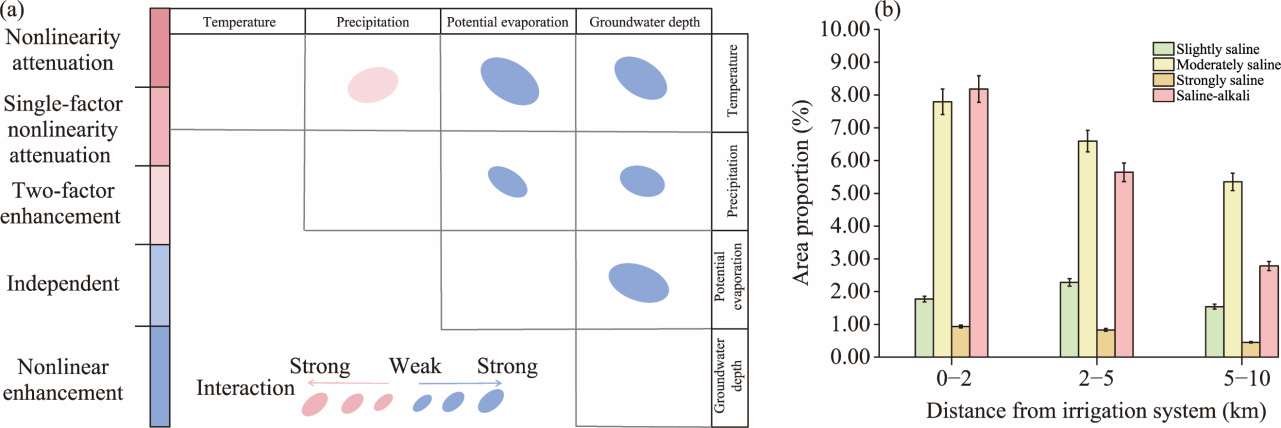
Fig. 11Driving factor analysis. (a), interactions between driving forces; (b), distributions of salinized soil at different distances from irrigation canals.
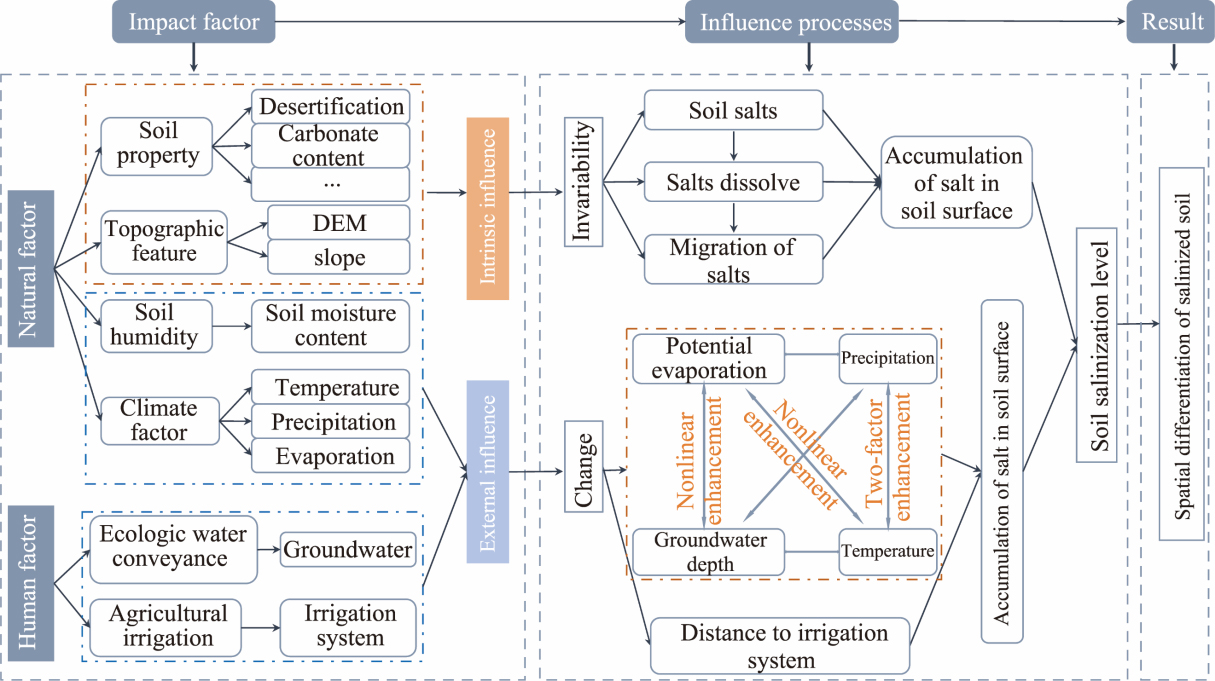
Fig. 12Mechanisms of the processes driving soil salinization
Coupling coordination index
Coordination level
Area proportion (%)
2017
2019
2021
2023
0.0≤D<0.1
Moderate uncoordinate
0.43
0.36
0.25
0.54
0.1≤D<0.4
Low uncoordinate
2.31
2.55
1.72
2.67
0.4≤D<0.7
Low coordinate
90.32
90.24
89.86
91.20
0.7≤D<0.9
Moderate coordinate
6.01
5.02
6.17
4.27
0.9≤D<1.0
High coordinate
0.93
1.83
2.00
1.32
Table 3 Classification standards for the degree of coupling coordination and the interannual variation in the area proportions of different classes
Fig. 13Spatial distribution characteristics of soil‒vegetation coupling coordination. (a), total area; (b), short vegetation (SV) area; (c), tree canopy (TV) area; (d), bara ground (BV) area. The blank areas in the Figure 13b‒d represent the types of land in non-corresponding scenarios.
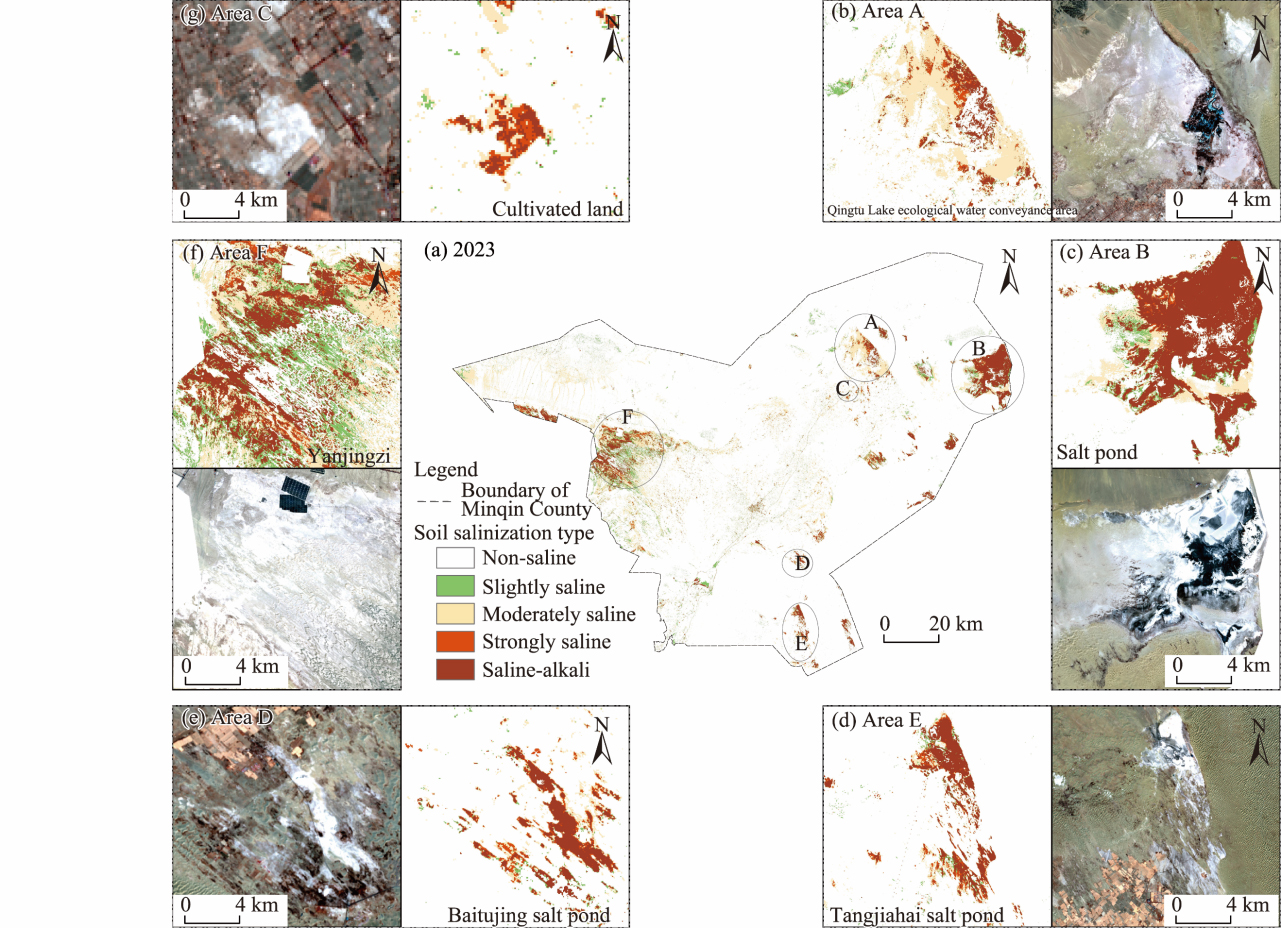
Fig. 14Soil salinization degree in different areas in the lower reaches of the Shiyang River Basin. (a), soil salinization distribution in the Minqin county in 2023; (b), area A (the ecological water transport area of Qingtu Lake); (c-e), areas B, D, and E (the salt pond areas); (f), area F (the Malian Spring salt pond); (g), area C (the irrigated farmland area).
[1]
Bai L, Wang C Z, Zang S Y, et al. 2016. Remote sensing of soil alkalinity and salinity in the Wuyu'er-Shuangyang River Basin, Northeast China. Remote Sensing, 8(2): 163, doi: 10.3390/rs8020163.
[2]
Chang X X, Zhang X W, Chen J, et al. 2023. Evolution characteristics and influencing factors of community resilience in inland Shiyang River Basin under ecological governance. Acta Ecologica Sinica, 43(14): 5699-5713. (in Chinese)
[3]
Cheng T T, Zhang J H, Zhang S, et al. 2022. Monitoring soil salinization and its spatiotemporal variation at different depths across the Yellow River Delta based on remote sensing data with multi-parameter optimization. Environmental Science and Pollution Research, 29(16): 24269-24285.
[4]
Datta A, Mandal A K, Yadav R K. 2019. Proper measurement of electrical conductivity and other parameters influence profile salinity and sodicity under different land uses. Ecological Indicators, 101: 1004-1006.
[5]
El Harti A, Lhissou R, Chokmani K, et al. 2016. Spatiotemporal monitoring of soil salinization in irrigated Tadla Plain (Morocco) using satellite spectral indices. International Journal of Applied Earth Observation and Geoinformation, 50: 64-73.
[6]
Guo B, Xu M, Zhang R. 2024. Evolution patterns and dominant factors of soil salinization in the Yellow River Delta based on long-time-series and similar phenological-fusion images. Remote Sensing, 16(17): 3332, doi: 10.3390/rs16173332.
[7]
Hassani A, Azapagic A, Shokri N. 2020. Predicting long-term dynamics of soil salinity and sodicity on a global scale. Proceedings of the National Academy of Sciences, 117(52): 33017-33027.
[8]
Hu H H, Ding H W, He B Y. 2016. Dynamic variation of groundwater level in the middle-lower reaches of Shiyanghe River Basin for nearly 40 years. Northwestern Geology, 49(3): 164-174. (in Chinese)
[9]
Ivushkin K, Bartholomeus H, Bregt A K, et al. 2019. Global mapping of soil salinity change. Remote Sensing of Environment, 231: 111260, doi: 10.1016/j.rse.2019.111260.
[10]
Jia J J, Zhao J, Wang J B, et al. 2020. Ecological vulnerability assessment of Shiyang River Basin based on SRP model. Journal of Arid Land Resources Environment, 34(1): 34-41. (in Chinese)
[11]
Li X W. 2007. The first law of geography and spatial-temporal proximity. Chinese Journal of Nature, 29(2): 69-71.
[12]
Meng Y, Lin C, Cui W H, et al. 2014. Scale selection based on Moran's I for segmentation of high resolution remotely sensed images. IEEE Geoscience and Remote Sensing Symposium (GRSS), Quebec: GRSS, 4895-4898.
[13]
Mery N, Maleki M, País G, et al. 2025. Fuzzy classification of mineral resources: moving toward overlapping categories to account for geological, economic, metallurgical, environmental, and operational criteria. Natural Resources Research, 34(3): 1271-1299.
[14]
Qiao B, Fang C L. 2005. The dynamic coupling model of the harmonious development between urbanization and ecoenvironment and its application in arid area. Acta Ecologica Sinica, 25(11): 3003-3009. (in Chinese)
[15]
Shi W L, Liu S J, Liu S Z, et al. 2017. Influence analysis of artificial water transfer on the regional ecological environment of Qingtu Lake in the lower reaches of the Shiyang River. Acta Ecologica Sinica, 37(18): 5951-5960. (in Chinese)
[16]
Singh K. 2016. Microbial and enzyme activities of saline and sodic soils. Land Degradation & Development, 27(3): 706-718.
[17]
Song X P, Hansen M C, Stehman S V, et al. 2018. Global land change from 1982 to 2016. Nature, 560(7720): 639-643.
[18]
Tegegne A M, Lohani T K, Eshete A A. 2024. Groundwater potential delineation using geodetector based convolutional neural network in the Gunabay watershed of Ethiopia. Environmental Research, 242: 117790, doi: 10.1016/j.envres.2023.117790.
[19]
Tufail R, Tassinari P, Torreggiani D. 2025. Assessing feature extraction, selection, and classification combinations for crop mapping using Sentinel-2 time series: A case study in northern Italy. Remote Sensing Applications: Society and Environment, 38: 101525, doi: 10.1016/j.rsase.2025.101525.
[20]
Wang F, Han L L, Liu L L, et al. 2024. Advancements and perspective in the quantitative assessment of soil salinity utilizing remote sensing and machine learning algorithms: A review. Remote Sensing, 16(24): 4812, doi: 10.3390/rs16244812.
[21]
Wang J F, Xu C D. 2017. Geodetector: Principle and prospective. Acta Geographica Sinica, 72(1): 116-134.
[22]
Wang J J, Wu F, Shang J L, et al. 2022. Saline soil moisture mapping using Sentinel-1A synthetic aperture radar data and machine learning algorithms in humid region of China's east coast. CATENA, 213: 106189, doi: 10.1016/j.catena.2022.106189.
[23]
Wang Y C, Zhao J, Fu J W. 2021. Impacts of farmland conversion projects on ecosystem services in arid inland river basins. Ecological Sciences, 40(6): 56-66. (in Chinese)
[24]
Wang Y X, Hao Y Y, Yang J S, et al. 2025. Characterization of spatial and temporal changes in NPP and driving force in the Minqin Basin from 2000 to 2020. Pratacultural Science, 42(6): 1391-1402. (in Chinese)
[25]
Wei Y X, Chen L J, Xi H Y, et al. 2023. Spatial differentiation of soil moisture and conductivity in Shiyang River Basin. Journal of Desert Research, 43(3): 264-273. (in Chinese)
[26]
Wu W C, Muhaimeed A S, Al-Shafie W M, et al. 2019. Using L-band radar data for soil salinity mapping-a case study in Central Iraq. Environmental Research Communications, 1(8): 081004, doi: 10.1088/2515-7620/ab37f0.
[27]
Wu X Y, Zhang Y J, Li X Y. 2024. Exploring the relationship between urbanization and eco-environment using dynamic coupling coordination degree model: Case study of Beijing-Tianjin-Hebei urban Agglomeration, China. Land, 13(6): 850, doi: 10.3390/land13060850.
[28]
Wu Y R, Wang W Z, Zhao S J, et al. 2015. Dielectric properties of saline soils and an improved dielectric model in C-band. IEEE Transactions on Geoscience and Remote Sensing, 53(1): 440-452.
[29]
Xiao Y, Hu W X, Zhang Y Q, et al. 2025. Spatiotemporal variation and driving forces of soil salinization in the lower reach of arid endorheic basins: Critical role of lake system and groundwater overflow. Agricultural Water Management, 315: 109568, doi: 10.1016/j.agwat.2025.109568.
[30]
Xie W F, Li J K, Peng K, et al. 2024. The application of local Moran's I and Getis-Ord Gi* to identify spatial patterns and critical source areas of agricultural nonpoint source pollution. Journal of Environmental Engineering, 150(5): 04024011, doi: 10.1061/JOEEDU.EEENG-7585.
[31]
Yang H, Xiong H G, Chen X G, et al. 2015. Identifying the influence of urbanization on soil organic matter content and pH from soil magnetic characteristics. Journal of Arid Land, 7(6): 820-830.
[32]
Yang J X, Zhao J, Zhu G F, et al. 2020. Soil salinization in the oasis areas of downstream inland rivers-Case study: Minqin oasis. Quaternary International, 537: 69-78.
[33]
Yang J X, Zhao J, Zhu G F, et al. 2023. Spatial coupling characteristics and factors influencing soil-vegetation relationships in the lower part of the Shiyang River Basin. Land, 12(3): 558, doi: 10.3390/land12030558.
[34]
Yang J X, Zhao J, Mao X F, et al. 2025. Applicability analysis of weakly supervised semantic segmentation for identifying salinized soil boundaries. Journal of Arid Environments, 229: 105372, doi: 10.1016/j.jaridenv.2025.105372.
[35]
Yee K M, Mu M T, Lint K, et al. 2018. The anselin local Moran's I analysis on the human activities of land surface temperature changes in Yangon City. In:39th Asian Conference on Remote Sensing (ACRS). Kuala Lumpur, Malaysia, 17-24.
[36]
Zhang Z H, Song Y Z, Wu P. 2022. Robust geographical detector. International Journal of Applied Earth Observation and Geoinformation, 109: 102782, doi: 10.1016/j.jag.2022.102782.
[37]
Zhao J, Yang J X, Zhu G F. 2018. Effect of ecological water conveyance on vegetation coverage in surrounding area of the Qingtu Lake. Arid Zone Research, 35(6): 1251-1261. (in Chinese)
[38]
Zhu S C, Huang J L, Zhao Y L. 2022. Coupling coordination analysis of ecosystem services and urban development of resource-based cities: A case study of Tangshan City. Ecological Indicators, 136: 108706, doi: 10.1016/j.ecolind.2022.108706.