Evaluation of long-term climate dynamic variations across Uzbekistan using multi-source datasets
ZHUO Ruina1, ZHANG Xian2, ZHANG Zhuo3,4,5, ZHENG Xiaowei6, NI Xiaohua1, Nazrullozoda SULAIMON7, ZHANG Qianqian1,8, HU Zengyun()
1School of Public Health, Shanghai Jiao Tong University School of Medicine, Shanghai 200025, China 2School of Public Health, Zhengzhou University, Zhengzhou 450001, China 3State Key Laboratory of Ecological Safety and Sustainable Development in Arid Lands, Xinjiang Institute of Ecology and Geography, Chinese Academy of Sciences, Urumqi 830011, China 4Research Center for Ecology and Environment of Central Asia, Chinese Academy of Sciences, Urumqi 830011, China 5University of Chinese Academy of Sciences, Beijing 100049, China 6School of Global Health, Chinese Center for Tropical Diseases Research, Shanghai Jiao Tong University School of Medicine, Shanghai 200025, China 7Institute of Veterinary Medicine of the Tajik Academy of Agricultural Sciences, Dushanbe 734003, Tajikistan 8Department of Geography and Resource Management, The Chinese University of Hong Kong, Hong Kong 999077, China
Uzbekistan is a core country of the Silk Road Economic Belt; thus, its long-term climate variations play key roles in achieving the objectives set by Sustainable Development Goal 13 (SDG-13) to address climate change and its impacts. This study utilized temperature and precipitation data from 32 meteorological stations across Uzbekistan (1950-2023), Climatic Research Unit Time-Series (CRU-TS) version 4.08 (1901-2023), European Center for Medium-Range Weather Forecasts (ECMWF) Reanalysis 5th Generation (ERA5) (1950-2022), and Modern-Era Retrospective analysis for Research and Applications, version 2 (MERRA2) (1980-2024) to thoroughly investigate the spatiotemporal characteristics of temperature and precipitation in Uzbekistan from 1901 to 2024. The Distance between Indices of Simulation and Observation (DISO) metric was employed to evaluate the accuracy of the gridded datasets, and the Mann-Kendall method was implemented to analyze the linear trends of temperature and precipitation. Results indicated that ERA5 temperature data are the most consistent with the observed temperature data, whereas CRU-TS data perform best in determining long-term precipitation variability. The century-scale trend represented by the CRU-TS data showed significant warming at a rate of nearly 0.17°C/10a, exceeding the Northern Hemisphere average. Uzbekistan showed no clear upward trend in precipitation during 1901-2023. Rapid warming and heightened interannual precipitation variability were observed in ERA5 (1950-2022) and MERRA2 (1980-2024) over their respective coverage periods. CRU-TS, ERA5, and MERRA2 data all revealed a shift of the warming center from the Aral Sea Basin to the central and southeastern regions of Uzbekistan. Nevertheless, the Aral Sea Basin remained in the core warming zone, with CRU-TS data indicating a centennial warming rate of 0.16°C/10a-0.20°C/10a. The precipitation patterns revealed a complex "wetter southeast and drier central-west" and "wetter summer and drier autumn-winter" dichotomy. These findings could enhance the understanding of long-term climate change in Uzbekistan and provide a scientific foundation for implementing SDG-13 to mitigate the impacts of climate change in the region.
Received: 08 October 2025
Published: 31 October 2026
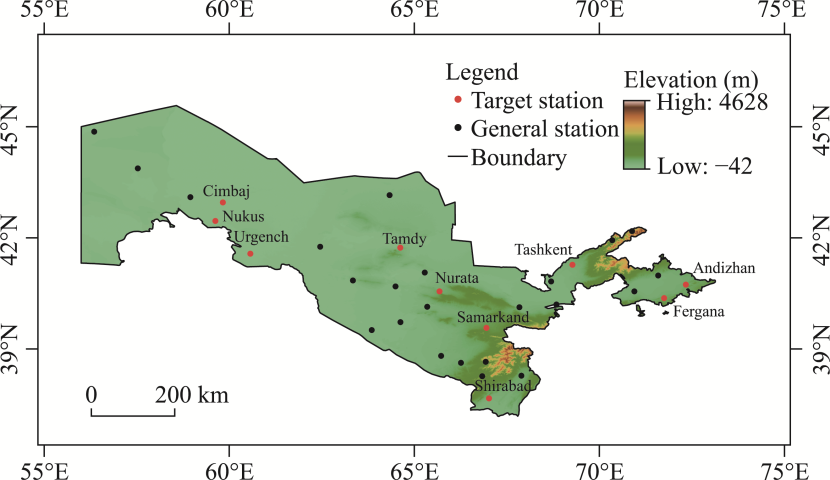
Fig. 1Overview of the study area based on the elevation data and spatial distribution of meteorological stations
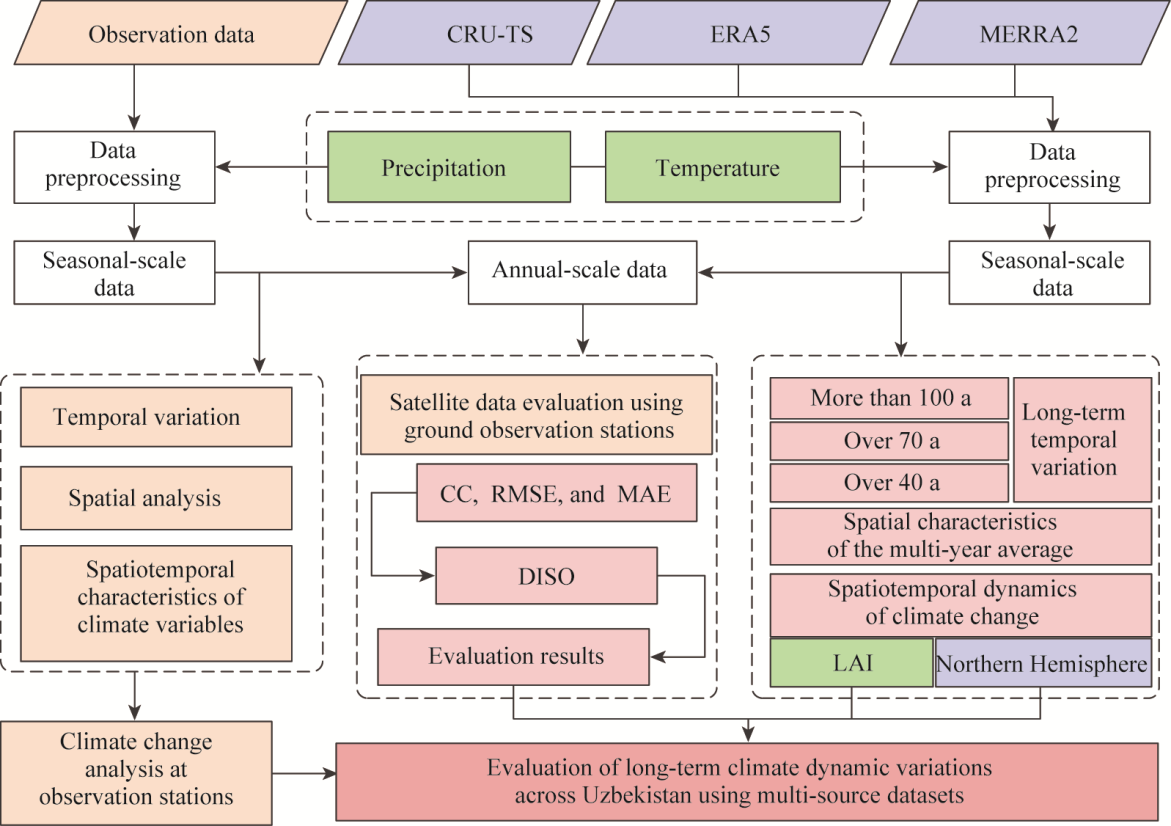
Fig. 2Technical workflow for analyzing long-term climate dynamic variations in Uzbekistan using multiple climate datasets. CRU-TS, Climatic Research Unit Time-Series; ERA5, European Center for Medium-Range Weather Forecasts (ECMWF) Reanalysis 5th Generation; MERRA2, Modern-Era Retrospective analysis for Research and Applications, version 2; CC, correlation coefficient; MAE, mean absolute error; RMSE, root mean square error; DISO, Distance Index between Simulation and Observation; LAI, leaf area index.
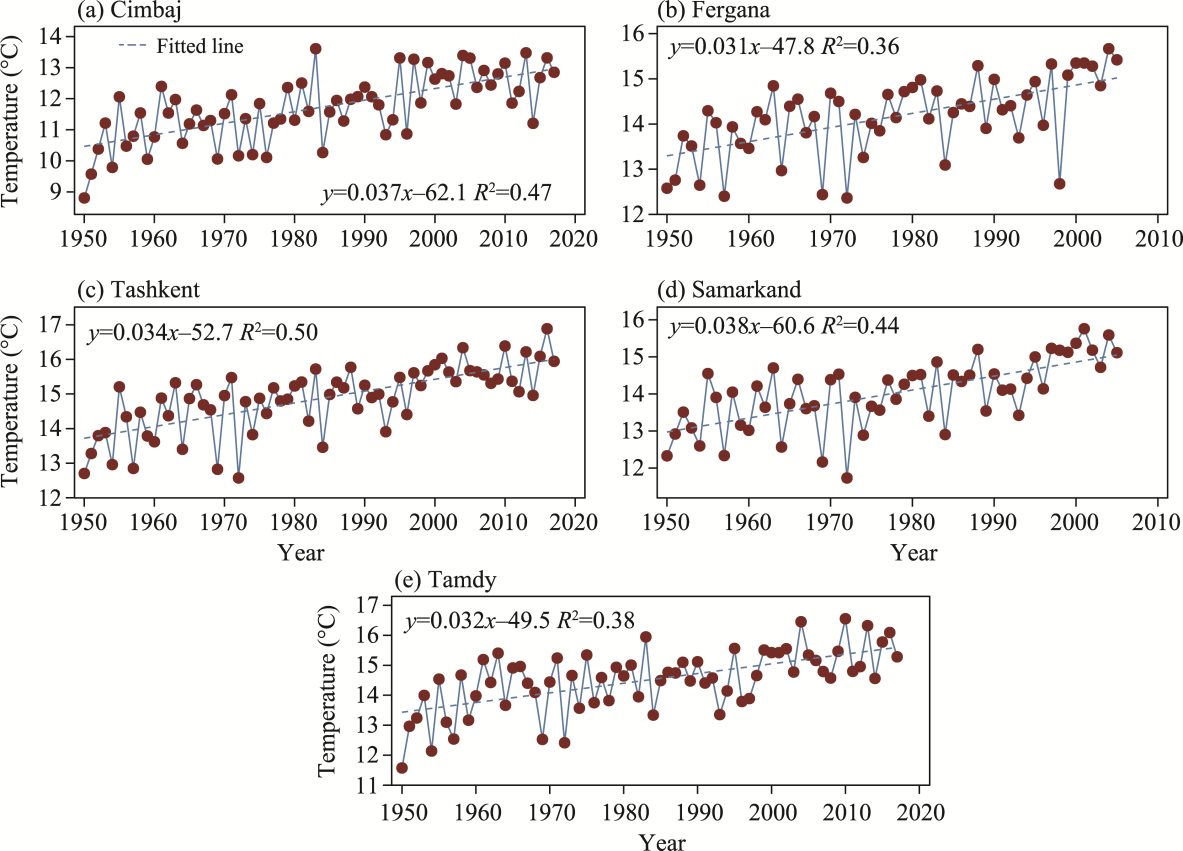
Fig. 3Temporal variation in annual mean temperature for five stations in Uzbekistan during 1950-2017. (a), Cimbaj; (b), Fergana; (c), Tashkent; (d), Samarkand; (e), Tamdy.
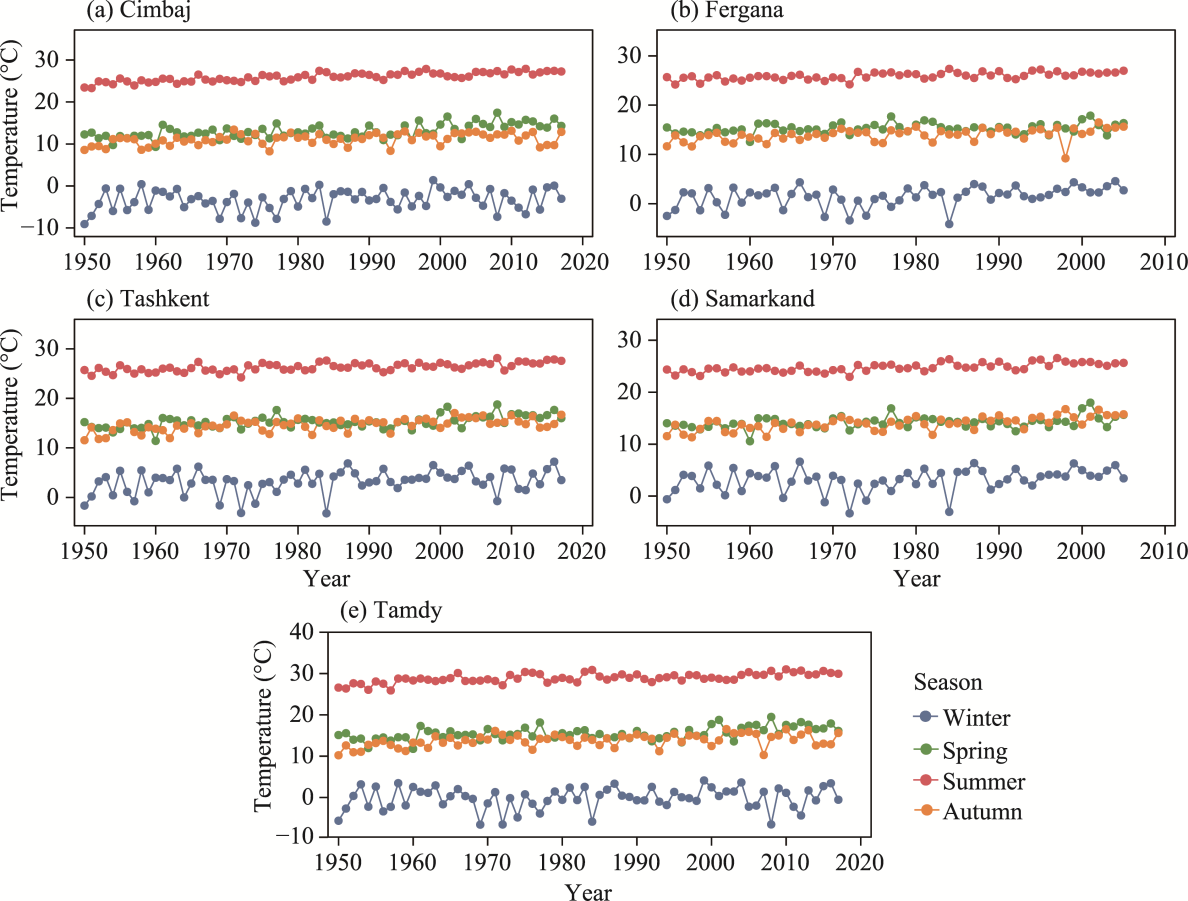
Fig. 4Temporal variation in seasonal mean temperature for five stations in Uzbekistan during 1950-2017. (a), Cimbaj; (b), Fergana; (c), Tashkent; (d), Samarkand; (e), Tamdy.
Station
Season
Linear fitting equation
P
R2
Mean (°C)
SD (°C)
CV (%)
Cimbaj
Spring
y=0.050x-85.9
<0.001
0.36
13.03
1.64
12.59
Summer
y=0.045x-63.6
<0.001
0.68
25.98
1.08
4.17
Autumn
y=0.027x-43.0
<0.001
0.16
11.13
1.33
11.98
Winter
y=0.027x-55.9
0.090
0.04
-3.29
2.53
-76.91
Fergana
Spring
y=0.018x-19.3
0.033
0.08
15.31
1.00
6.55
Summer
y=0.028x-28.5
<0.001
0.38
25.94
0.73
2.82
Autumn
y=0.035x-55.1
<0.001
0.20
13.95
1.28
9.15
Winter
y=0.048x-94.1
0.003
0.15
1.46
2.05
139.86
Tashkent
Spring
y=0.034x-51.6
<0.001
0.29
15.29
1.24
8.14
Summer
y=0.028x-30.0
<0.001
0.42
26.32
0.86
3.28
Autumn
y=0.037x-58.3
<0.001
0.33
14.64
1.26
8.63
Winter
y=0.037x-71.1
0.008
0.10
3.20
2.33
73.02
Samarkand
Spring
y=0.025x-34.8
0.008
0.13
14.17
1.14
8.07
Summer
y=0.036x-46.9
<0.001
0.49
24.78
0.84
3.40
Autumn
y=0.053x-90.9
<0.001
0.44
13.99
1.30
9.30
Winter
y=0.037x-69.8
0.043
0.07
3.11
2.21
71.16
Tamdy
Spring
y=0.040x-64.7
<0.001
0.28
15.53
1.51
9.75
Summer
y=0.038x-47.0
<0.001
0.45
28.93
1.13
3.91
Autumn
y=0.034x-53.9
<0.001
0.20
13.82
1.50
10.86
Winter
y=0.018x-35.1
0.288
0.02
-0.17
2.66
-
Table 1 Seasonal mean temperature trends at five stations in Uzbekistan
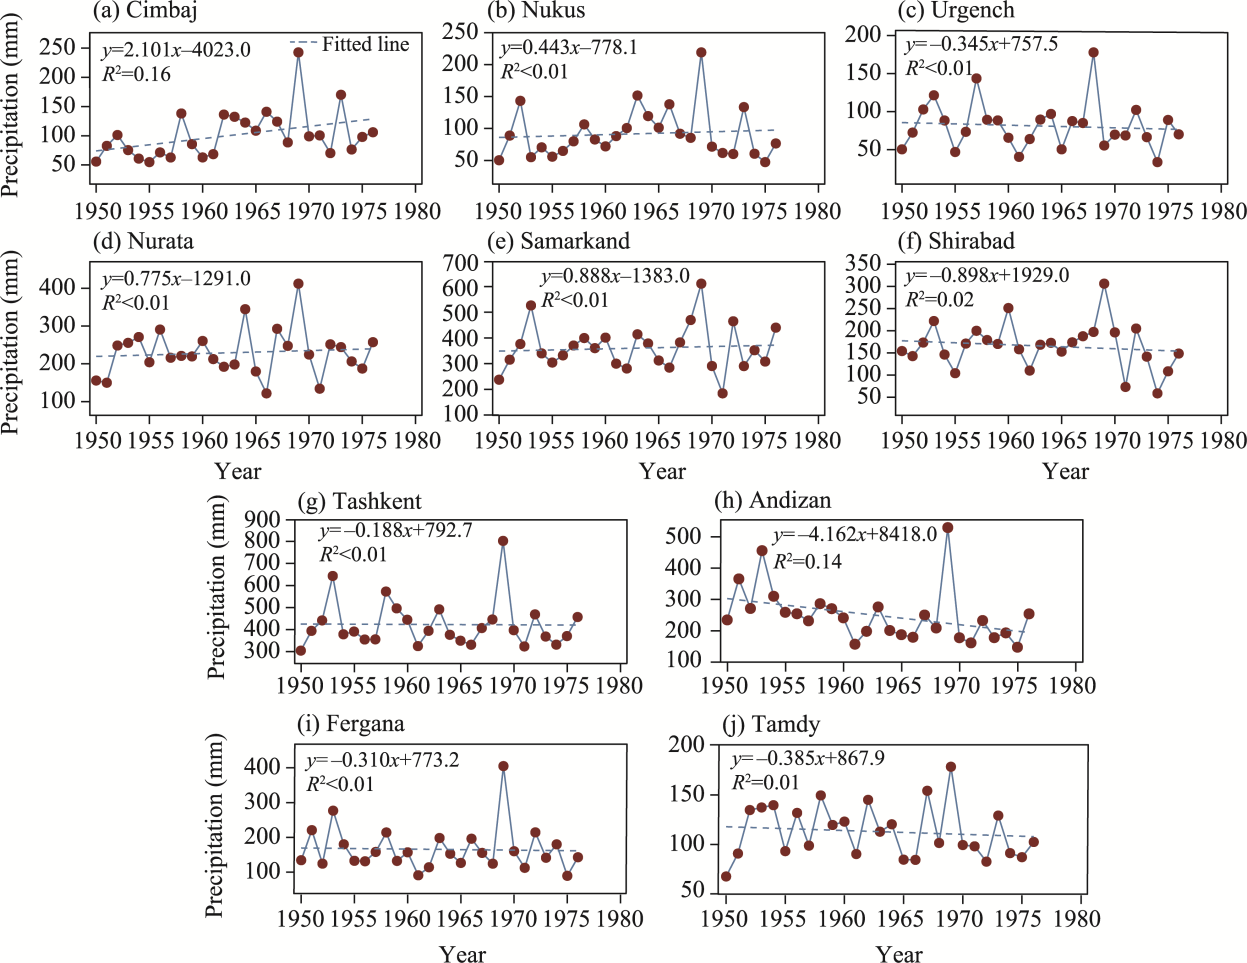
Fig. 5Temporal variation in annual precipitation at ten stations in Uzbekistan during 1950-1976. (a), Cimbaj; (b), Nukus; (c), Urgench; (d), Nurata; (e), Samarkand; (f), Shirabad; (g), Tashkent; (h), Andizan; (i), Fergana; (j), Tamdy.
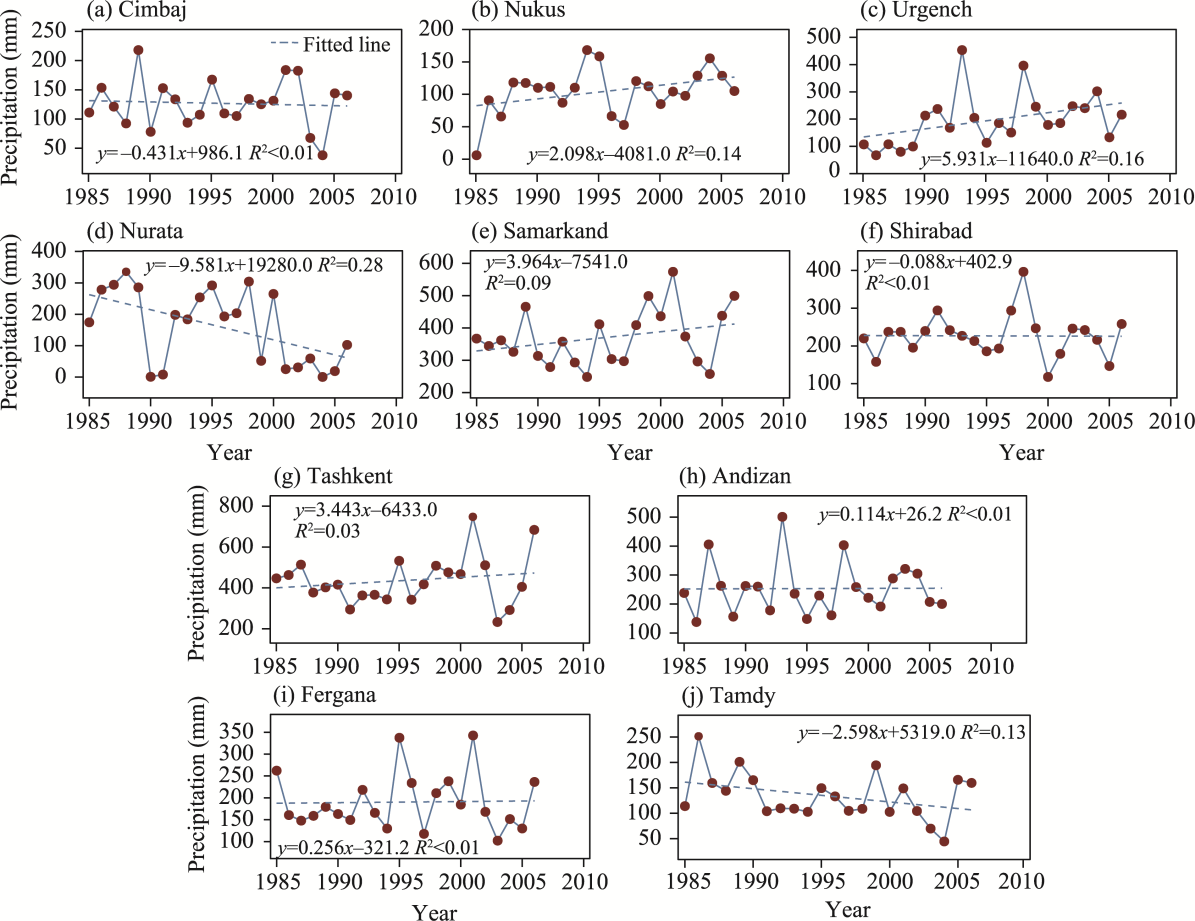
Fig. 6Temporal variation in annual precipitation at ten stations in Uzbekistan during 1985-2006. (a), Cimbaj; (b), Nukus; (c), Urgench; (d), Nurata; (e), Samarkand; (f), Shirabad; (g), Tashkent; (h), Andizan; (i), Fergana; (j), Tamdy.
Station
Season
Mean (mm)
Slope (mm/a)
P
Station
Season
Mean (mm)
Slope (mm/a)
P
Cimbaj
Spring
51.59
0.56
0.043
Tashkent
Spring
170.92
0.03
0.959
Summer
11.08
0.11
0.216
Summer
3.10
0.15
0.940
Autumn
21.92
0.25
0.047
Autumn
17.49
0.16
0.685
Winter
32.80
0.18
0.169
Winter
85.30
0.90
0.010
Nukus
Spring
39.69
0.25
0.287
Andizan
Spring
87.60
-0.24
0.546
Summer
8.32
-0.05
0.511
Summer
17.55
-0.01
0.346
Autumn
19.16
0.21
0.192
Autumn
79.55
-0.13
0.528
Winter
30.97
0.19
0.226
Winter
165.21
0.93
0.680
Urgench
Spring
50.22
1.07
<0.001
Fergana
Spring
65.55
0.29
0.196
Summer
11.47
0.28
0.006
Summer
20.37
-0.16
0.383
Autumn
24.63
0.98
0.001
Autumn
54.72
-0.28
0.700
Winter
48.53
1.68
<0.001
Winter
88.10
0.15
0.198
Nurata
Spring
113.16
0.70
0.520
Tamdy
Spring
53.44
-0.17
0.488
Summer
6.22
0.11
0.502
Summer
16.99
0.10
0.504
Autumn
32.37
0.40
0.354
Autumn
38.52
0.10
0.490
Winter
84.75
0.45
0.408
Winter
58.92
0.28
0.372
Samarkand
Spring
170.22
-0.14
0.803
Shirabad
Spring
87.11
0.48
0.193
Summer
9.59
0.02
0.772
Summer
8.22
0.06
0.053
Autumn
55.42
0.07
0.806
Autumn
17.51
0.07
0.311
Winter
128.45
0.46
0.111
Winter
41.74
0.14
0.011
Table 2 Seasonal precipitation trends at ten stations in Uzbekistan during 1950-2023
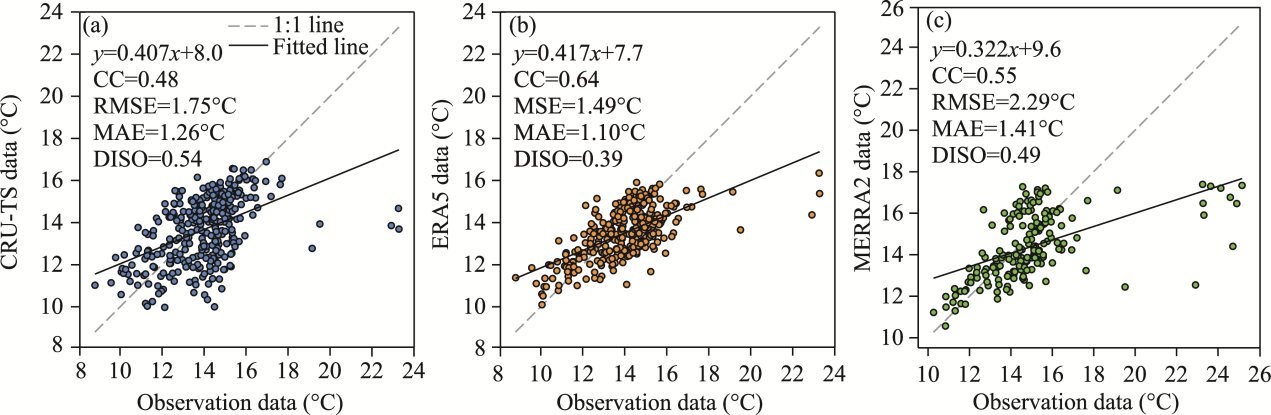
Fig. 7Comparisons of CRU-TS (a), ERA5 (b), and MERRA2 (c) with station observations for annual mean temperature
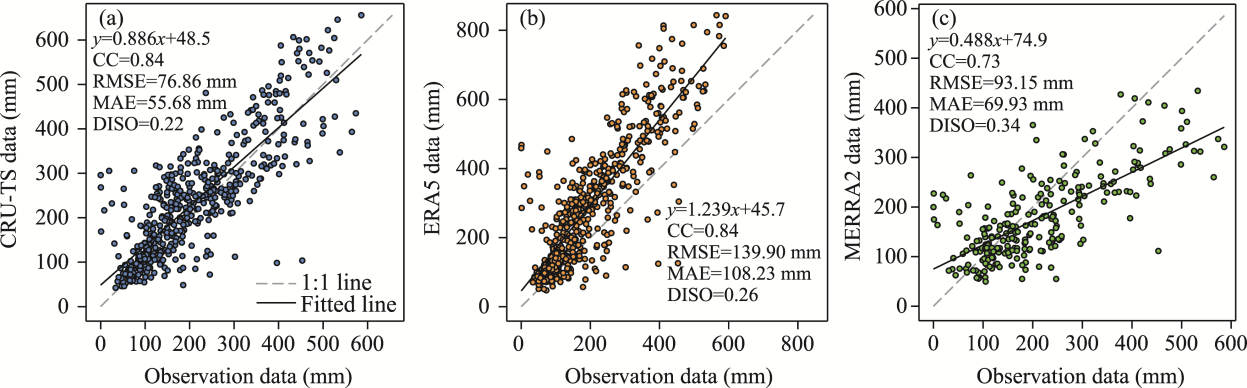
Fig. 8Comparisons of CRU-TS (a), ERA5 (b), and MERRA2 (c) with station observations for annual precipitation
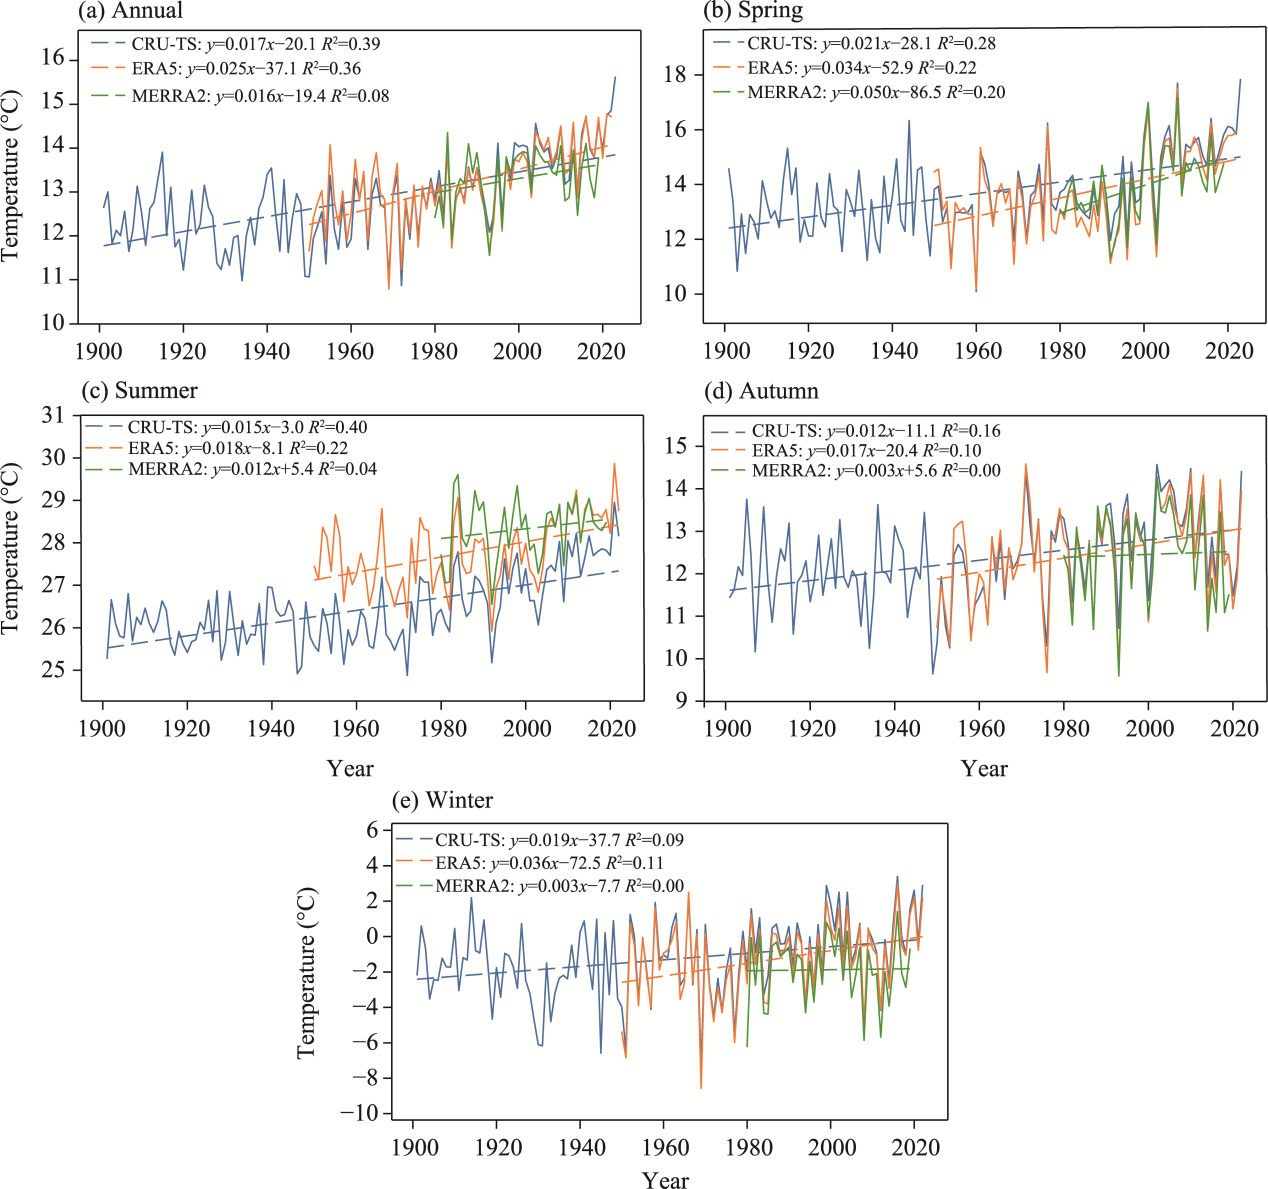
Fig. 9Temporal variations in annual mean temperature (a) and seasonal mean temperatures (b-e) in Uzbekistan based on CRU-TS, ERA5, and MERRA2 datasets
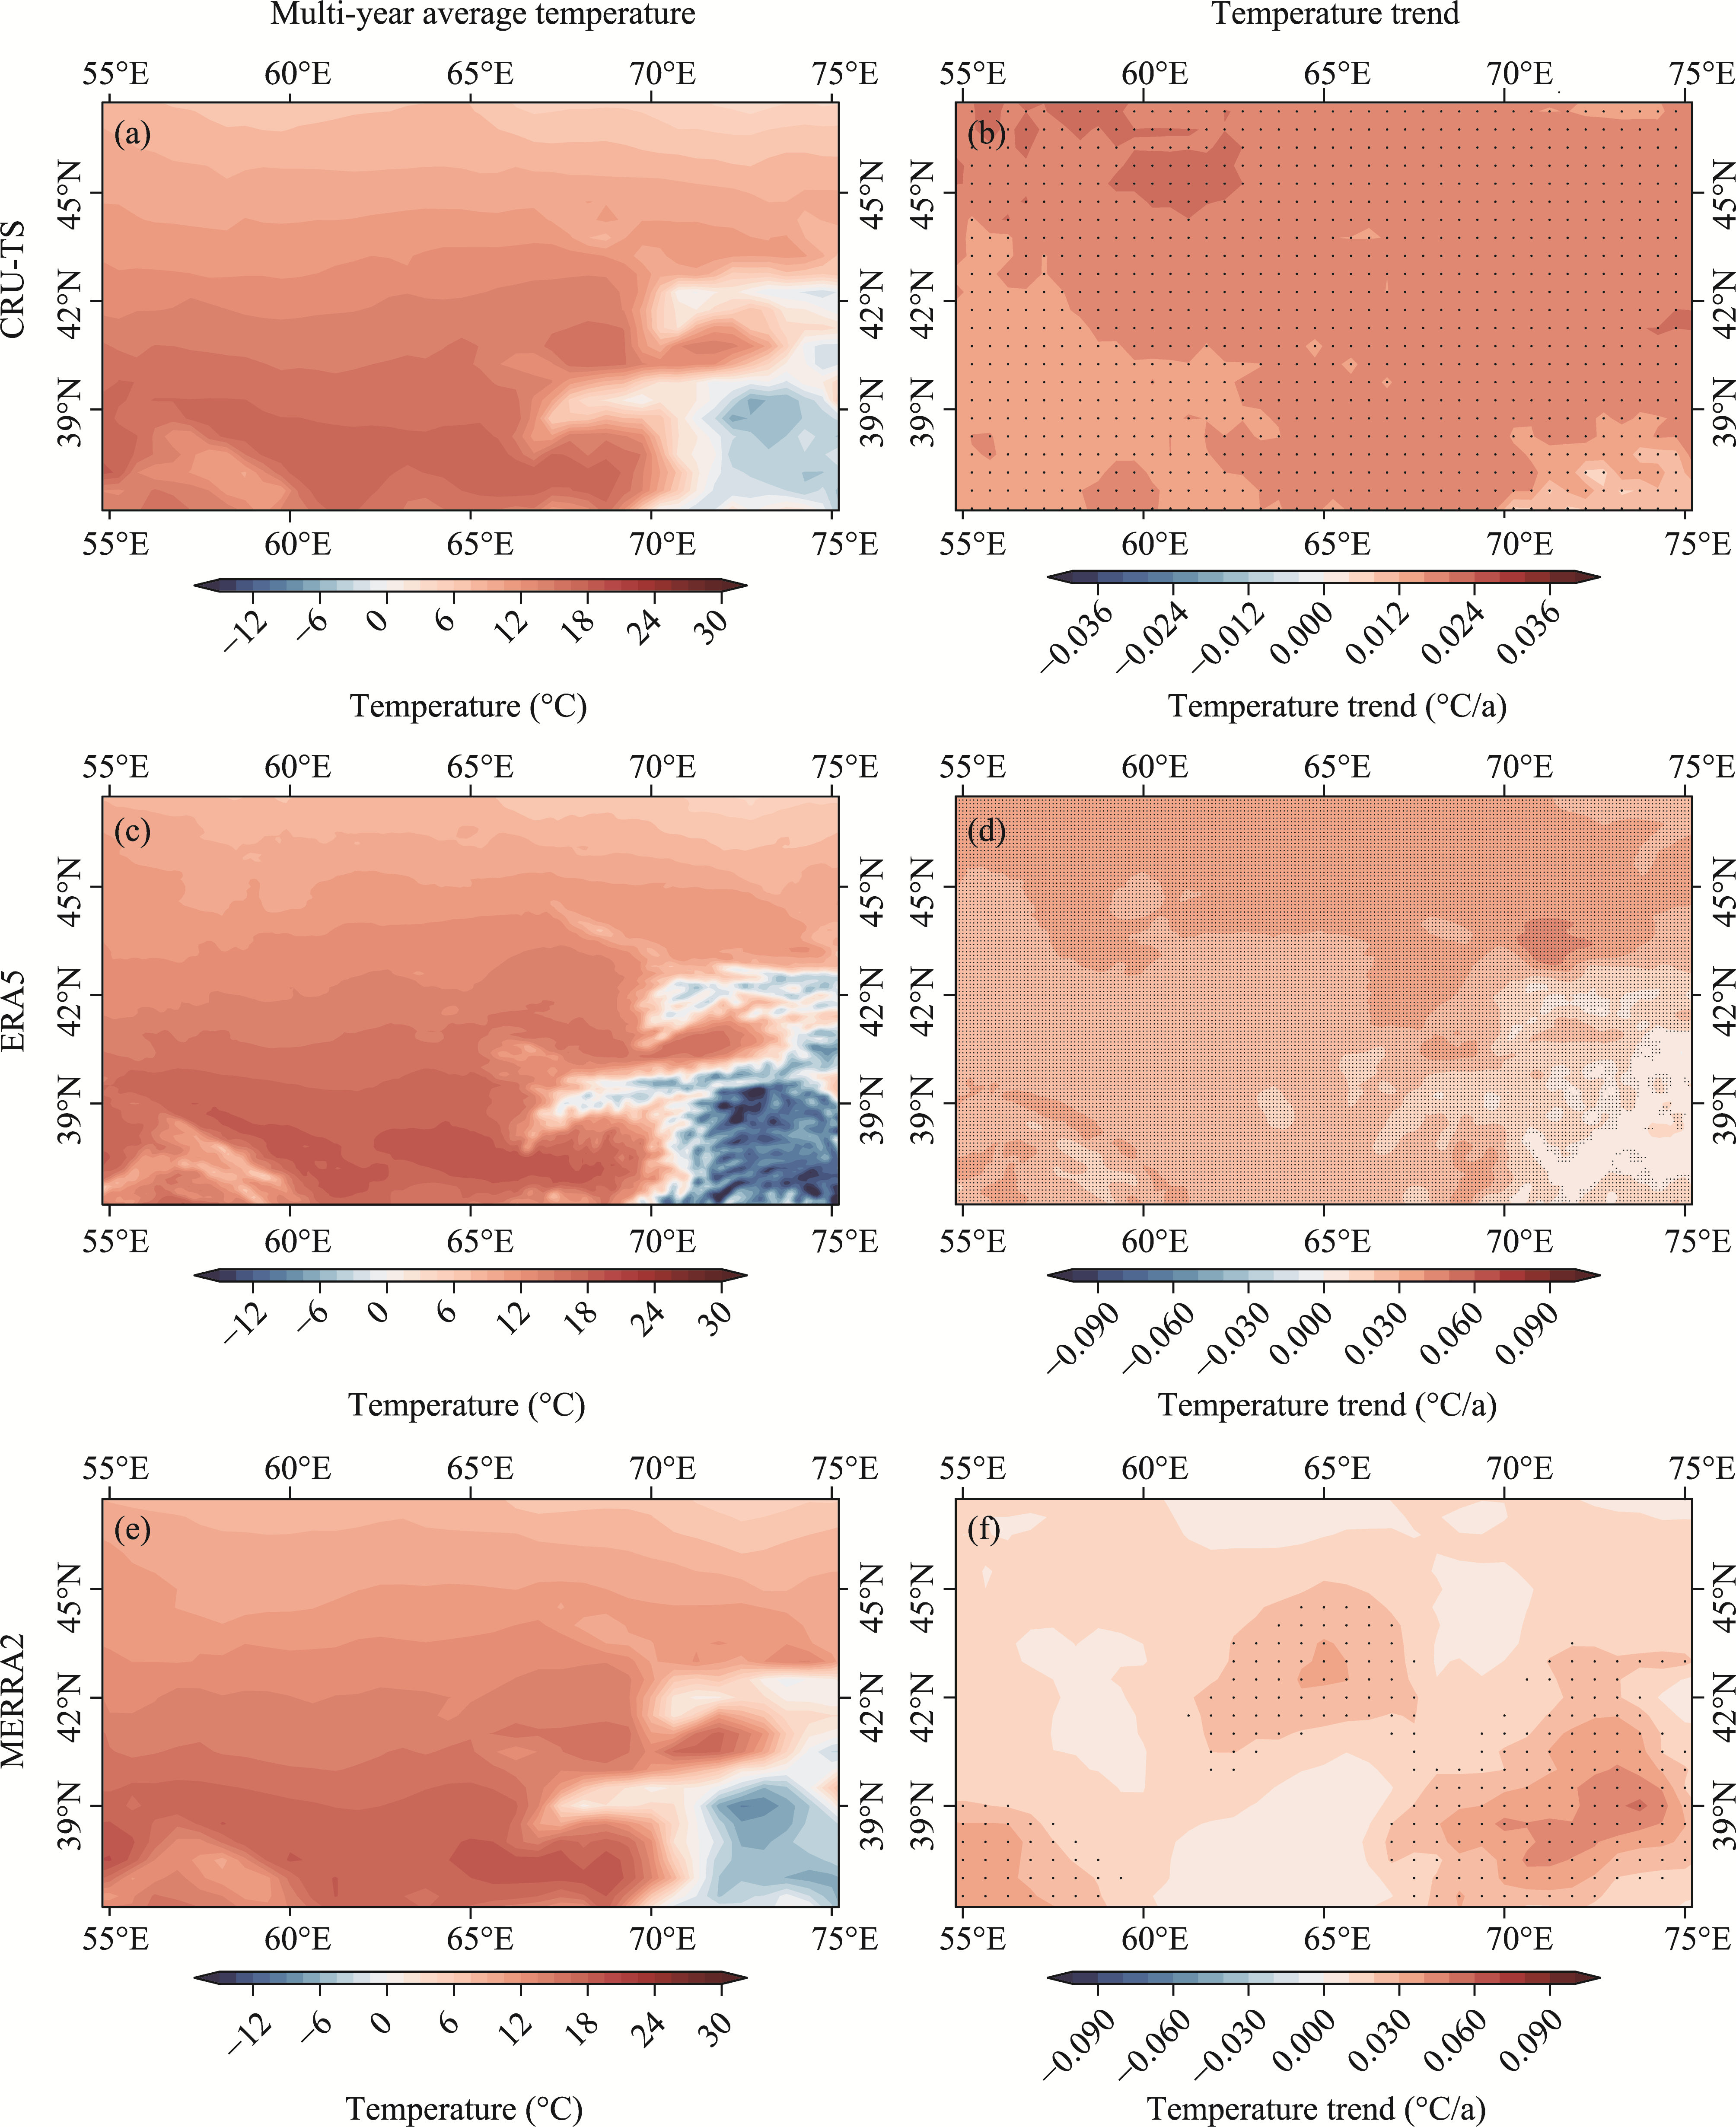
Fig. 10Spatial distributions of multi-year average temperature and annual mean temperature trends based on CRU-TS (a and b), ERA5 (c and d), and MERRA2 (e and f) datasets. Black dots indicate trends significant at the P<0.050 level.
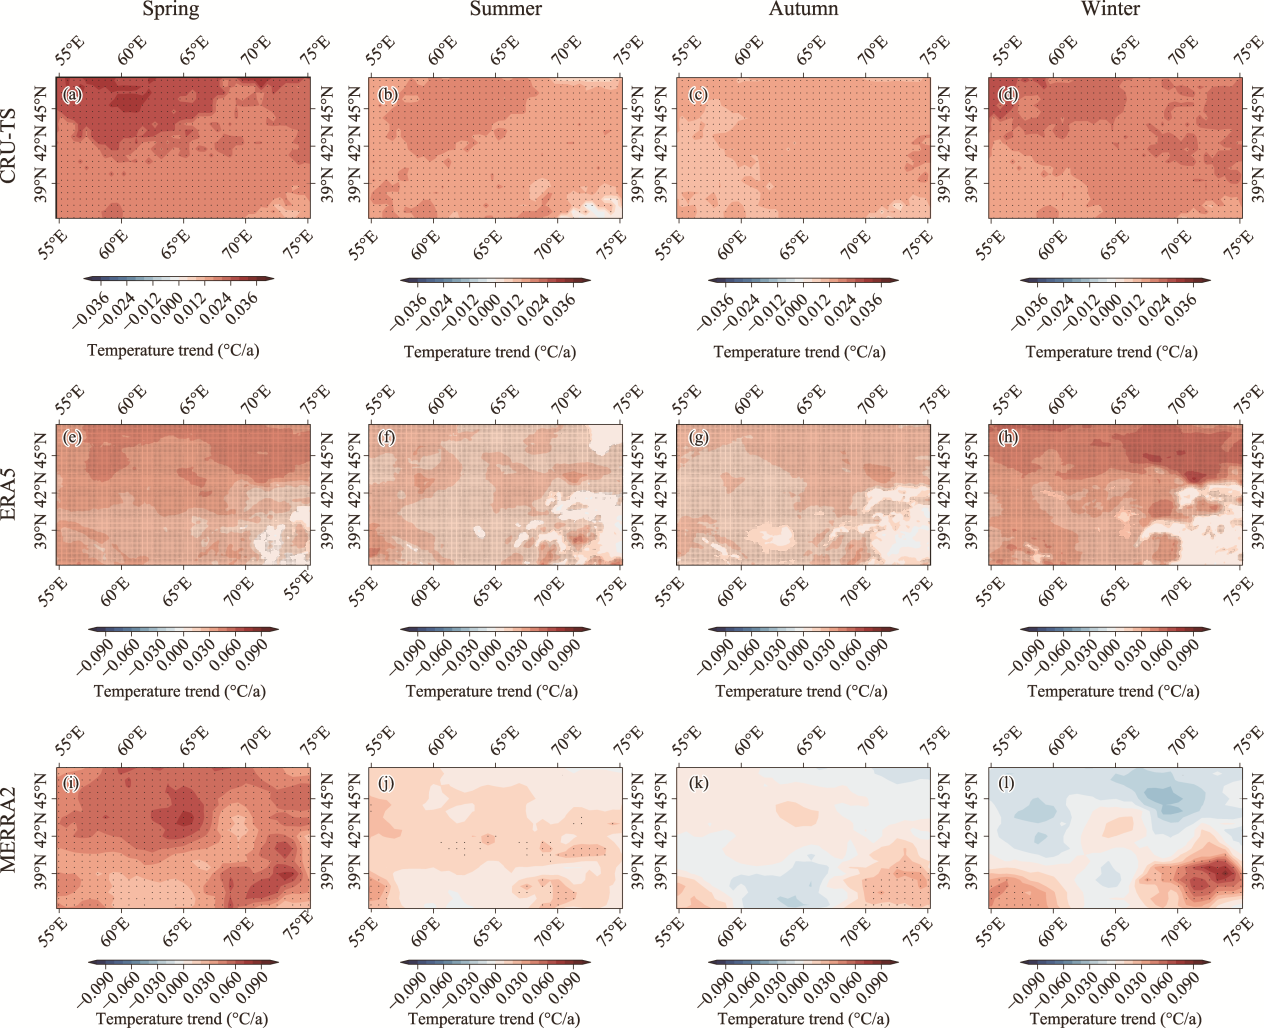
Fig. 11Spatial distribution of seasonal mean temperature trends based on CRU-TS (a-d), ERA5 (e-h), and MERRA2 (i-l) datasets. Black dots indicate trends significant at the P<0.050 level.
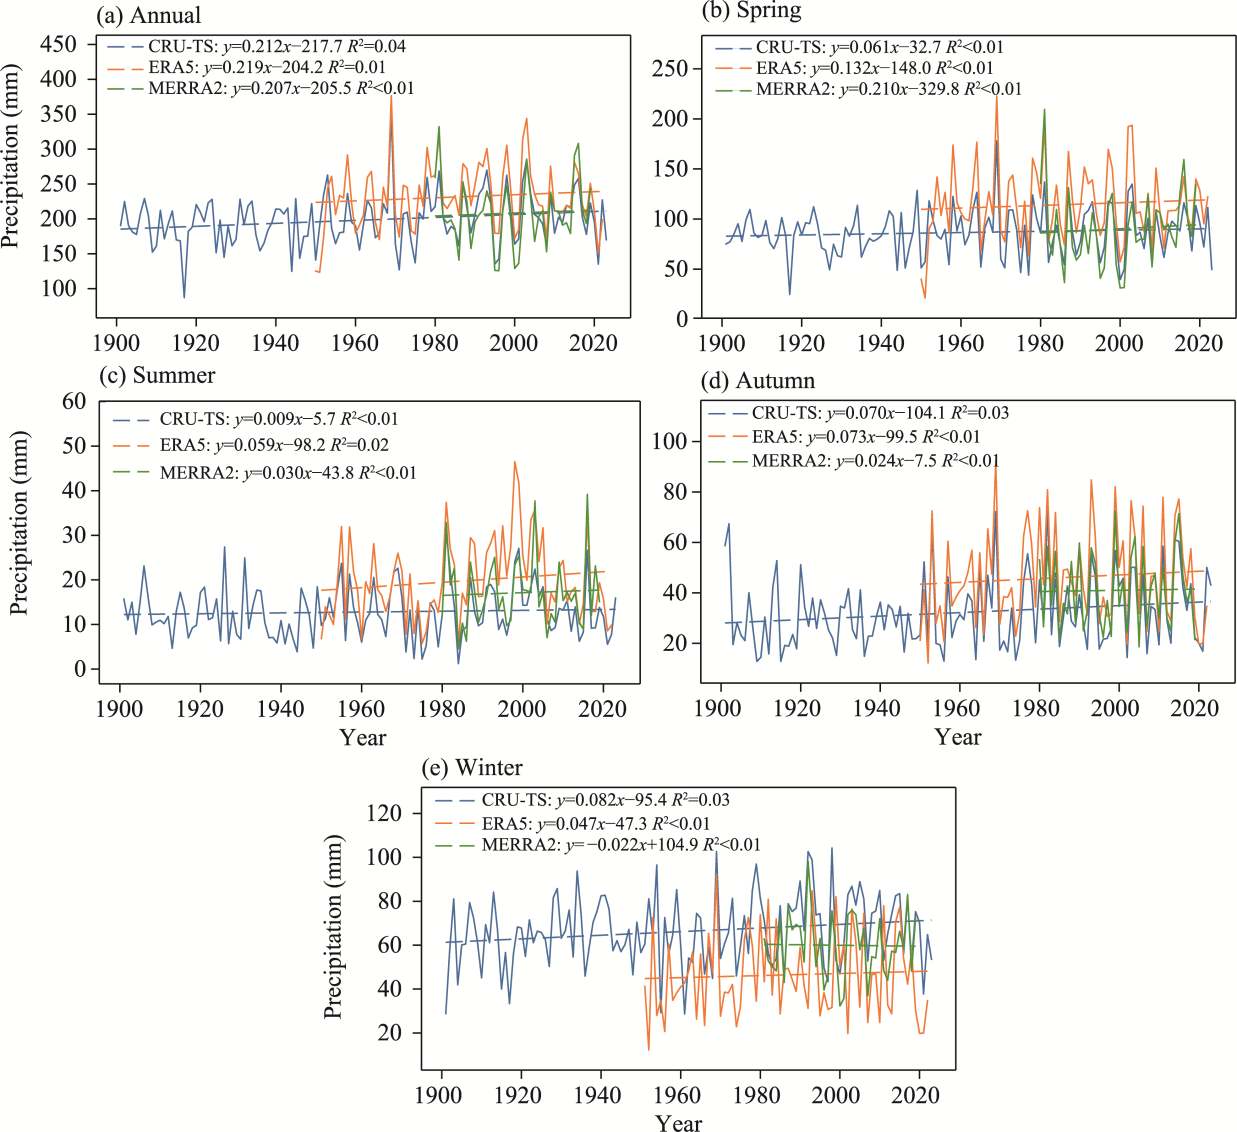
Fig. 12Temporal variations in annual precipitation (a) and seasonal precipitation (b-e) in Uzbekistan based on CRU-TS, ERA5, and MERRA2 datasets
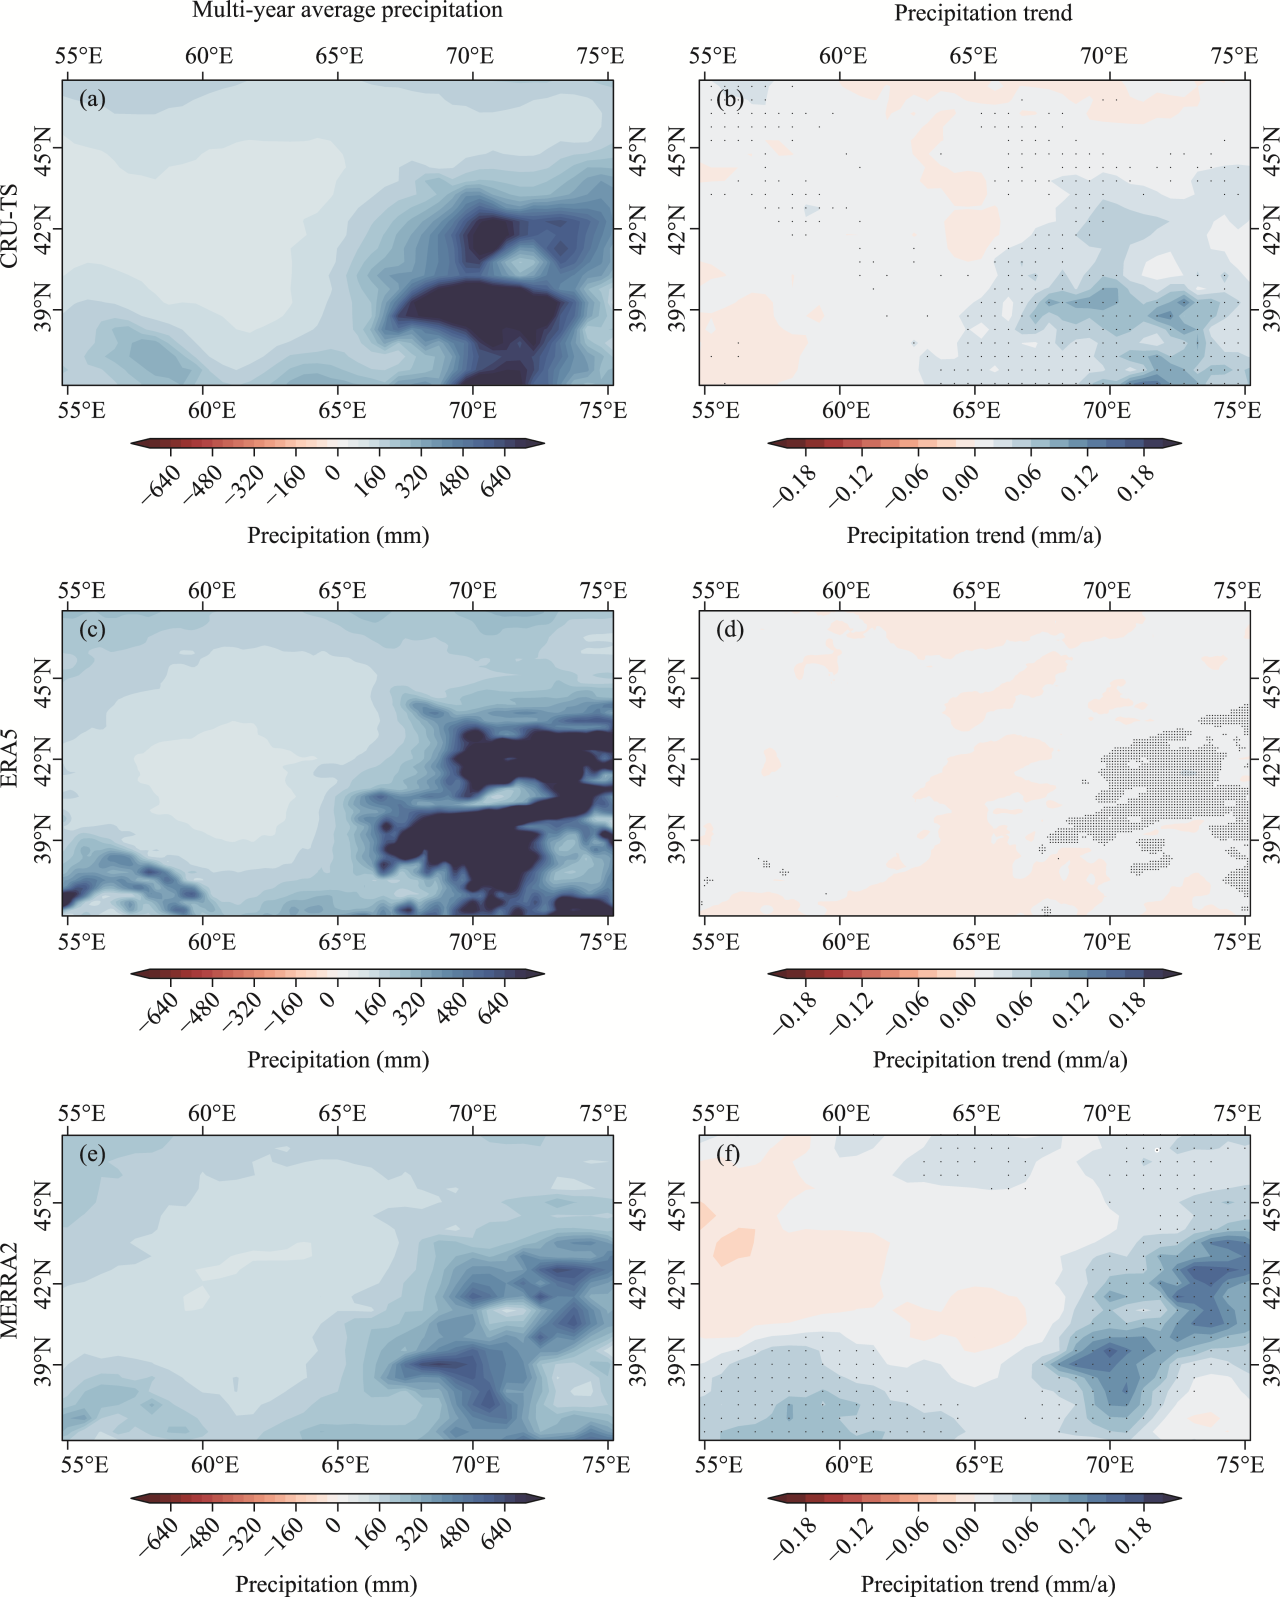
Fig. 13Spatial distributions of multi-year average precipitation and annual precipitation trends based on CRU-TS (a and b), ERA5 (c and d), and MERRA2 (e and f) datasets. Black dots indicate trends significant at the P<0.050 level.
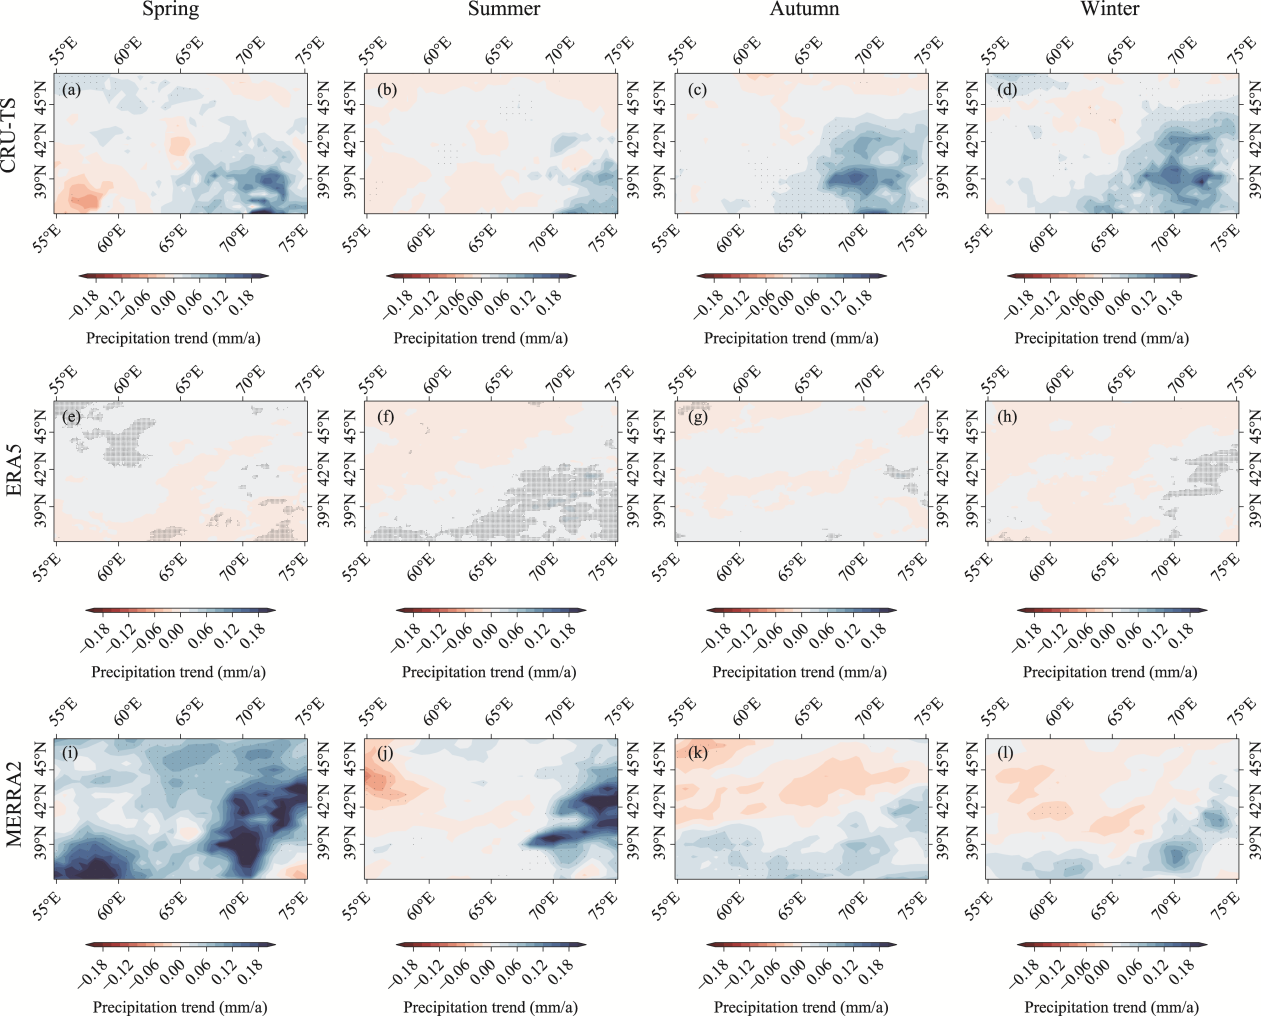
Fig. 14Spatial distribution of seasonal precipitation trends based on CRU-TS (a-d), ERA5 (e-h), and MERRA2 (i-l) datasets. Black dots indicate trends significant at the P<0.050 level.
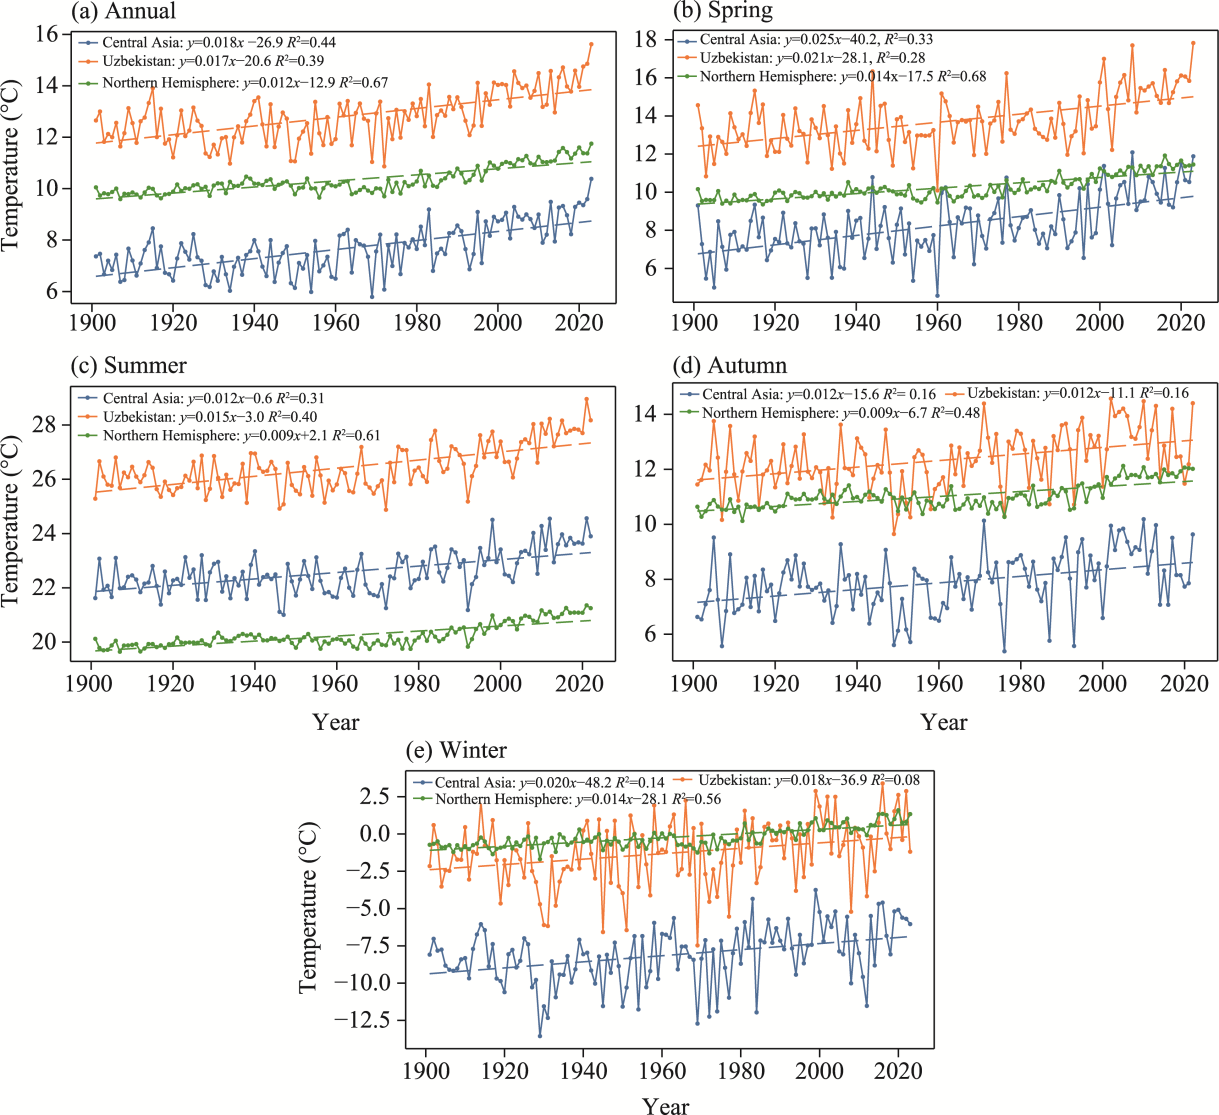
Fig. 15Temporal variations in annual mean temperature (a) and seasonal mean temperatures (b-e) based on the CRU-TS dataset for Uzbekistan, Central Asia, and the Northern Hemisphere from 1901 to 2023
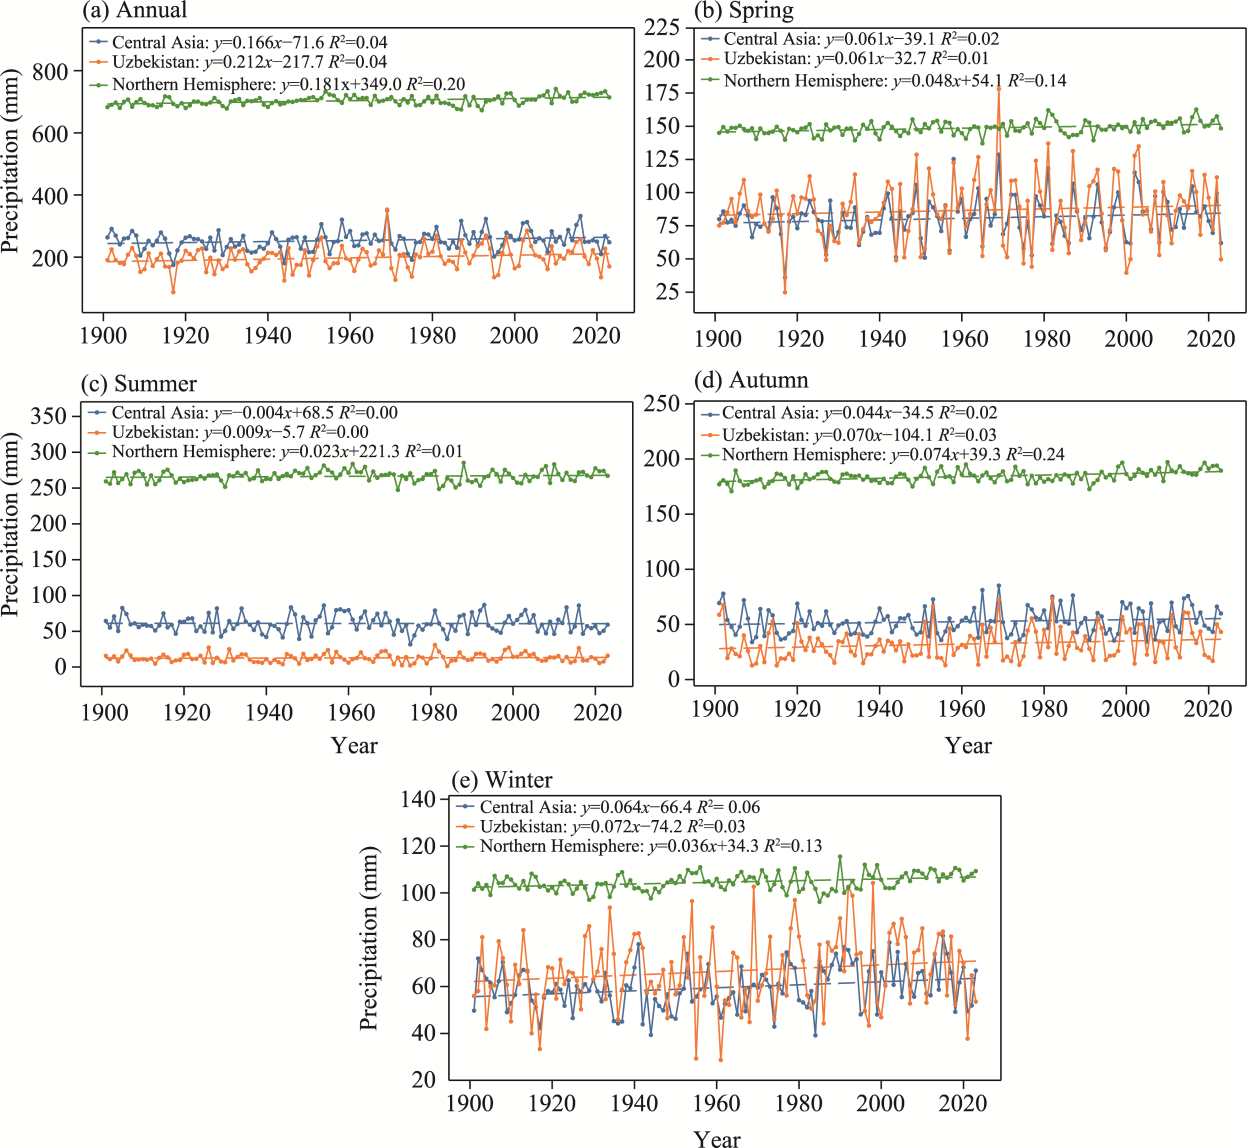
Fig. 16Temporal variations in annual precipitation (a) and seasonal precipitation (b-e) based on the CRU-TS dataset for Uzbekistan, Central Asia, and the Northern Hemisphere from 1901 to 2023
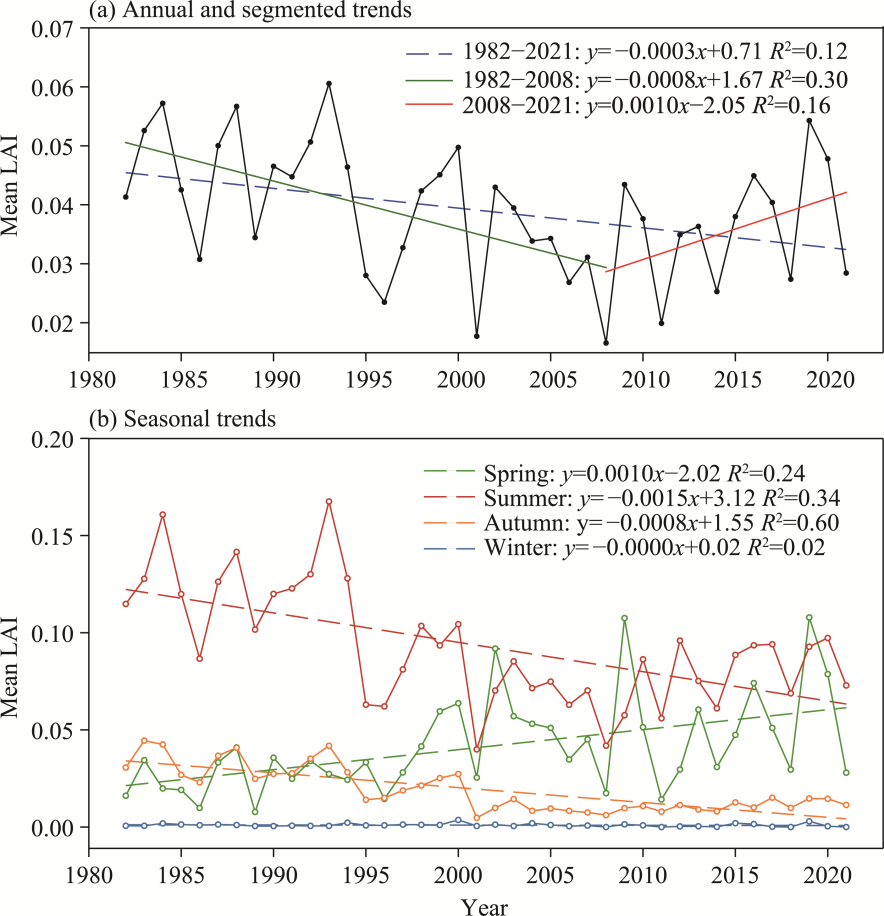
Fig. 17Temporal variations in annual LAI (a) and seasonal LAI (b) in Uzbekistan during 1982-2021
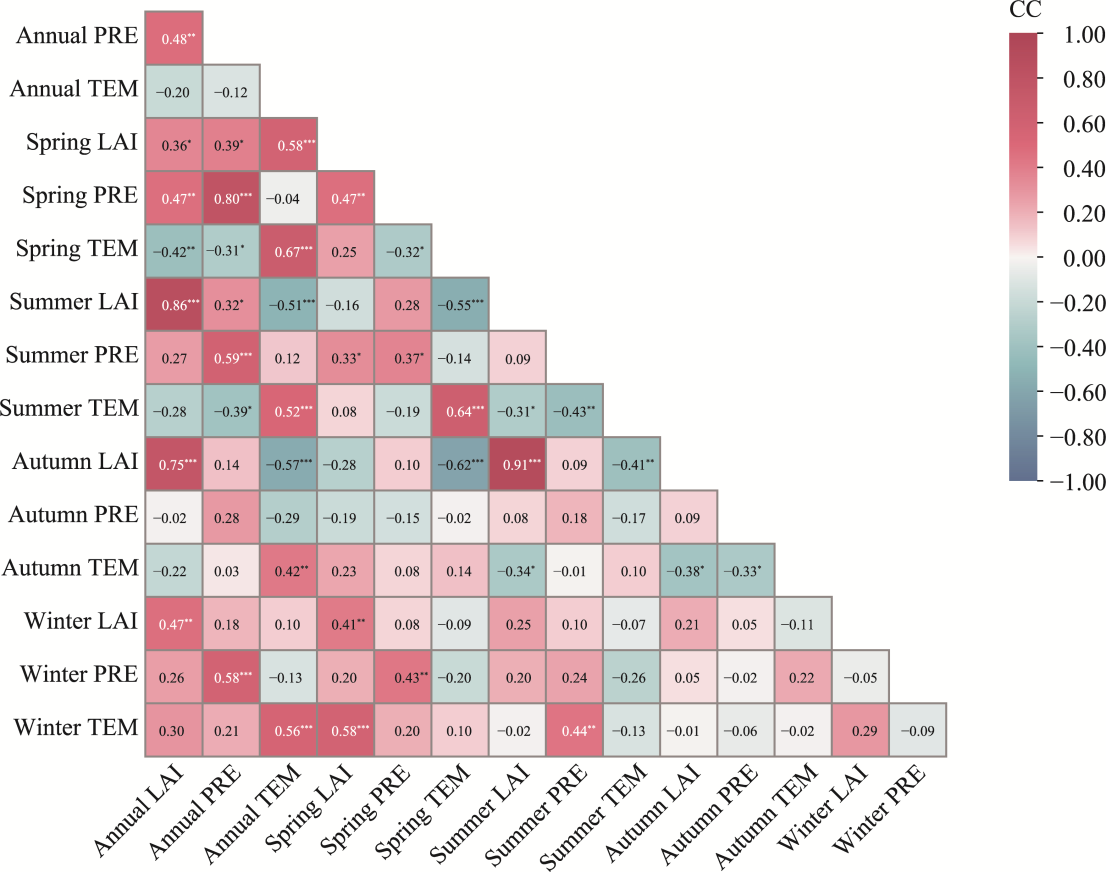
Fig. 18Correlation matrix of LAI, precipitation (PRE), and temperature (TEM) at annual and seasonal scales in Uzbekistan during 1982-2021. *, P<0.050 level; **, P<0.010 level; ***, P<0.001 level.
[1]
Al Mamun M A, Li M, Pramanik B K, et al. 2025. Leveraging blockchain technology with enhanced MDSVA for robust meteorological sensor data validation. IEEE Access, 13: 72633-72656.
doi: 10.1109/ACCESS.2025.3563099
[2]
Chen F H, Huang W, Jin L Y, et al. 2011. Spatiotemporal precipitation variations in the arid Central Asia in the context of global warming. Science China Earth Sciences, 54(12): 1812-1821.
doi: 10.1007/s11430-011-4333-8
[3]
Chen X, Wang S S, Hu Z Y, et al. 2018. Spatiotemporal characteristics of seasonal precipitation and their relationships with ENSO in Central Asia during 1901-2013. Journal of Geographical Sciences, 28(9): 1341-1368.
doi: 10.1007/s11442-018-1529-2
[4]
Cohen J, Screen J A, Furtado J C, et al. 2014. Recent Arctic amplification and extreme mid-latitude weather. Nature Geoscience, 7(9): 627-637.
doi: 10.1038/ngeo2234
[5]
Dai A G. 2013. Increasing drought under global warming in observations and models. Nature Climate Change, 3(1): 52-58.
doi: 10.1038/nclimate1633
[6]
de Beurs K M, Henebry G M, Owsley B C, et al. 2018. Large scale climate oscillation impacts on temperature, precipitation and land surface phenology in Central Asia. Environmental Research Letters, 13(6): 065018, doi: 10.1088/1748-9326/aac4d0.
[7]
Fallah B, Didovets I, Rostami M, et al. 2024. Climate change impacts on Central Asia: Trends, extremes and future projections. International Journal of Climatology, 44(10): 3191-3213.
doi: 10.1002/joc.v44.10
[8]
Fan L J, Yan Z W, Chen D L, et al. 2023. Assessment of total and extreme precipitation over central Asia via statistical downscaling: Added value and multi-model ensemble projection. Advances in Climate Change Research, 14(1): 62-76.
doi: 10.1016/j.accre.2023.01.004
[9]
Fang H S, Sha M Q, Xie Y C, et al. 2023. Shifted global vegetation phenology in response to climate changes and its feedback on vegetation carbon uptake. Remote Sensing, 15(9): 2288, doi: 10.3390/rs15092288.
[10]
Franzke C L E, Barbosa S, Blender R, et al. 2020. The structure of climate variability across scales. Reviews of Geophysics, 58(2): e2019RG000657, doi: 10.1029/2019RG000657.
[11]
Gelaro R, McCarty W, Suárez M J, et al. 2017. The Modern-Era Retrospective analysis for Research and Applications, version 2 (MERRA-2). Journal of Climate, 30(14): 5419-5454.
doi: 10.1175/JCLI-D-16-0758.1
[12]
Gummadi S, Samineni S, Lopez-Lavalle L A B. 2025. Assessing high-resolution precipitation extremes in Central Asia: evaluation and future projections. Climatic Change, 178(2): 29, doi: 10.1007/s10584-025-03872-0.
[13]
Harris I, Osborn T J, Jones P, et al. 2020. Version 4 of the CRU TS monthly high-resolution gridded multivariate climate dataset. Scientific Data, 7(1): 109, doi: 10.1038/s41597-020-0453-3.
pmid: 32246091
[14]
Hu Z Y, Zhang C, Hu Q, et al. 2014. Temperature changes in Central Asia from 1979 to 2011 based on multiple datasets. Journal of Climate, 27(3): 1143-1167.
doi: 10.1175/JCLI-D-13-00064.1
[15]
Hu Z Y, Zhou Q M, Chen X, et al. 2017. Variations and changes of annual precipitation in Central Asia over the last century. International Journal of Climatology, 37(S1): 157-170.
doi: 10.1002/joc.2017.37.issue-S1
[16]
Hu Z Y, Chen X, Zhou Q M, et al. 2019. DISO: A rethink of Taylor diagram. International Journal of Climatology, 39(5): 2825-2832.
doi: 10.1002/joc.2019.39.issue-5
[17]
Hu Z Y, Chen D L, Chen X, et al. 2022. CCHZ-DISO: A timely new assessment system for data quality or model performance from Da Dao Zhi Jian. Geophysical Research Letters, 49(23): e2022GL100681, doi: 10.1029/2022GL100681.
[18]
Huang J P, Ji M X, Xie Y K, et al. 2016. Global semi-arid climate change over last 60 years. Climate Dynamics, 46(3-4): 1131-1150.
doi: 10.1007/s00382-015-2636-8
[19]
IPCC Intergovernmental Panel on Climate Change. 2022. The Ocean and Cryosphere in a Changing Climate. Cambridge: Cambridge University Press, 755.
[20]
IPCC. 2023. Climate Change 2021: The Physical Science Basis. Cambridge: Cambridge University Press, 2391.
[21]
Jiang J, Zhou T J, Chen X L, et al. 2021. Central Asian precipitation shaped by the Tropical Pacific decadal variability and the Atlantic Multidecadal variability. Journal of Climate, 34(18): 7541-7553.
doi: 10.1175/JCLI-D-20-0905.1
[22]
Jiang L L, Jiapaer G, Bao A M, et al. 2017. Vegetation dynamics and responses to climate change and human activities in Central Asia. Science of The Total Environment, 599-600: 967-980.
doi: 10.1016/j.scitotenv.2017.05.012
[23]
Jiang L L, Jiapaer G, Bao A M, et al. 2019. Monitoring the long-term desertification process and assessing the relative roles of its drivers in Central Asia. Ecological Indicators, 104: 195-208.
doi: 10.1016/j.ecolind.2019.04.067
[24]
Li Z, Chen Y N, Li W H, et al. 2015. Potential impacts of climate change on vegetation dynamics in Central Asia. Journal of Geophysical Research: Atmospheres, 120(24): 12345-12356.
doi: 10.1002/jgrd.v120.24
[25]
Lioubimtseva E, Cole R, Adams J M, et al. 2005. Impacts of climate and land-cover changes in arid lands of Central Asia. Journal of Arid Environments, 62(2): 285-308.
doi: 10.1016/j.jaridenv.2004.11.005
[26]
Lioubimtseva E, Cole R. 2006. Uncertainties of climate change in arid environments of Central Asia. Reviews in Fisheries Science, 14(1-2): 29-49.
doi: 10.1080/10641260500340603
[27]
Lioubimtseva E, Henebry G M. 2009. Climate and environmental change in arid Central Asia: Impacts, vulnerability, and adaptations. Journal of Arid Environments, 73(11): 963-977.
doi: 10.1016/j.jaridenv.2009.04.022
[28]
Liu P, Zha T S, Jia X, et al. 2019. Different effects of spring and summer droughts on ecosystem carbon and water exchanges in a semiarid shrubland ecosystem in Northwest China. Ecosystems, 22(8): 1869-1885.
doi: 10.1007/s10021-019-00379-5
[29]
Liu Y R, Li Y P, Ma Y, et al. 2022. Analyzing extreme precipitation and temperature in Central Asia as well as quantifying their main and interactive effects under multiple uncertainties. Journal of Hydrology, 607: 127469, doi: 10.1016/j.jhydrol.2022.127469.
[30]
Luo M, Liu T, Meng F H, et al. 2019. Spatiotemporal characteristics of future changes in precipitation and temperature in Central Asia. International Journal of Climatology, 39(3): 1571-1588.
doi: 10.1002/joc.2019.39.issue-3
[31]
Micklin P. 2016. The future Aral Sea: hope and despair. Environmental Earth Sciences, 75(9): 844, doi: 10.1007/s12665-016-5614-5.
[32]
Miller D L, Wolf S, Fisher J B, et al. 2023. Increased photosynthesis during spring drought in energy-limited ecosystems. Nature Communications, 14(1): 7828, doi: 10.1038/s41467-023-43430-9.
pmid: 38030605
[33]
Neukom R, Barboza L A, Erb M P, et al. 2019. Consistent multidecadal variability in global temperature reconstructions and simulations over the Common Era. Nature Geoscience, 12(8): 643-649.
doi: 10.1038/s41561-019-0400-0
[34]
Ozturk T, Turp M T, Türkeş M, et al. 2017. Projected changes in temperature and precipitation climatology of Central Asia CORDEX Region 8 by using RegCM4.3.5. Atmospheric Research, 183: 296-307.
doi: 10.1016/j.atmosres.2016.09.008
[35]
Peng D D, Zhou T J, Zhang L X, et al. 2019. Detecting human influence on the temperature changes in Central Asia. Climate Dynamics, 53(7-8): 4553-4568.
doi: 10.1007/s00382-019-04804-2
[36]
Peters G P, Andrew R M, Canadell J G, et al. 2020. Carbon dioxide emissions continue to grow amidst slowly emerging climate policies. Nature Climate Change, 10(1): 3-6.
doi: 10.1038/s41558-019-0659-6
[37]
Soci C, Hersbach H, Simmons A, et al. 2024. The ERA5 global reanalysis from 1940 to 2022. Quarterly Journal of the Royal Meteorological Society, 150(764): 4014-4048.
doi: 10.1002/qj.v150.764
[38]
Su F, Liu Y, Chen L F, et al. 2024. Impact of climate change on food security in the Central Asian countries. Science China Earth Sciences, 67(1): 268-280.
doi: 10.1007/s11430-022-1198-4
[39]
Suter G. 2022. Climate change 2022: Impacts, adaptation and vulnerability. Integrated Environmental Assessment and Management, 18(4): 1117-1128.
doi: 10.1002/ieam.4628
[40]
Turaeva S, Sultanova G. 2024. Climate change impact on agriculture and water resources:Uzbekistan. In: SDGs in the Asia and Pacific Region. Cham: Springer, 249-269.
[41]
Vakulchuk R, Daloz A S, Overland I, et al. 2023. A void in Central Asia research: climate change. Central Asian Survey, 42(1): 1-20.
doi: 10.1080/02634937.2022.2059447
[42]
Wei W, Zou S, Duan W L, et al. 2023a. Spatiotemporal variability in extreme precipitation and associated large-scale climate mechanisms in Central Asia from 1950 to 2019. Journal of Hydrology, 620: 129417, doi: 10.1016/j.jhydrol.2023.129417.
[43]
Wei Y C, Yu M, Wei J F, et al. 2023b. Impacts of extreme climates on vegetation at middle-to-high latitudes in Asia. Remote Sensing, 15(5): 1251, doi: 10.3390/rs15051251.
[44]
White C J, Tanton T W, Rycroft D W. 2014. The impact of climate change on the water resources of the Amu Darya Basin in Central Asia. Water Resources Management, 28(15): 5267-5281.
doi: 10.1007/s11269-014-0716-x
[45]
Wu X J, Shen Y P, Zhang W, et al. 2020. Fast warming has accelerated snow cover loss during spring and summer across the Northern Hemisphere over the past 52 years (1967-2018). Atmosphere, 11(7): 728, doi: 10.3390/atmos11070728.
[46]
Xiao Z Q, Liang S L, Wang J D, et al. 2014. Use of general regression neural networks for generating the GLASS leaf area index product from time-Series MODIS surface reflectance. IEEE Transactions on Geoscience and Remote Sensing, 52(1): 209-223.
doi: 10.1109/TGRS.2013.2237780
[47]
Xu L G, Zhou H F, Du L, et al. 2015. Precipitation trends and variability from 1950 to 2000 in arid lands of Central Asia. Journal of Arid Land, 7(4): 514-526.
doi: 10.1007/s40333-015-0045-9
[48]
Yao J Q, Chen Y N, Guan X F, et al. 2022. Recent climate and hydrological changes in a mountain-basin system in Xinjiang, China. Earth-Science Reviews, 226: 103957, doi: 10.1016/j.earscirev.2022.103957.
[49]
Yin G, Hu Z Y, Chen X, et al. 2016. Vegetation dynamics and its response to climate change in Central Asia. Journal of Arid Land, 8(3): 375-388.
doi: 10.1007/s40333-016-0043-6
[50]
Yuan Y, Bao A M, Liu T, et al. 2021. Assessing vegetation stability to climate variability in Central Asia. Journal of Environmental Management, 298: 113330, doi: 10.1016/j.jenvman.2021.113330.
[51]
Zhang H, Hu Z Y, Chen X, et al. 2025. Global greening major contributed by climate change with more than two times rate against the history period during the 21th century. Global Change Biology, 31(3): e70126, doi: 10.1111/gcb.70126.
[52]
Zhang J J, Hao X M, Hao H C, et al. 2021. Climate change decreased net ecosystem productivity in the arid region of Central Asia. Remote Sensing, 13(21): 4449, doi: 10.3390/rs13214449.
[53]
Zhong L H, Hua L J, Yao Y, et al. 2021. Interdecadal aridity variations in Central Asia during 1950-2016 regulated by oceanic conditions under the background of global warming. Climate Dynamics, 56(11-12): 3665-3686.
doi: 10.1007/s00382-021-05659-2
[54]
Zhou Q M, Chen D L, Hu Z Y, et al. 2021. Decompositions of Taylor diagram and DISO performance criteria. International Journal of Climatology, 41(12): 5726-5732.
doi: 10.1002/joc.v41.12