| Research article |
|


|
|
|
| Climate and topography regulate the spatial pattern of soil salinization and its effects on shrub community structure in Northwest China |
DU Lan1,2,3, TIAN Shengchuan1,2,3, ZHAO Nan1,2,3, ZHANG Bin1,2,3, MU Xiaohan1,2,3, TANG Lisong1,3, ZHENG Xinjun1,3,*( ), LI Yan4 ), LI Yan4 |
1State Key Laboratory of Desert and Oasis Ecology, Xinjiang Institute of Ecology and Geography, Chinese Academy of Sciences, Urumqi 830011, China
2University of Chinese Academy of Sciences, Beijing 100049, China
3Fukang Station of Desert Ecology, Chinese Academy of Sciences, Fukang 831505, China
4State Key Laboratory of Subtropical Silviculture, Zhejiang A&F University, Hangzhou 311300, China |
|
|
|
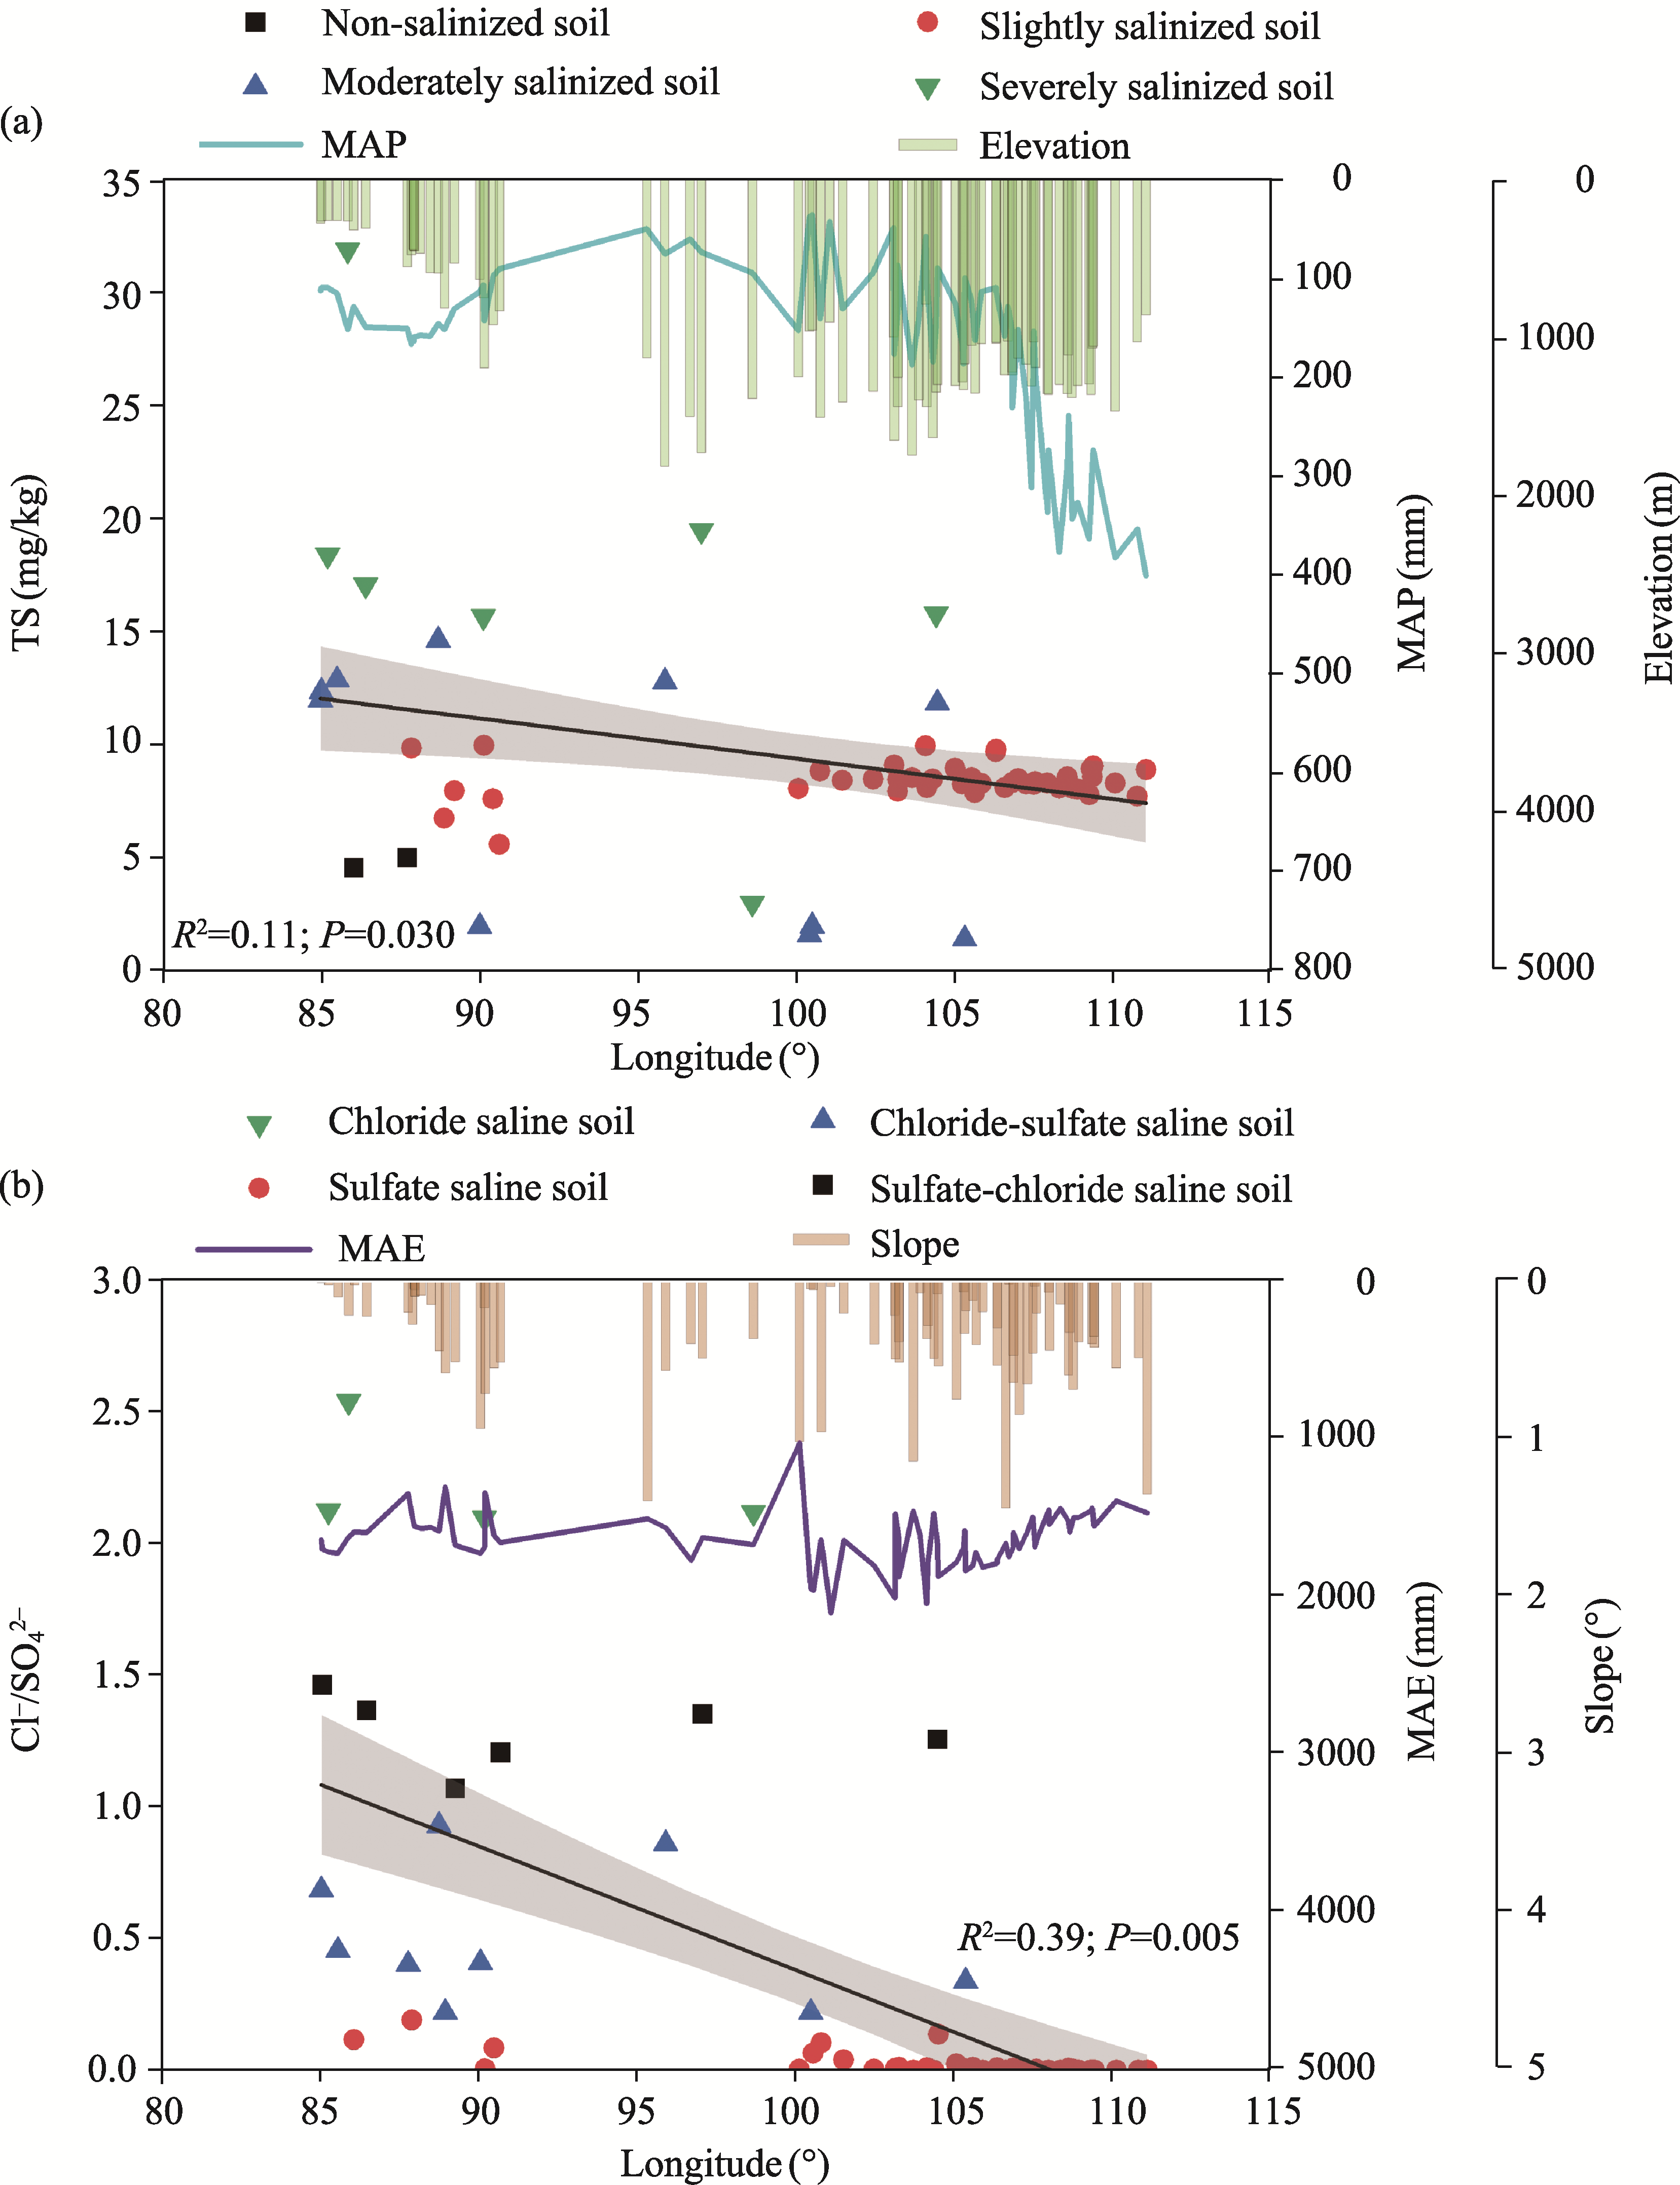
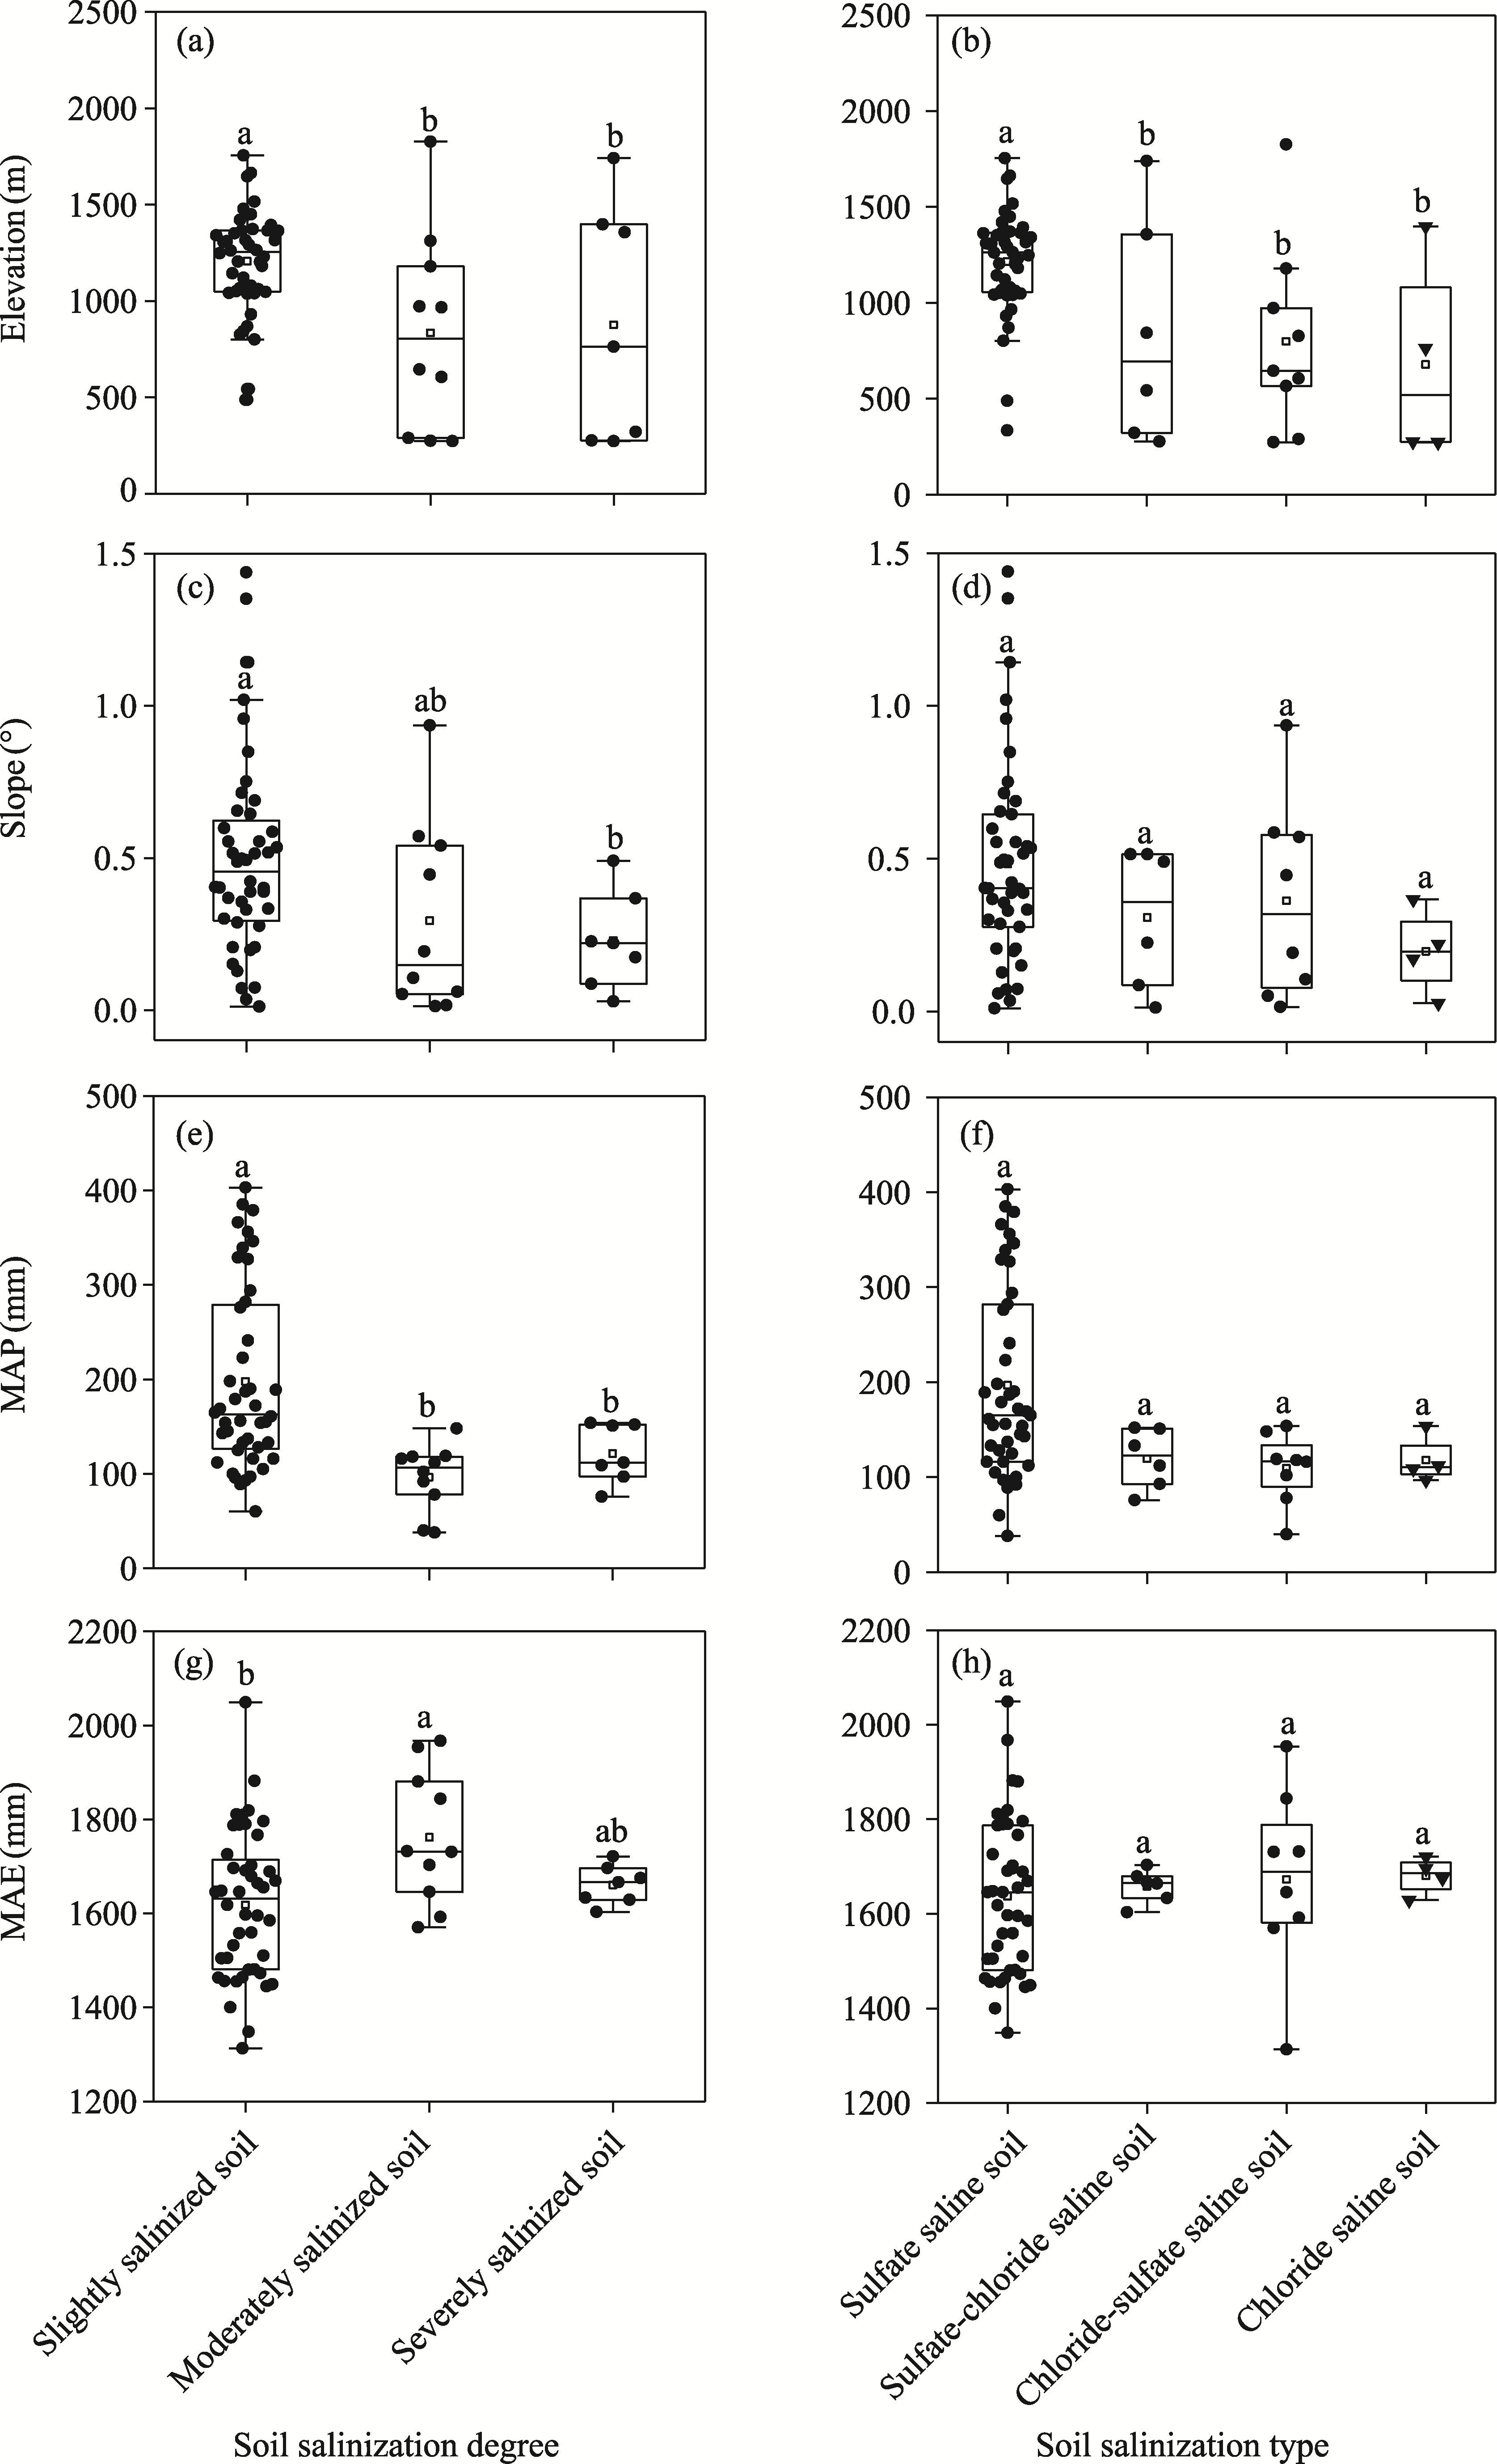
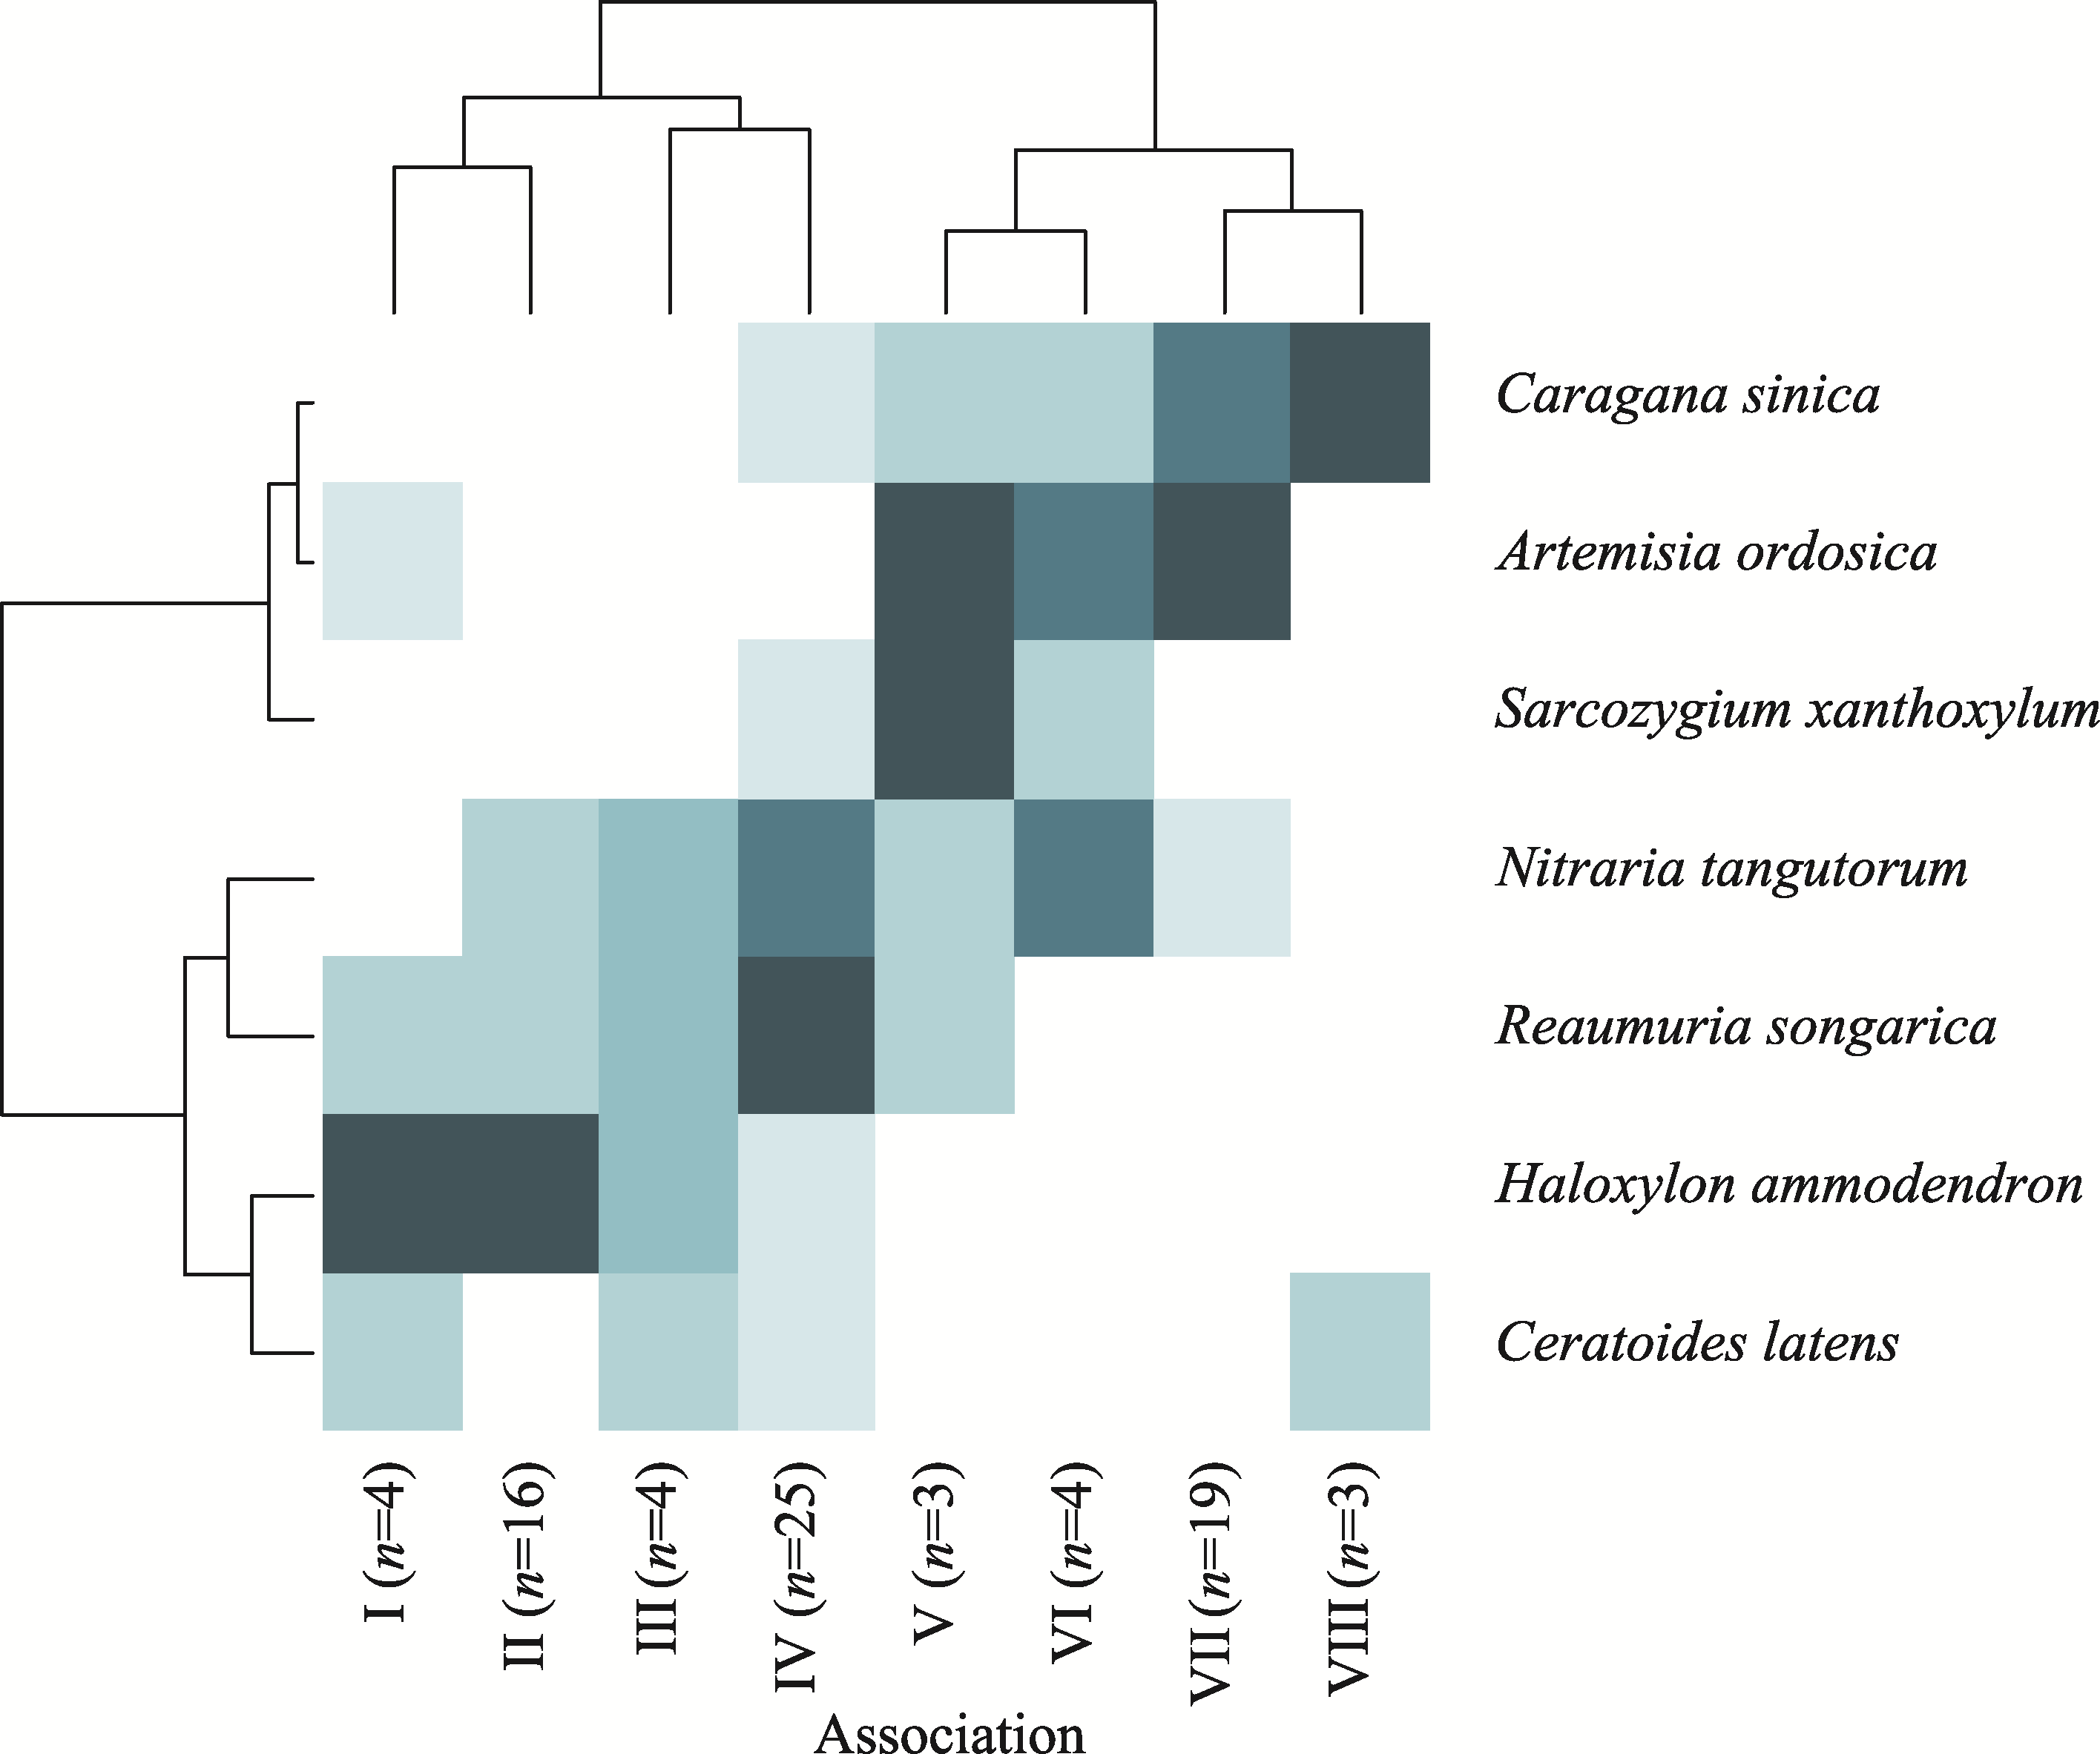
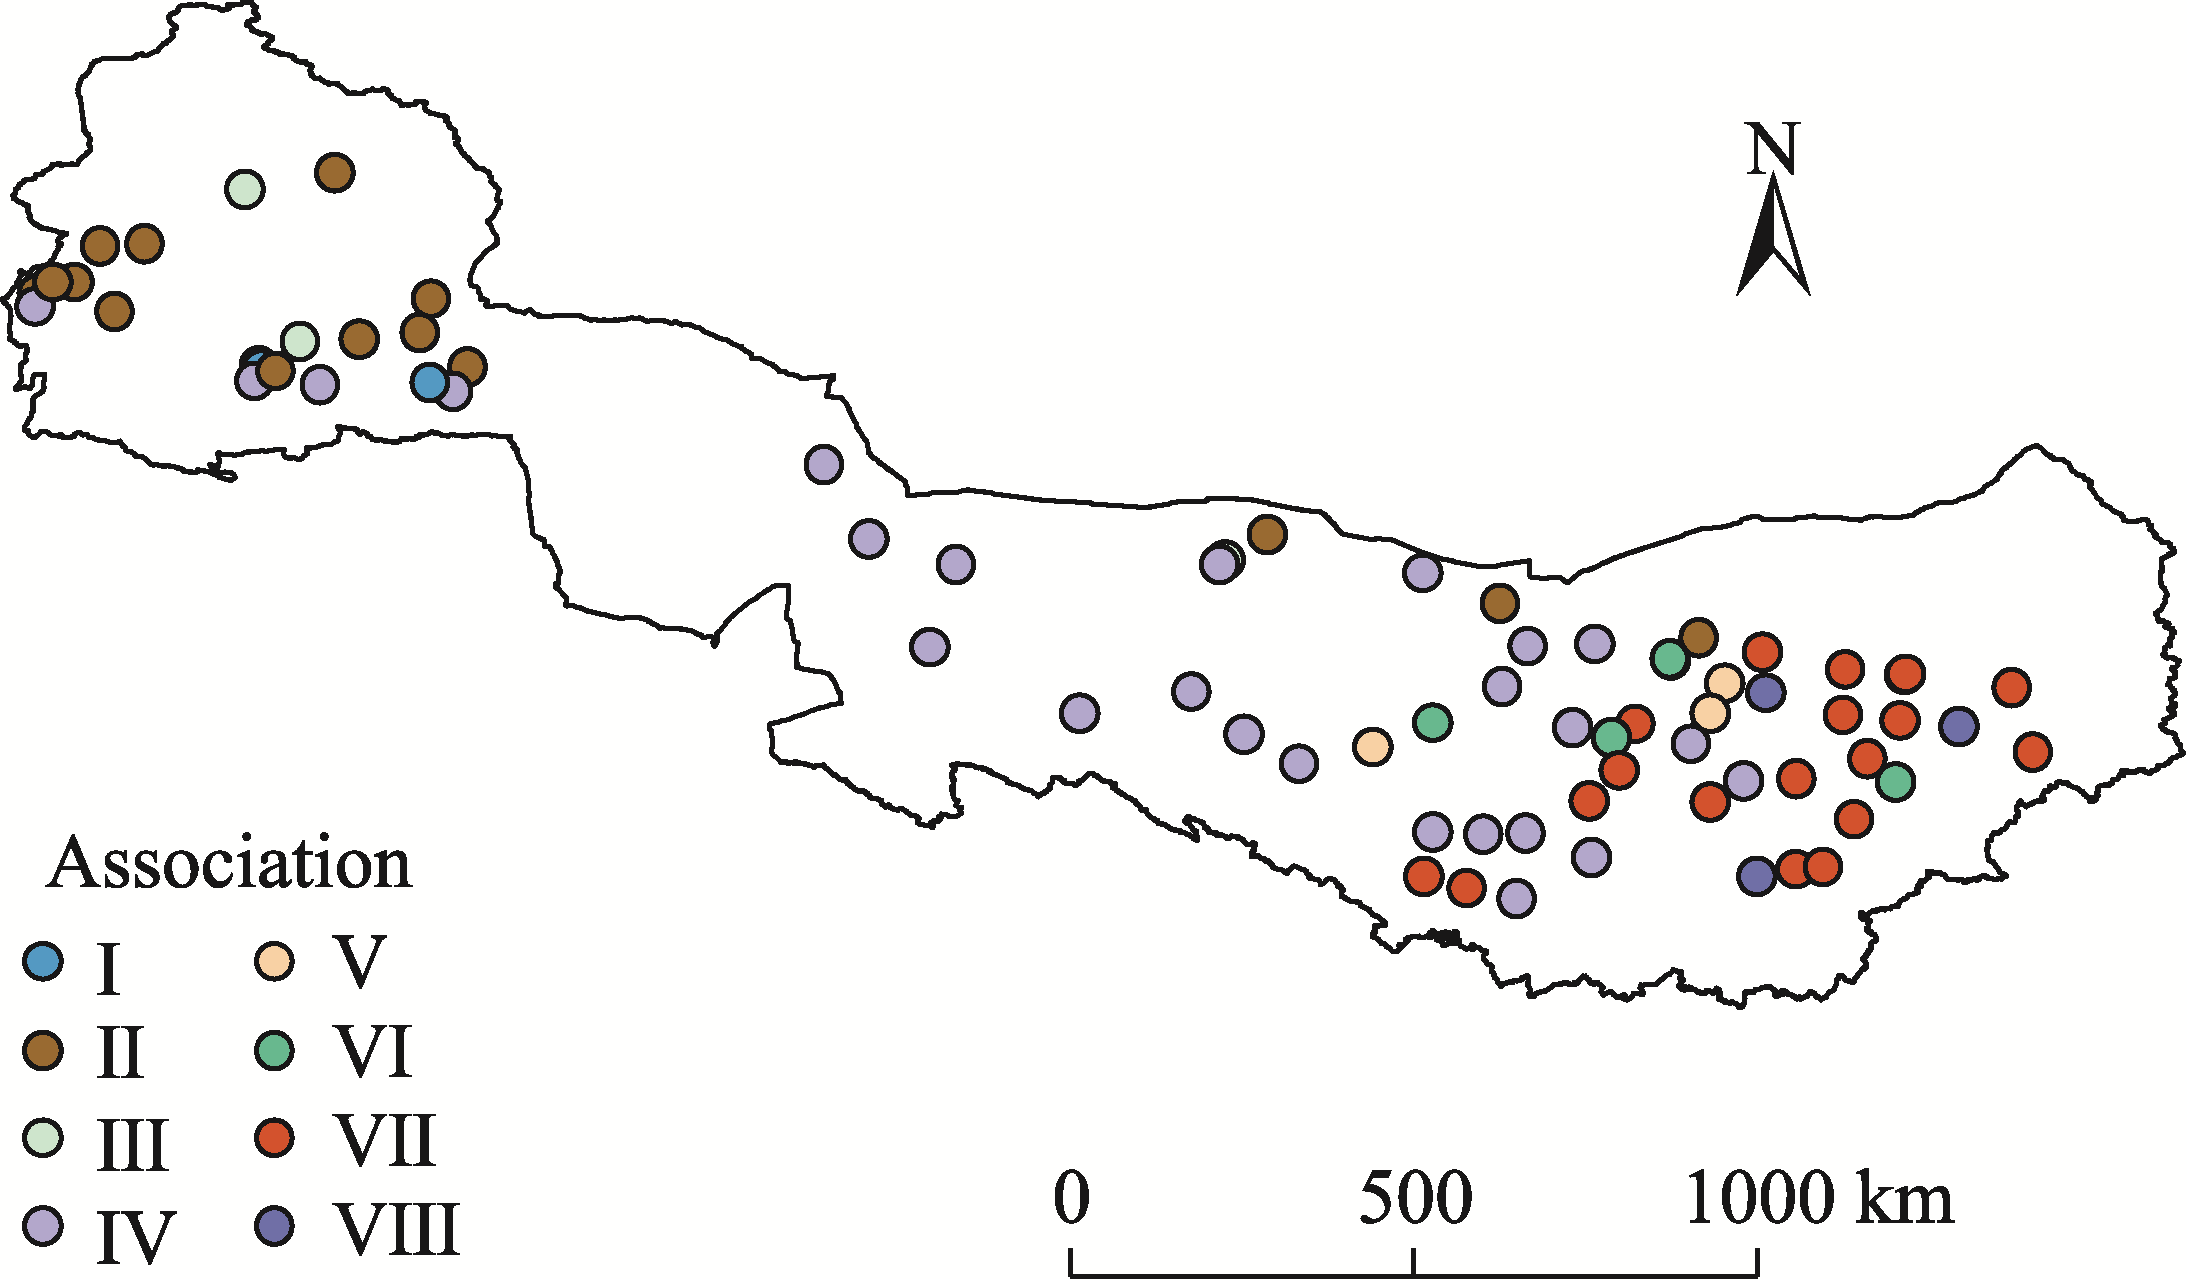
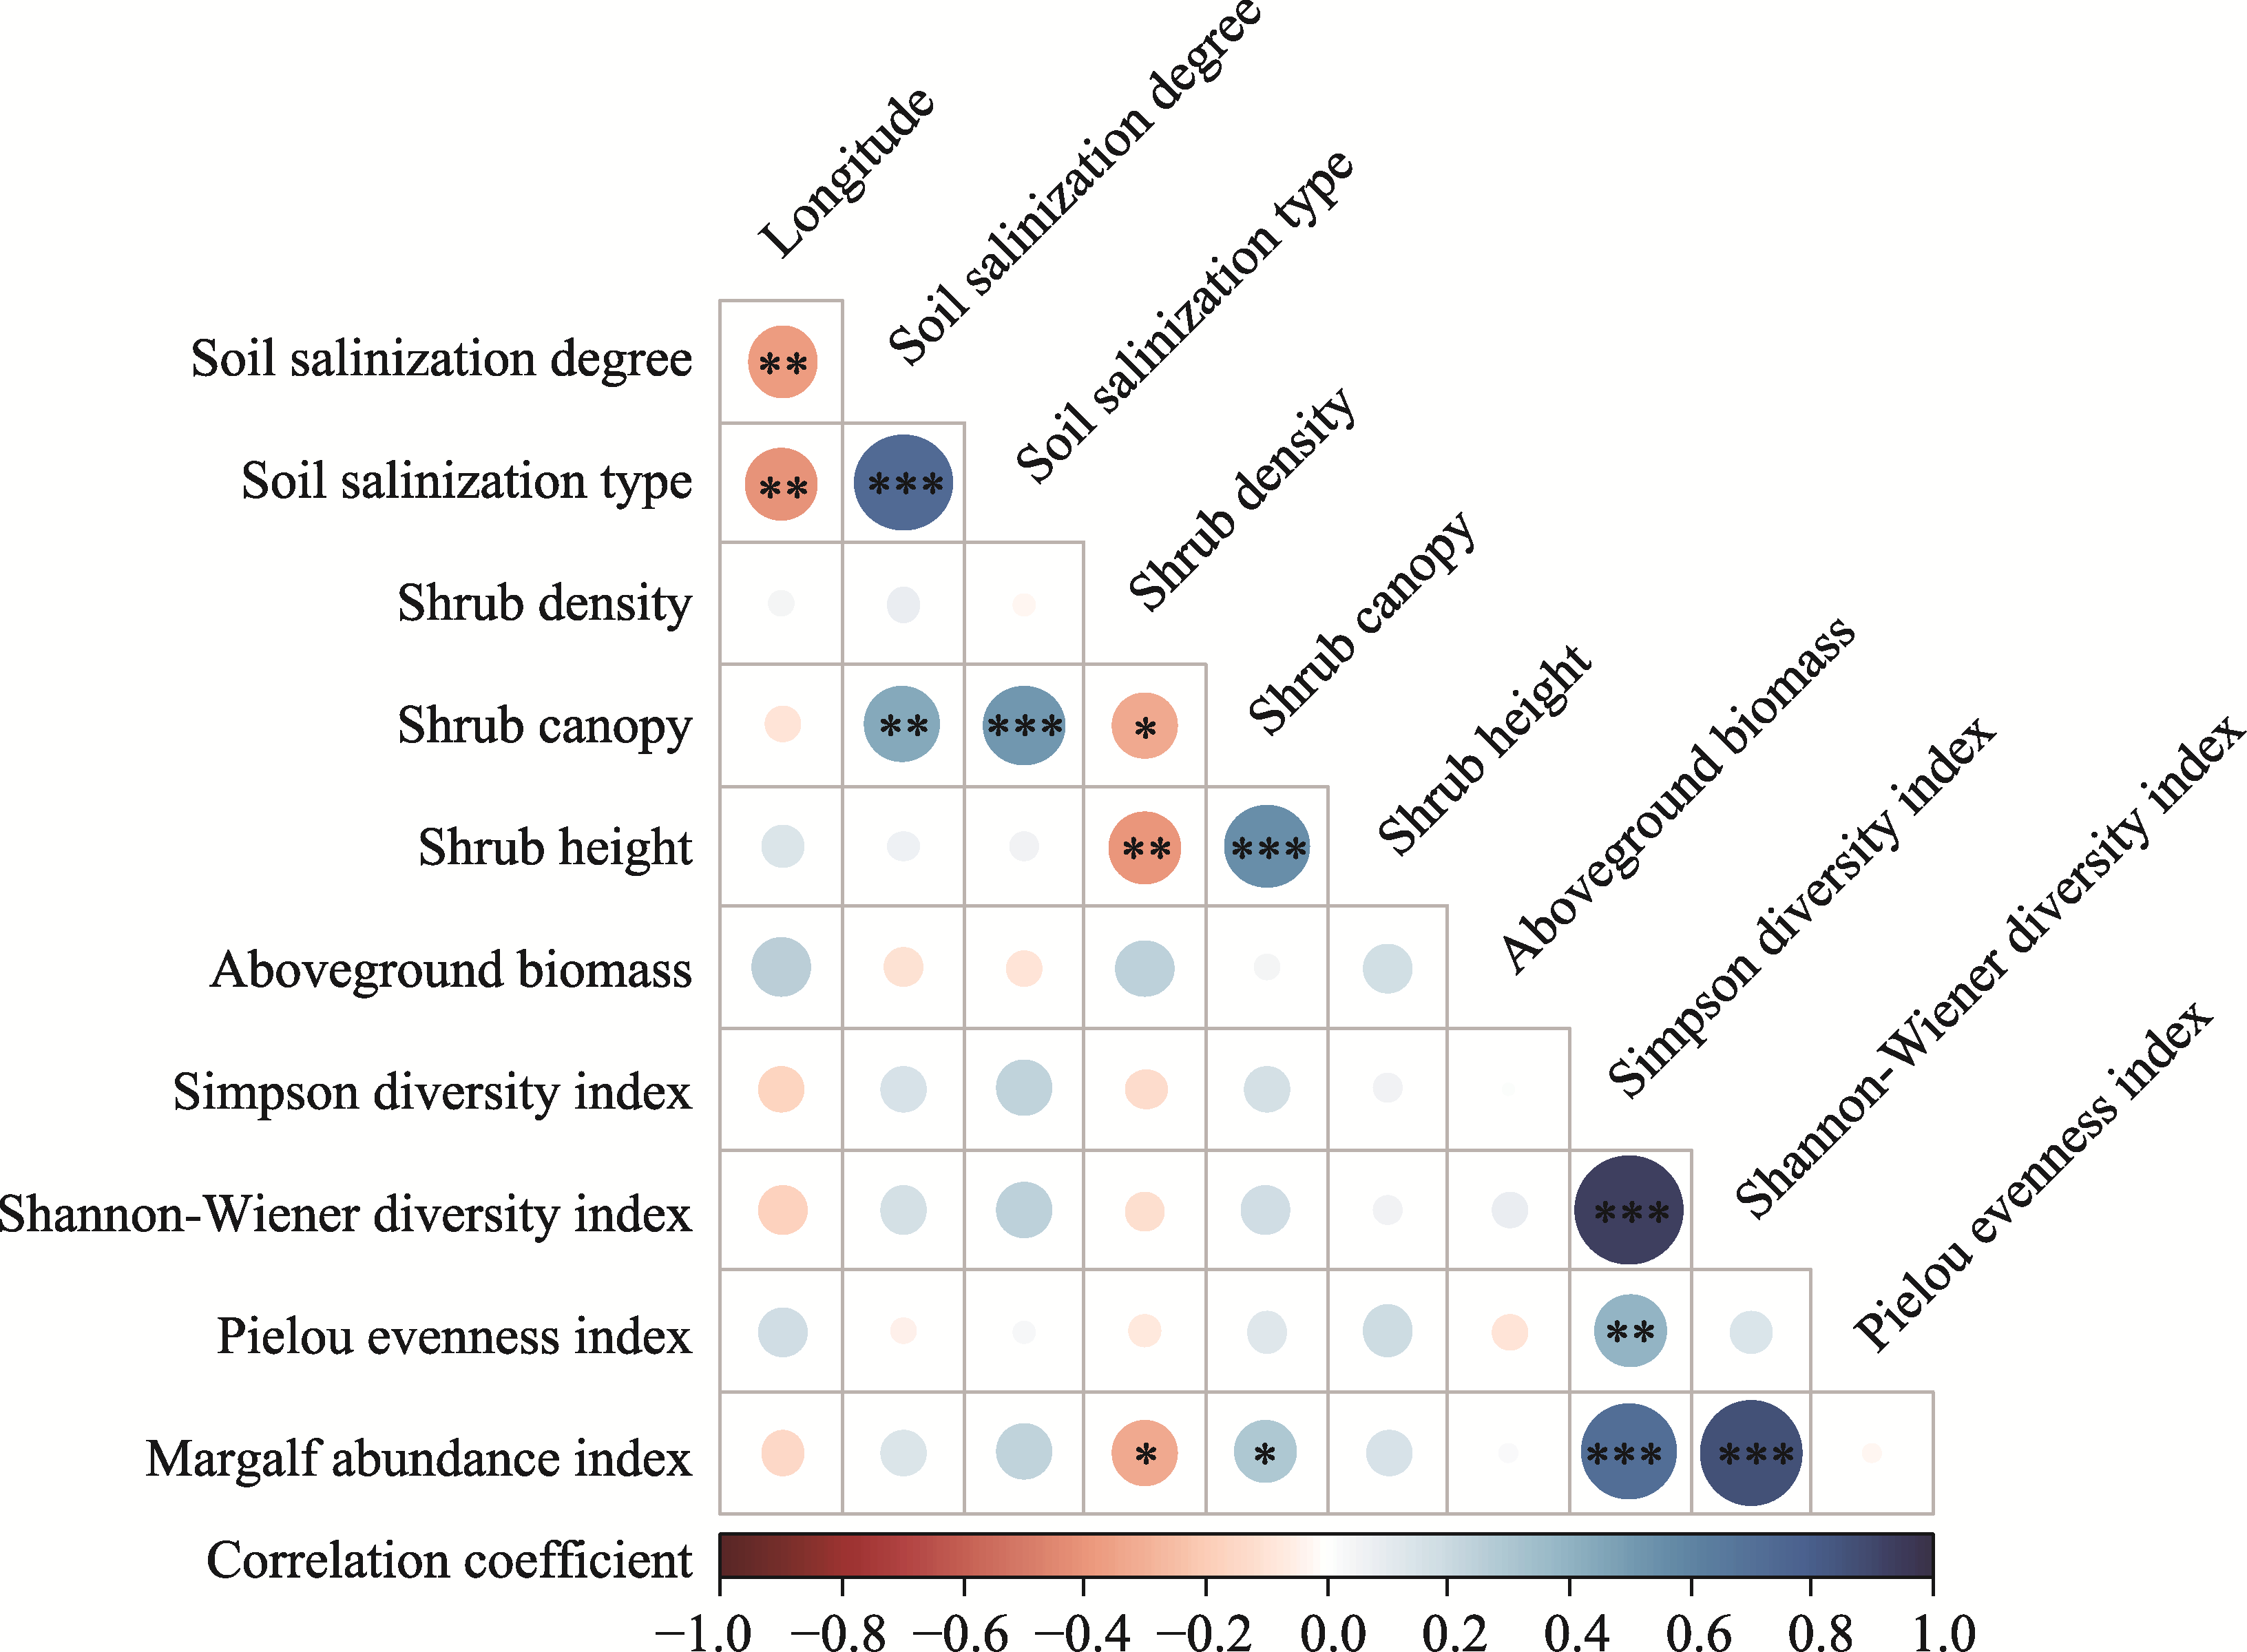
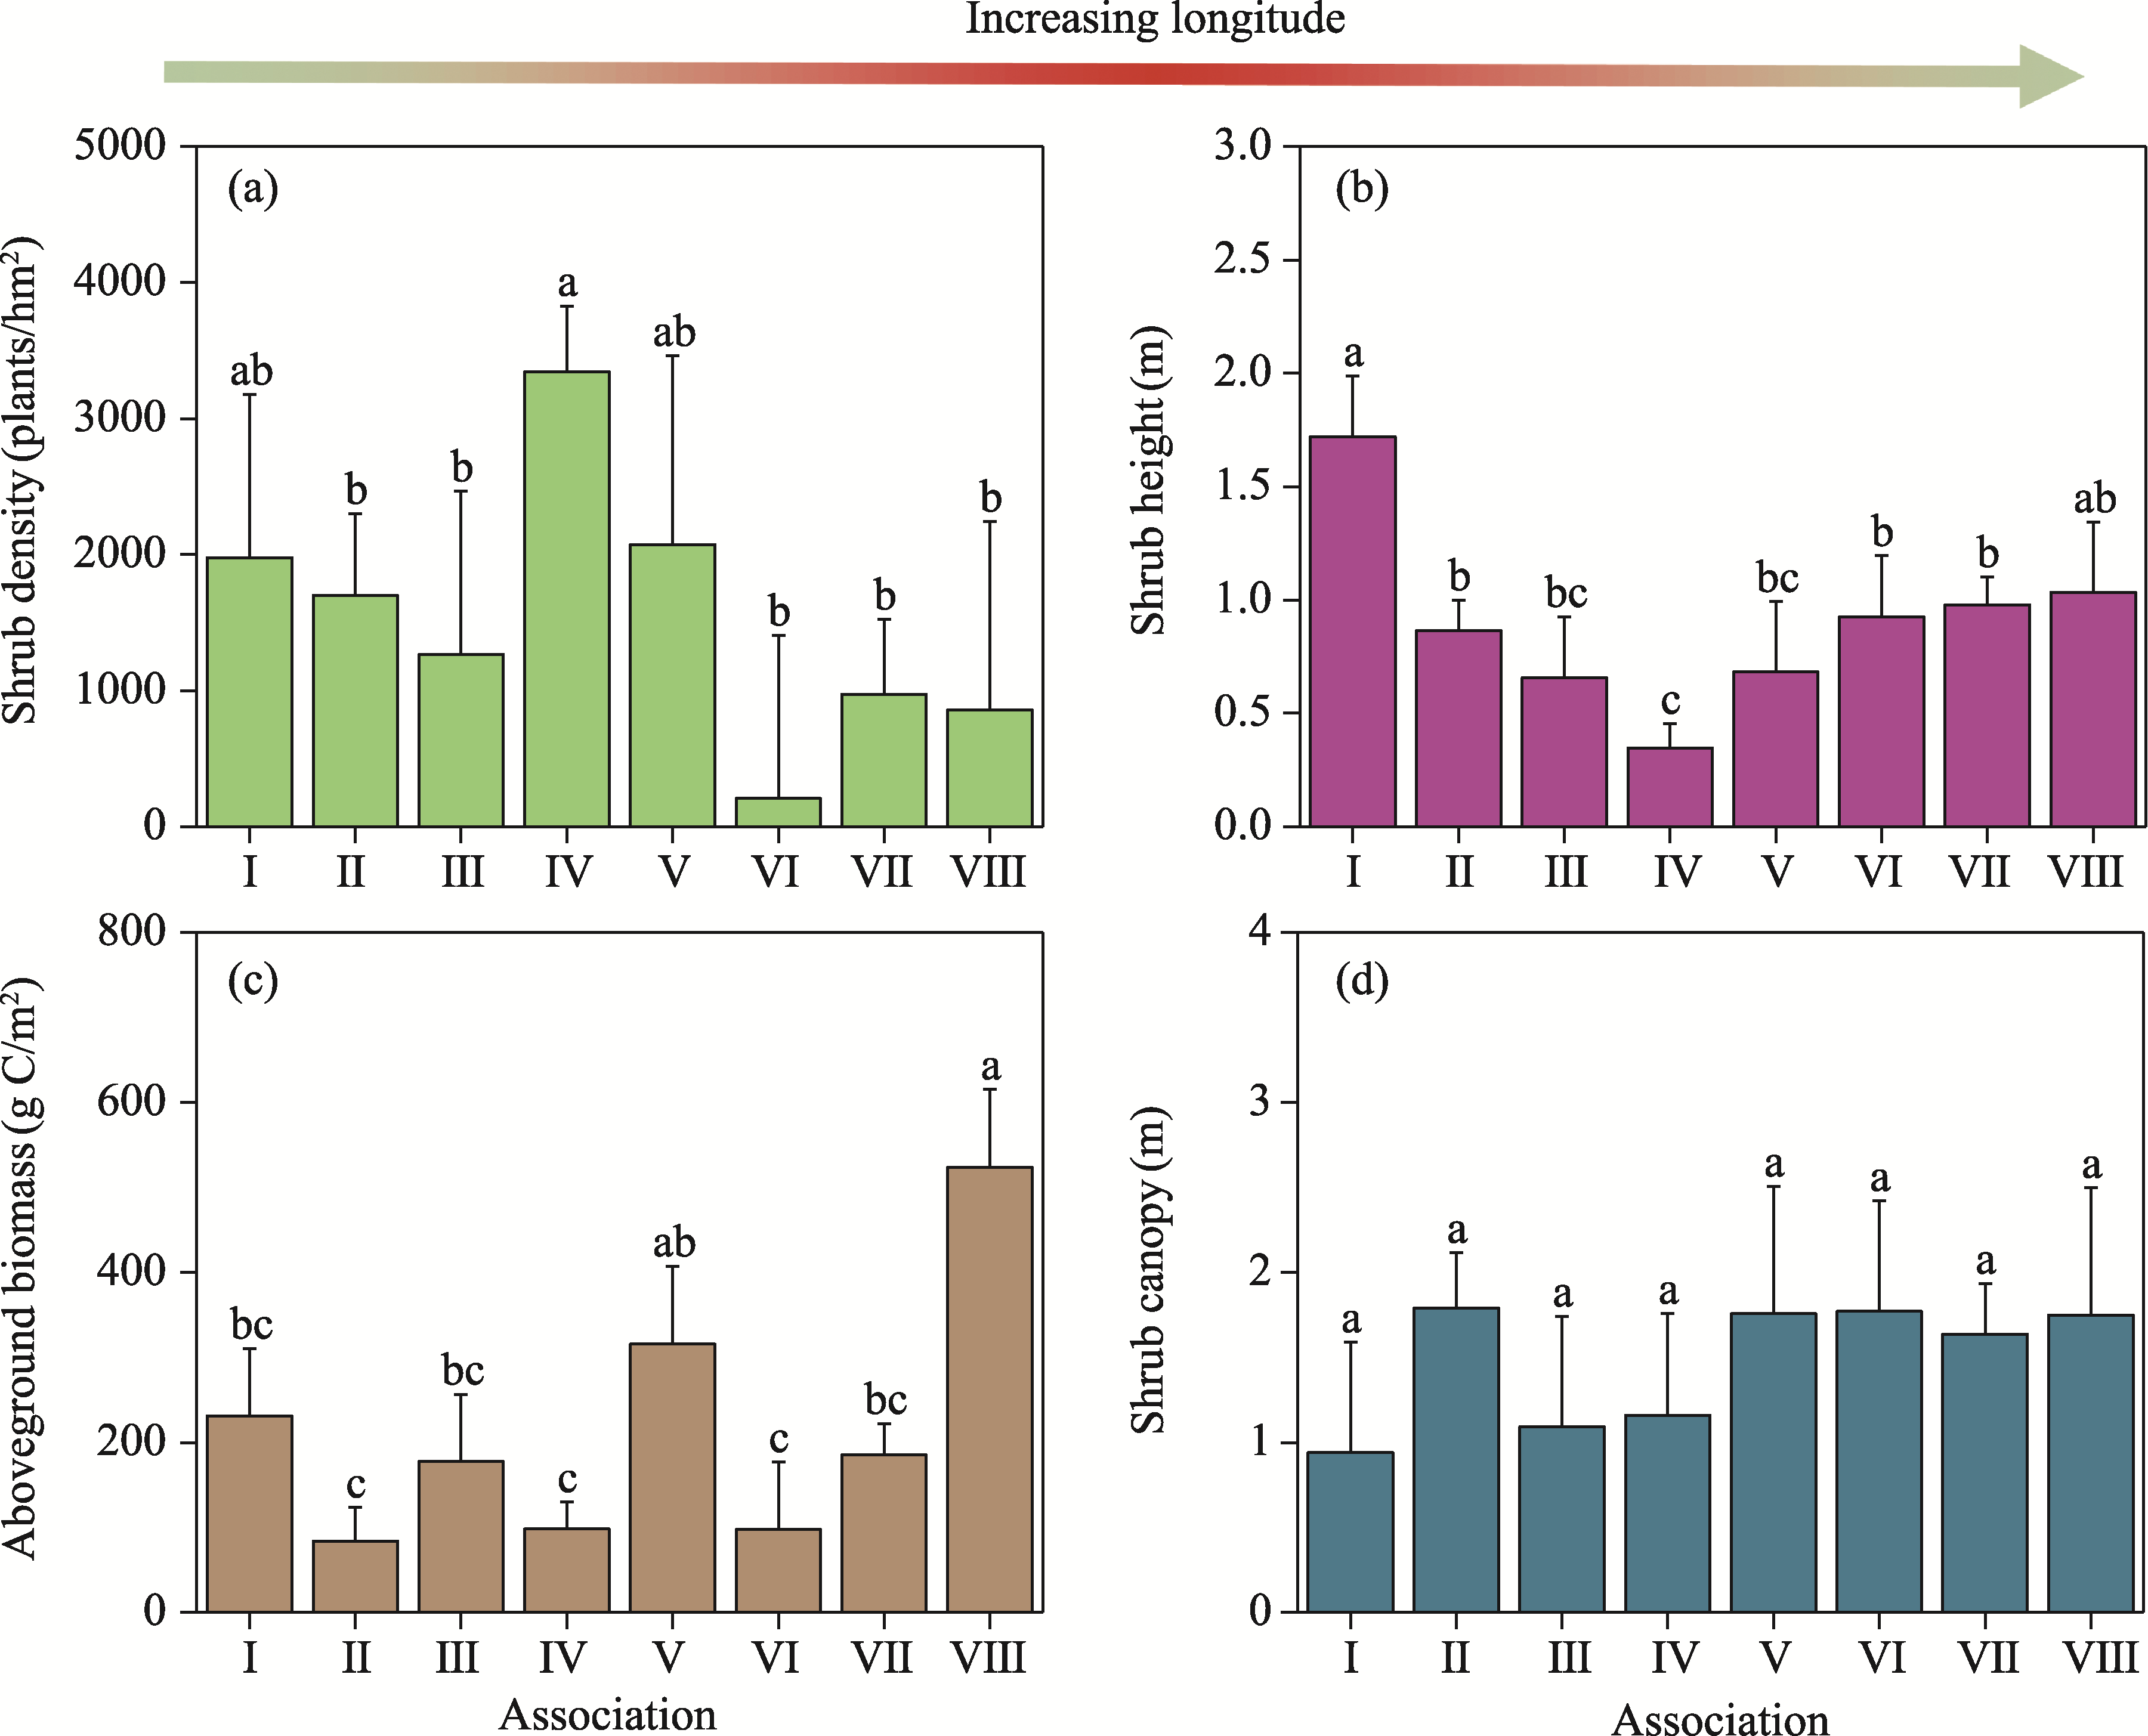
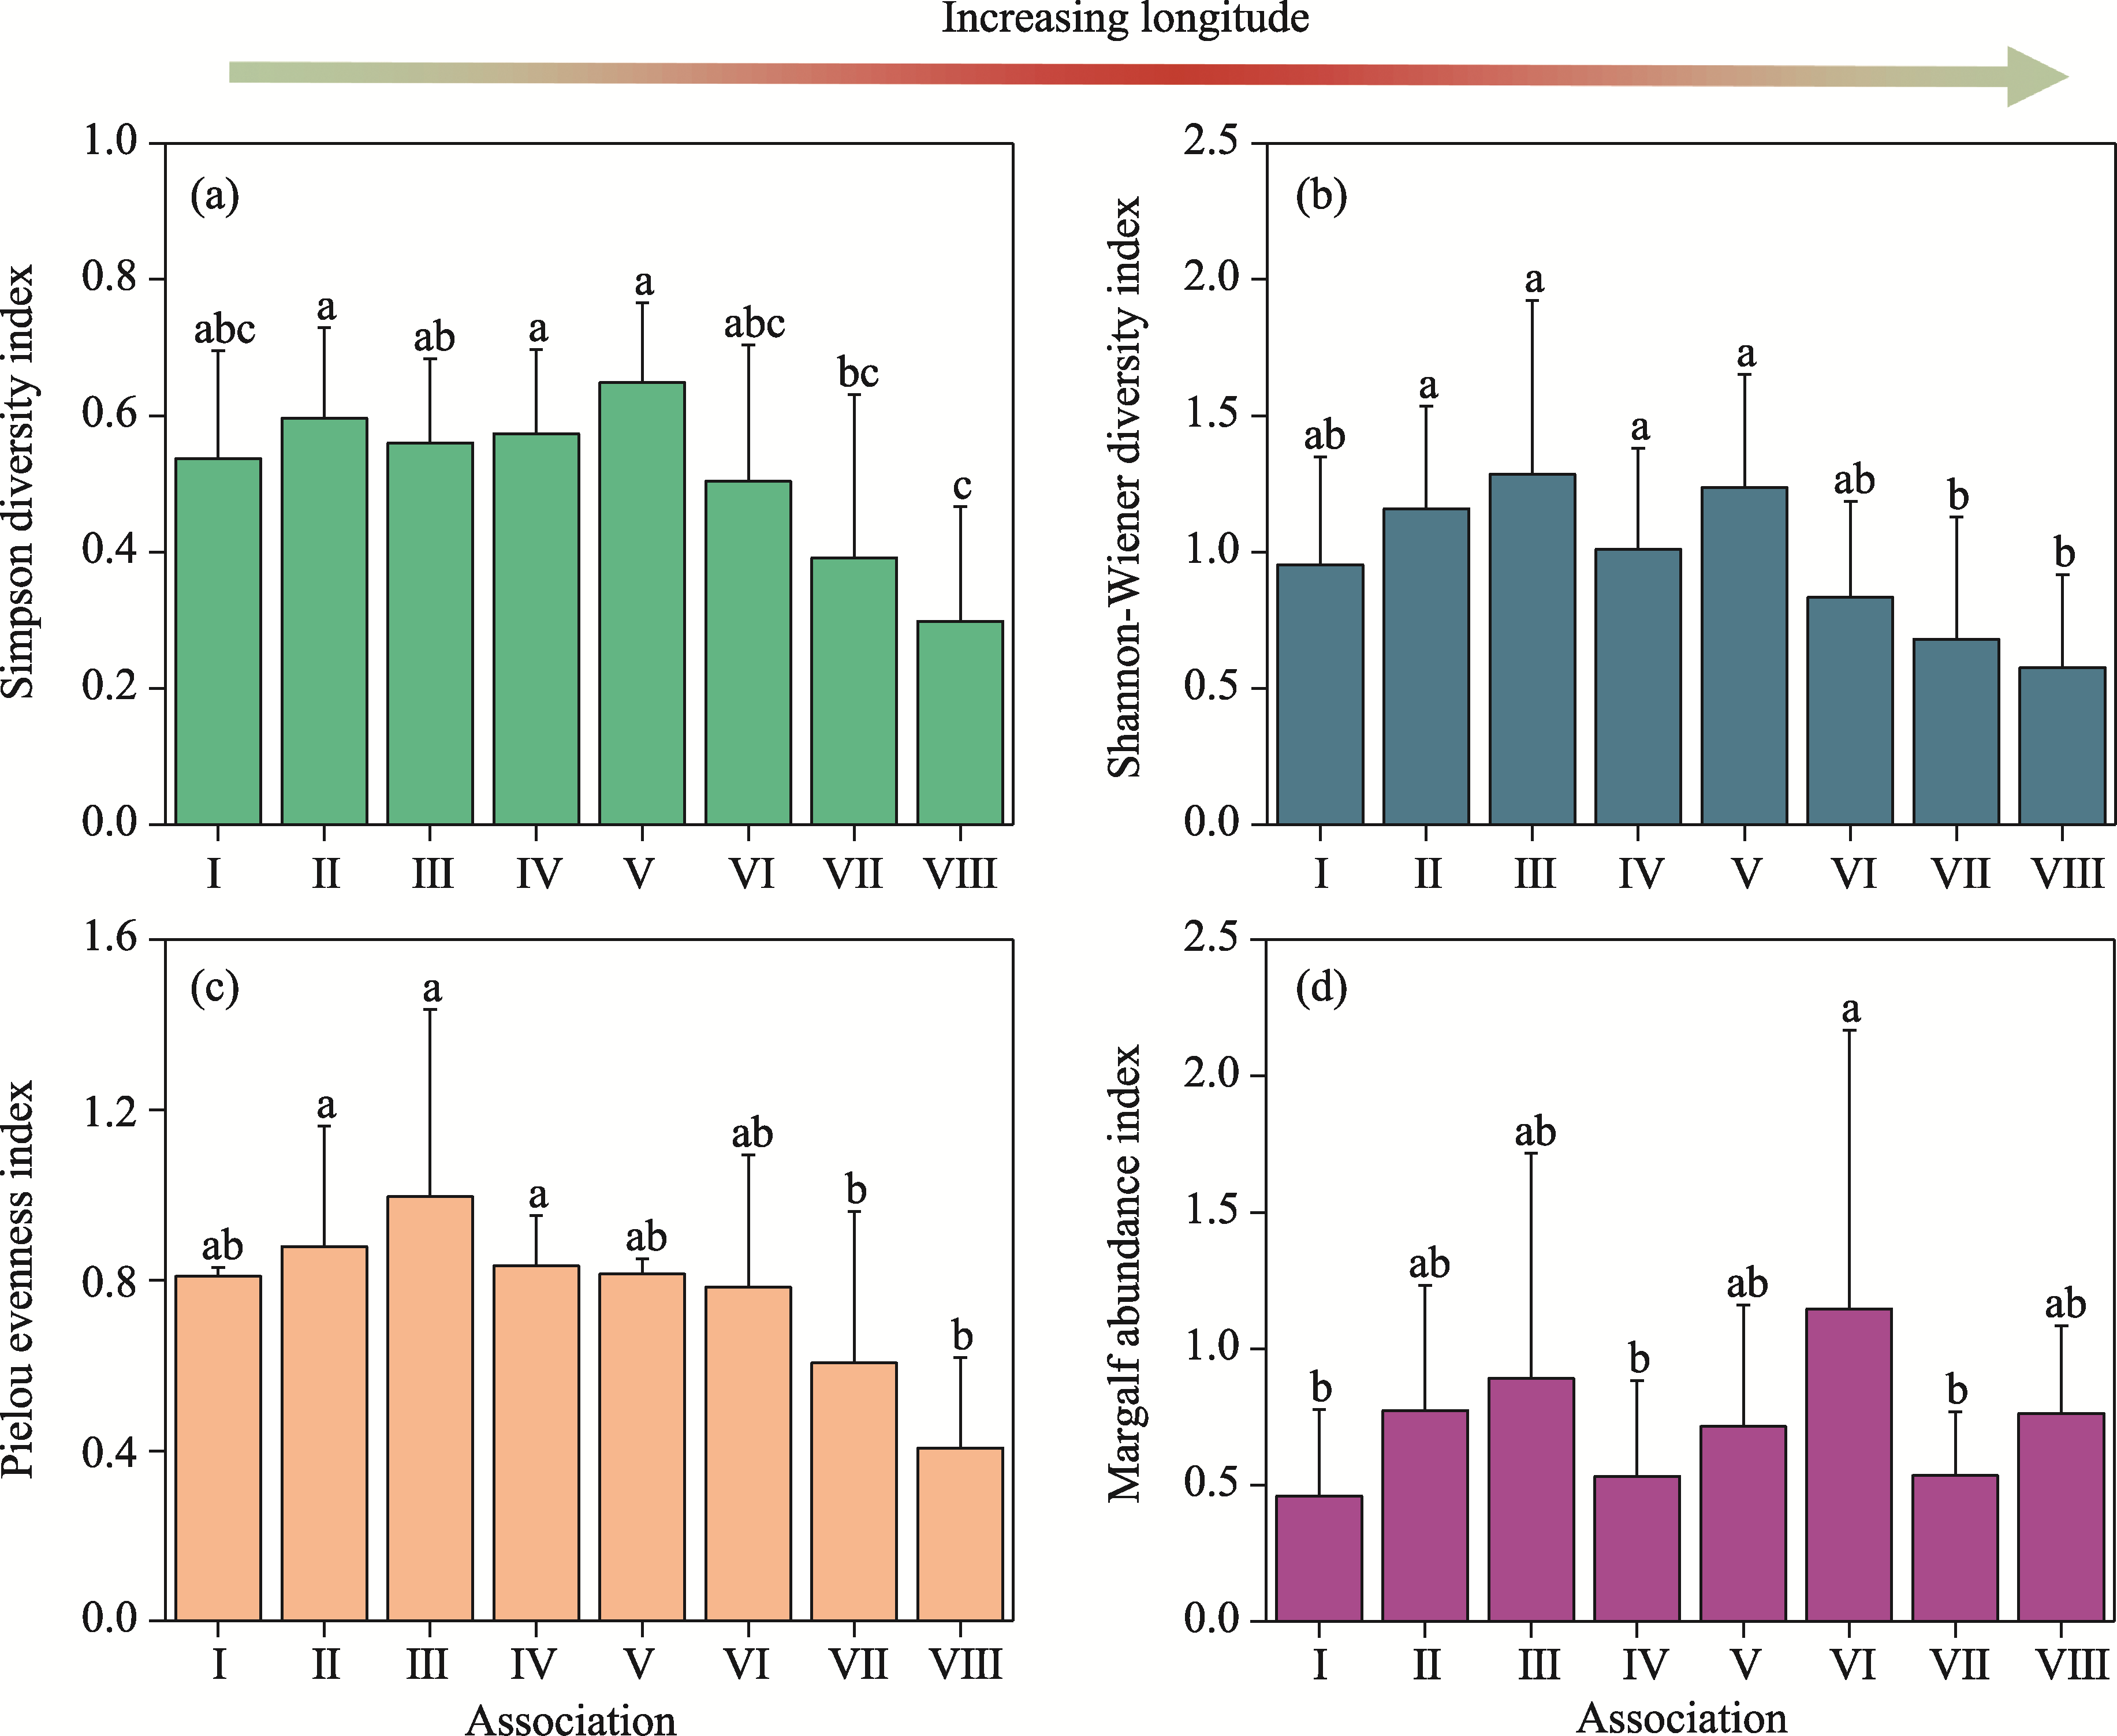
Abstract Soil salinization may affect biodiversity and species composition, leading to changes in the plant community structure. However, few studies have explored the spatial pattern of soil salinization and its effects on shrub community structure at the ecosystem scale. Therefore, we conducted a transect sampling of desert shrublands in Northwest China during the growing season (June-September) in 2021. Soil salinization (both the degree and type), shrub community structure (e.g., shrub density and height), and biodiversity parameters (e.g., Simpson diversity, Margalf abundance, Shannon-Wiener diversity, and Pielou evenness indices) were used to assess the effects of soil salinization on shrub community structure. The results showed that the primary degree of soil salinization in the study area was light salinization, with the area proportion of 69.8%. Whereas the main type of soil salinization was characterized as sulfate saline soil, also accounting for 69.8% of the total area. Notably, there was a significant reduction in the degree of soil salinization and a shift in the type of soil salinization from chloride saline soil to sulfate saline soil, with an increase in longitude. Regional mean annual precipitation (MAP), mean annual evapotranspiration (MAE), elevation, and slope significantly contributed to soil salinization and its geochemical differentiation. As soil salinization intensified, shrub community structure displayed increased diversity and evenness, as indicated by the increases in the Simpson diversity, Shannon-Wiener diversity, and Pielou evenness indices. Moreover, the succulent stems and leaves of Chenopodiaceae and Tamaricaceae exhibited clear advantages under these conditions. Furthermore, regional climate and topography, such as MAP, MAE, and elevation, had greater effects on the distribution of shrub plants than soil salinization. These results provide a reference for the origin and pattern of soil salinization in drylands and their effects on the community structure of halophyte shrub species.
|
|
Received: 31 January 2024
Published: 31 July 2024
|
|
Corresponding Authors:
* ZHENG Xinjun (E-mail: zhengxj@ms.xjb.ac.cn)
|
|
|
| [1] |
Adhikari S, Adhikari A, Weaver D K, et al. 2019. Impacts of agricultural management systems on biodiversity and ecosystem services in highly simplified dryland landscapes. Sustainability, 11(11): 3223, doi: 10.3390/su11113223.
|
|
|
| [2] |
Akhtar M, Zhao Y, Gao G, et al. 2022. Assessment of spatiotemporal variations of ecosystem service values and hotspots in a dryland: A case-study in Pakistan. Land Degradation and Development, 33(9): 1383-1397.
|
|
|
| [3] |
Bao S D. 2000. Soil Agrochemical Analysis (3rd ed.). Beijing: China Agriculture Press, 25-114. (in Chinese)
|
|
|
| [4] |
Bao X T, Ding L B, Yao S C, et al. 2019. Quantitative classification and ordination of grassland communities on the Lhasa River Basin. Acta Ecologica Sinica, 39(3): 779-786. (in Chinese)
|
|
|
| [5] |
Cao C Y, Jiang D M, Zhu L H, et al. 2006. Degradation and diversity changes of meadow grassland in Keerqin Sandy Land. Acta Prataculturae Sinica, 15(3): 18-26. (in Chinese)
|
|
|
| [6] |
Chen B M, Jing X, Liu S S, et al. 2022a. Intermediate human activities maximize dryland ecosystem services in the long-term land-use change: Evidence from the Sangong River watershed, Northwest China. Journal of Environmental Management, 319: 115708, doi: 10.1016/j.jenvman.2022.115708.
|
|
|
| [7] |
Chen X, Luo M, Tan J, et al. 2022b. Salt-tolerant plant moderates the effect of salinity on soil organic carbon mineralization in a subtropical tidal wetland. Science of the Total Environment, 837: 155855, doi: 10.1016/j.scitotenv.2022.155855.
|
|
|
| [8] |
Corwin D L. 2021. Climate change impacts on soil salinity in agricultural areas. European Journal of Soil Science, 72(2): 842-862.
|
|
|
| [9] |
Deinlein U, Stephan A B, Horie T, et al. 2014. Plant salt-tolerance mechanisms. Trends in Plant Science, 19(6): 371-379.
doi: 10.1016/j.tplants.2014.02.001
pmid: 24630845
|
|
|
| [10] |
Ding J L, Chen W Q, Chen Y. 2016. Soil salinization disaster warning in arid zones: A case study in the Ugan-Kuqa oasis. Journal of Desert Research, 36(4): 1079-1086. (in Chinese)
doi: 10.7522/j.issn.1000-694X.2015.00067
|
|
|
| [11] |
Dixon P. 2003. VEGAN, a package of R functions for community ecology. Journal of Vegetation Science, 14(6): 927-930.
|
|
|
| [12] |
Duan H L, Zhao A, Yao Z. 2017. Overview of ordination methods application in relationship between plant community and environment. Journal of Tropical and Subtropical Botany, 25(2): 202-208. (in Chinese)
|
|
|
| [13] |
Fick S E, Hijmans R J. 2017. WorldClim 2: new 1-km spatial resolution climate surfaces for global land areas. International Journal of Climatology, 37(12): 4302-4315.
|
|
|
| [14] |
Glenn E P, Brown J J, Blumwald E. 1999. Salt tolerance and crop potential of halophytes. Critical Reviews in Plant Sciences, 18(2): 227-255.
|
|
|
| [15] |
Gui D W, Lei J Q, Zeng F J, et al. 2010. Effect of ecological factors on plant communities of the Cele River Basin on the north slope of the middle Kunlun Mountains. Acta Prataculturae Sinica, 19(3): 38-46. (in Chinese)
|
|
|
| [16] |
Hassani A, Azapagic A, Shokri N. 2021. Global predictions of primary soil salinization under changing climate in the 21st century. Nature Communications, 12(1): 6663, doi: 10.1038/s41467-021-26907-3.
|
|
|
| [17] |
Jolly I D, McEwan K L, Holland K L. 2008. A review of groundwater-surface water interactions in arid/semi-arid wetlands and the consequences of salinity for wetland ecology. Ecohydrology, 1(1): 43-58.
|
|
|
| [18] |
Kuang W H, Liu J Y, Tian H Q, et al. 2022. Cropland redistribution to marginal lands undermines environmental sustainability. National Science Review, 9(1): nwab091, doi: 10.1093/nsr/nwab091.
|
|
|
| [19] |
Lan T. 2023. Geochemical evaluation and cause analysis of soil salinization in the west of Jilin Province. PhD Dissertation. Changchun: Jilin University. (in Chinese)
|
|
|
| [20] |
Li C J, Fu B J, Wang S, et al. 2021. Drivers and impacts of changes in China's drylands. Nature Reviews Earth and Environment, 2(12): 858-873.
|
|
|
| [21] |
Li R R. 2016. Spatial pattern of soil salinization in the lower reaches of the plain reservoirs in arid area: A case study of the Liuchengzi reservoir. MSc Thesis. Urumqi: Xinjiang University. (in Chinese)
|
|
|
| [22] |
Liang M, Mi X J, Li C H, et al. 2022. Salinity characteristics and halophytic vegetation diversity of uncultivated saline-alkali soil in Junggar Basin, Xinjiang. Arid Land Geography, 45(1): 185-196. (in Chinese)
|
|
|
| [23] |
Liang W J, Ma X L, Wan P, et al. 2018. Plant salt-tolerance mechanism: A review. Biochemical and Biophysical Research Communications, 495(1): 286-291.
doi: S0006-291X(17)32220-9
pmid: 29128358
|
|
|
| [24] |
Liu H L, Chu G X, Zhao F M, et al. 2010. Study on the variation and trend analysis of soil secondary salinization of cotton field under long-term drip irrigation condition in northern Xinjiang. Soil and Fertilizer Sciences in China, (4): 12-17. (in Chinese)
|
|
|
| [25] |
Liu J, Su Y G, Li Y, et al. 2021a. Shrub colonization regulates δ13C enrichment between soil and vegetation in deserts by affecting edaphic variables. Catena, 203: 105365, doi: 10.1016/j.catena.2021.105365.
|
|
|
| [26] |
Liu J L, Liu L, Ma X Y, et al. 2018. Spatial variability of soil salt in different soil layers at different scales. Journal of Basic Science and Engineering, 26(2): 305-312. (in Chinese)
|
|
|
| [27] |
Liu X H, Zhang Q Q, Xu H L, et al. 2021b. Spatial distribution and species diversity of saline-alkali plant communities in northern Xinjiang. Acta Ecologica Sinica, 41(4): 1501-1513. (in Chinese)
|
|
|
| [28] |
Liu Y F, Cui Z, Huang Z, et al. 2022. Shrub encroachment in alpine meadows increases the potential risk of surface soil salinization by redistributing soil water. Catena, 219: 106593, doi: 10.1016/j.catena.2022.106593.
|
|
|
| [29] |
Lu B J, Tian S C, Zuo Z, et al. 2023. Review and prospect on sustainable utilization of salinized land. Journal of Ningxia University (Natural Science Edition), 44(1): 79-88. (in Chinese)
|
|
|
| [30] |
Lv S L, Jiang P, Chen X Y, et al. 2012. Multiple compartmentalization of sodium conferred salt tolerance in Salicornia europaea. Plant Physiology and Biochemistry, 51: 47-52.
|
|
|
| [31] |
Ma M J, Zhou X H, Ma Z, et al. 2012. Composition of the soil seed bank and vegetation changes after wetland drying and soil salinization on the Tibetan Plateau. Ecological Engineering, 44: 18-24.
|
|
|
| [32] |
Masoud A A, El-Horiny M M, Atwia M G, et al. 2018. Assessment of groundwater and soil quality degradation using multivariate and geostatistical analyses, Dakhla Oasis, Egypt. Journal of African Earth Sciences, 142: 64-81.
|
|
|
| [33] |
McGeorge W T. 1954. Diagnosis and improvement of saline and alkaline soils. Soil Science Society of America Journal, 18(3): 348-348.
|
|
|
| [34] |
Moeslund J E, Arge L, Bøcher P K, et al. 2011. Geographically comprehensive assessment of salt-meadow vegetation-elevation relations using LiDAR. Wetlands, 31(3): 471-482.
|
|
|
| [35] |
Mora J L, Herrero J, Weindorf D C. 2017. Multivariate analysis of soil salination-desalination in a semi-arid irrigated district of Spain. Geoderma, 291: 1-10.
|
|
|
| [36] |
Oksanen J, Hill M O. 2023. Jarioksa/twinspan: Two-Way Indicator Species Analysis. R package version 0.9-3. [2023-12-02]. https://rdrr.io/github/jarioksa/twinspan/.
|
|
|
| [37] |
Pauloo R A, Fogg G E, Guo Z, et al. 2021. Anthropogenic basin closure and groundwater salinization (ABCSAL). Journal of Hydrology, 593: 125787, doi: 10.1016/j.jhydrol.2020.125787.
|
|
|
| [38] |
Pessarakli M. 1991. Formation of saline and sodic soils and their reclamation. Journal of Environmental Science and Health. Part A: Environmental Science and Engineering and Toxicology, 26(7): 1303-1320.
|
|
|
| [39] |
Prăvălie R, Patriche C, Borrelli P, et al. 2021. Arable lands under the pressure of multiple land degradation processes. A global perspective. Environmental Research, 194: 110697, doi: 10.1016/j.envres.2020.110697.
|
|
|
| [40] |
R Core Team. 2023. R: A Language and Environment for Statistical Computing. R Foundation for Statistical Computing, Vienna, Austria. [2023-12-02]. https://www.R-project.org/.
|
|
|
| [41] |
Schild J E M, Vermaat J E, de Groot R S, et al. 2018. A global meta-analysis on the monetary valuation of dryland ecosystem services: The role of socio-economic, environmental and methodological indicators. Ecosystem Services, 32: 78-89.
|
|
|
| [42] |
Schulz J J, Cayuela L, Echeverria C, et al. 2010. Monitoring land cover change of the dryland forest landscape of Central Chile (1975-2008). Applied Geography, 30(3): 436-447.
|
|
|
| [43] |
Seydehmet J, Lv G H, Nurmemet I, et al. 2018. Model prediction of secondary soil salinization in the Keriya Oasis, Northwest China. Sustainability, 10(3): 656, doi: 10.3390/su10030656.
|
|
|
| [44] |
Shi J P, Song G, 2016. Soil type database of China: A nationwide soil dataset based on the second national soil survey. Science Data Bank, 1(2): 86101, doi: 10.11922/csdata.170.2015.0033.
|
|
|
| [45] |
Sidike A, Zhao S, Wen Y. 2014. Estimating soil salinity in Pingluo County of China using QuickBird data and soil reflectance spectra. International Journal of Applied Earth Observation and Geoinformation, 26: 156-175.
|
|
|
| [46] |
Singh A. 2021. Soil salinization management for sustainable development: A review. Journal of Environmental Management, 277: 111383, doi: 10.1016/j.jenvman.2020.111383.
|
|
|
| [47] |
Tian A H, Fu C B, Su X Y, et al. 2019. Classifying and predicting salinization level in arid area soil using a combination of Chua's circuit and fractional order Sprott chaotic system. Sensors, 19(20): 4517, doi: 10.3390/s19204517.
|
|
|
| [48] |
Tomaz A, Palma P, Fialho S, et al. 2020. Risk assessment of irrigation-related soil salinization and sodification in Mediterranean areas. Water, 12(12): 3569, doi: 10.3390/w12123569.
|
|
|
| [49] |
Van Couwenberghe R, Collet C, Lacombe E, et al. 2010. Gap partitioning among temperate tree species across a regional soil gradient in windstorm-disturbed forests. Forest Ecology and Management, 260(1): 146-154.
|
|
|
| [50] |
Wang X S, He J, Ma P, et al. 2023. Responses of the vegetation community structure and carbon storage of temperate meadow steppe to salinization in Huihe Reserve. Acta Agrestia Sinica, 31(4): 1154-1162. (in Chinese)
|
|
|
| [51] |
Wang Y G, Deng C Y, Liu Y, et al. 2018. Identifying change in spatial accumulation of soil salinity in an inland river watershed, China. Science of the Total Environment, 621: 177-185.
|
|
|
| [52] |
Wei Y, Ding J L, Wang F, et al. 2016. Analysis of the spatial variational characteristics of saline-alkaline soil types in non-agriculture land in Manas River Basin, Xinjiang, China. Acta Ecologica Sinica, 36(23): 7655-7666. (in Chinese)
|
|
|
| [53] |
Xiao D N, Li X Y, Song D M, et al. 2007. Temporal and spatial dynamical simulation of groundwater characteristics in Minqin Oasis. Science in China Series D: Earth Sciences, 50(2): 261-273.
|
|
|
| [54] |
Xu H G, Liu S R. 2004. Effects of soil salinization on halophytic vegetation. Inner Mongolia Prataculture, 16(2): 1-2. (in Chinese)
|
|
|
| [55] |
Xue Q Q, Zhao L L, Wang Y X, et al. 2021. Research progress on salt tolerance of halophytes. Chinese Wild Plant Resources, 40(5): 60-65. (in Chinese)
|
|
|
| [56] |
Yan A, Jiang P G, Sheng J D, et al. 2014. Spatial variability of surface soil salinity in Manas River Basin. Acta Pedologica Sinica, 51(2): 410-414. (in Chinese)
|
|
|
| [57] |
Yang H M, Xu H L, Fan Z L, et al. 2010. Spatial variability and pattern of surface soil salinity in the lower reaches of the Tarim River. Journal of Desert Research, 30(3): 564-570. (in Chinese)
|
|
|
| [58] |
Yang H T, Wang Z R, Tan H J, et al. 2017. Allometric models for estimating shrub biomass in desert grassland in northern China. Arid Land Research and Management, 31(3): 283-300.
|
|
|
| [59] |
Yang J S. 2008. Development and prospect of the research on salt-affected soils in China. Acta Pedologica Sinica, 45(5): 837-845. (in Chinese)
|
|
|
| [60] |
Yao S C, Wang J S, Ding L B, et al. 2018. Quantitative classification and ordination of grassland communities in Lhasa River Valley. Acta Ecologica Sinica, 38(13): 4779-4788. (in Chinese)
|
|
|
| [61] |
Zhang Z Y, Li X Y, Liu L J, et al. 2020. Influence of mulched drip irrigation on landscape scale evapotranspiration from farmland in an arid area. Agricultural Water Management, 230: 105953, doi: 10.1016/j.agwat.2019.105953.
|
|
|
| [62] |
Zhao K F, Fan H, Song J, et al. 2005. Two Na+ and Cl- hyperaccumulators of the Chenopodiaceae. Journal of Integrative Plant Biology, 47(3): 311-318.
|
|
|
| [63] |
Zhao Y T, Wang G D, Zhao M L, et al. 2022a. Direct and indirect effects of soil salinization on soil seed banks in salinizing wetlands in the Songnen Plain, China. Science of the Total Environment, 819: 152035, doi: 10.1016/j.scitotenv.2021.152035.
|
|
|
| [64] |
Zhao Y T, Wang G D, Zhao M L, et al. 2022b. How soil salinization and alkalinization drive vegetation change in salt-affected inland wetlands. Plant and Soil, 480(1-2): 571-581.
|
|
|
| [65] |
Zhao Z Z, Chen J S, Peng E R, et al. 2023. Research progress on soil salinization and management. China Rural Water and Hydropower, (6): 202-208. (in Chinese)
|
|
|
| [66] |
Zheng Q, Wang H J, Li W T, et al. 2016. Factors influencing soil salinization in Manasi River Basin, China. Journal of Agricultural Resources and Environment, 33(3): 214-220. (in Chinese)
|
|
|
| [67] |
Zhou H Z. 2002. Sharing of soil information data distributed inquiry data base of 1:4M soil information of China. Acta Pedologica Sinica, 39(4): 483-489. (in Chinese)
|
|
|
| [68] |
Zhou Z M, Zhao S H. 2015. Influencing factors on surface soil salt accumulation in the semi-arid North China Plain. Arid Land Geography, 38(5): 976-984. (in Chinese)
|
|
|
| [69] |
Zhu H, He Y. 2019. Soil Geography (3rd ed.). Beijing: Higher Education Press, 56-58. (in Chinese)
|
|
|
| [70] |
Zhu H Q, Li Y H, Li F D. 2018. Characteristics of soil moisture, salinity and nutrients in different plant communities of Ebinur Lake wetland during the past decade. Acta Botanica Boreali-Occidentalia Sinica, 38(3): 535-543. (in Chinese)
|
|
|
|
Viewed |
|
|
|
Full text
|
|
|
|
|
Abstract
|
|
|
|
|
Cited |
|
|
|
|
| |
Shared |
|
|
|
|
| |
Discussed |
|
|
|
|