| Research article |
|


|
|
|
| Trade-offs and synergies between ecosystem services in Yutian County along the Keriya River Basin, Northwest China |
ZUBAIDA Muyibul*( ) ) |
| College of Tourism, Xinjiang University, Urumqi 830049, China |
|
|
|
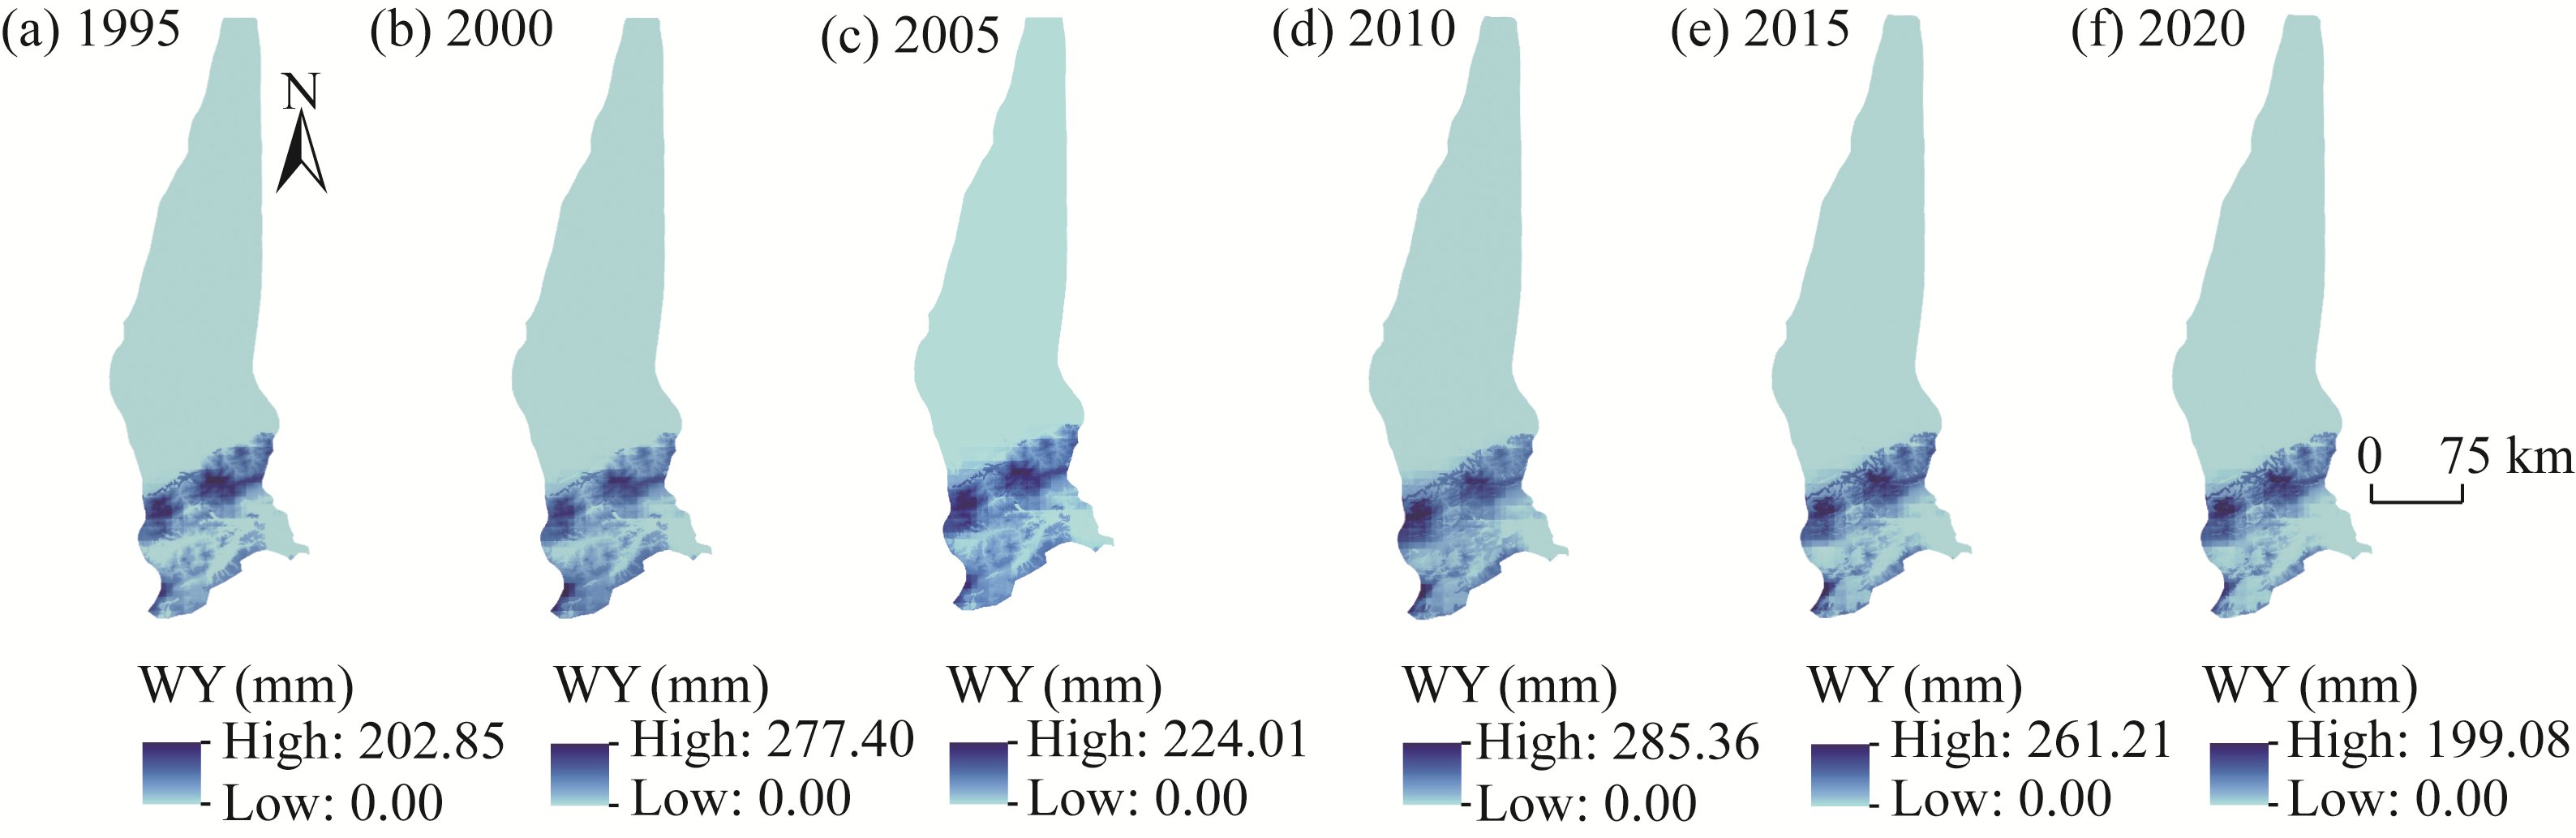
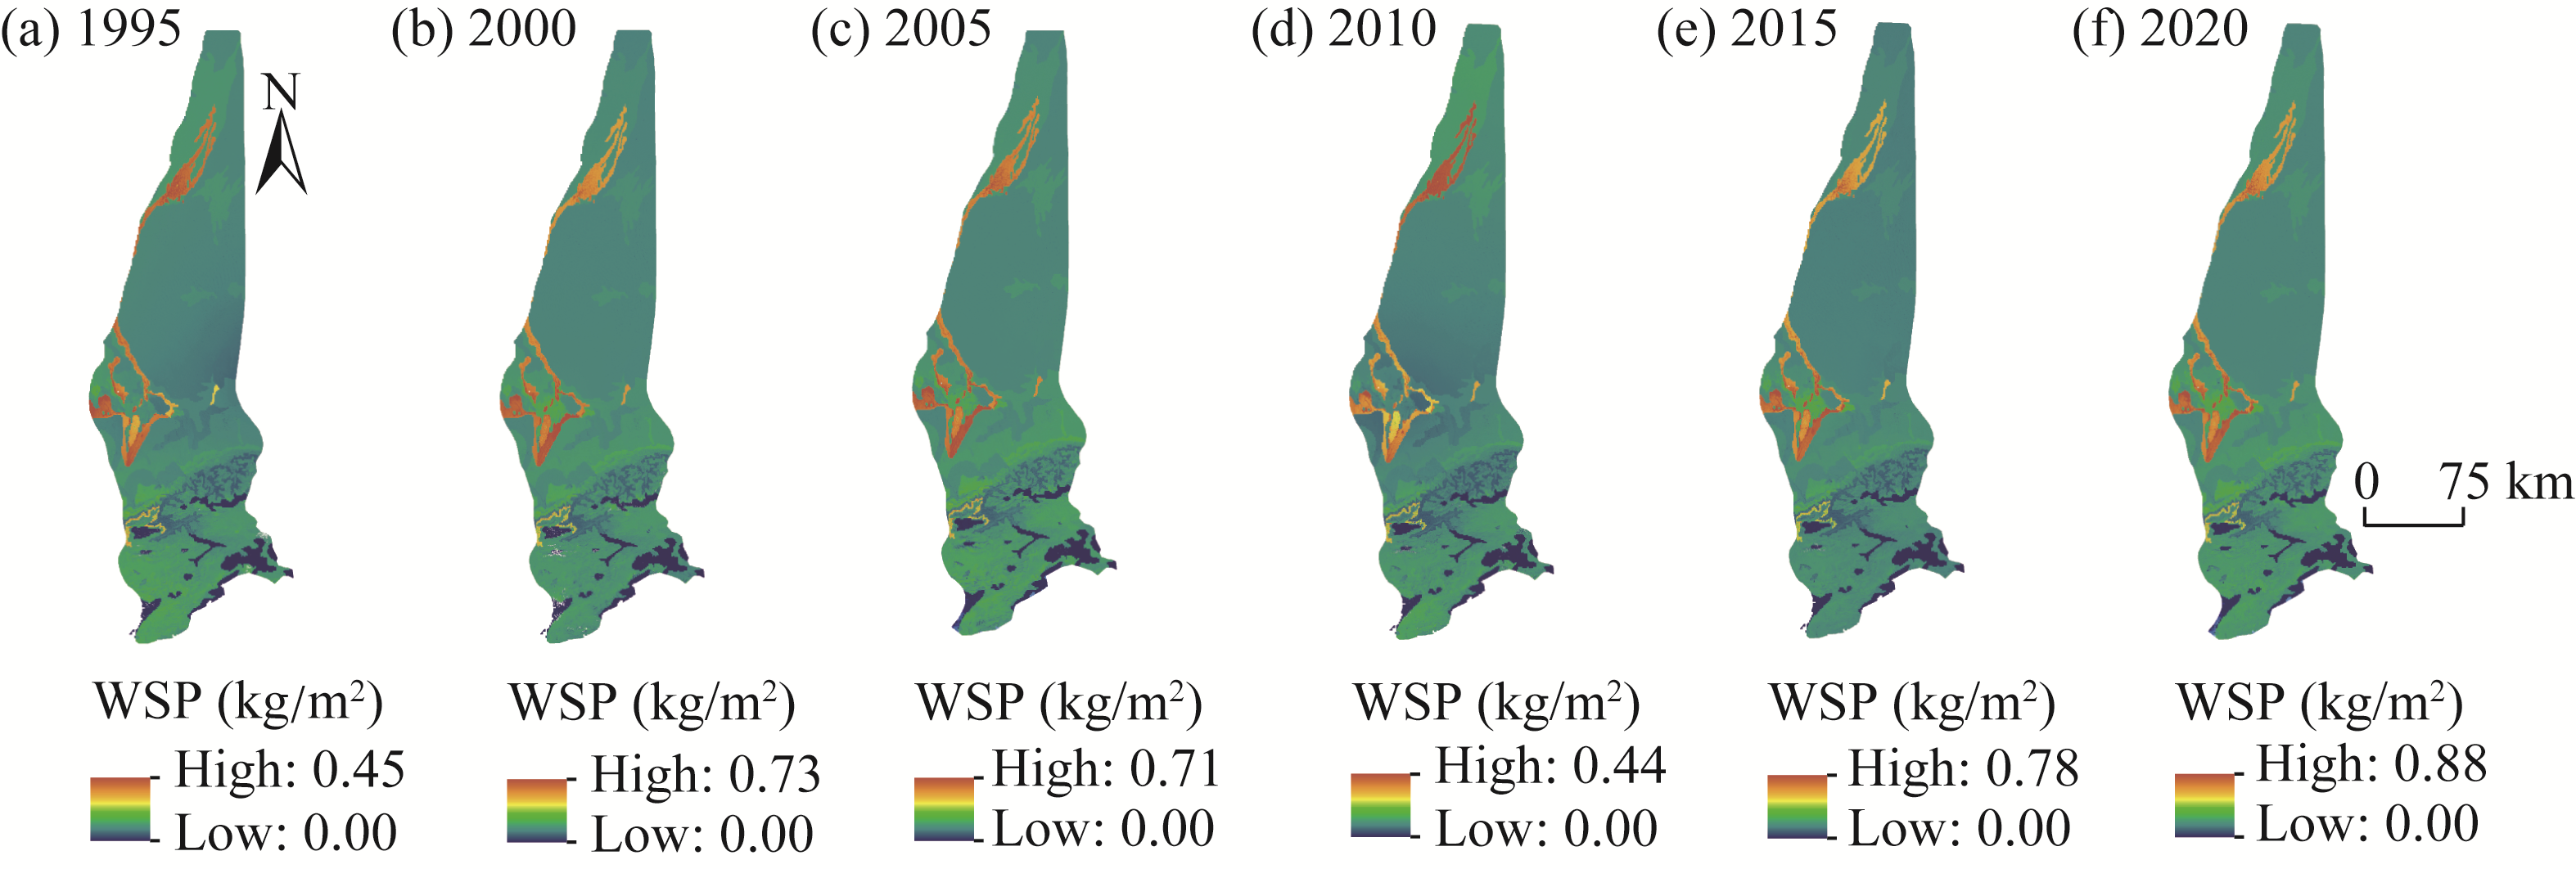
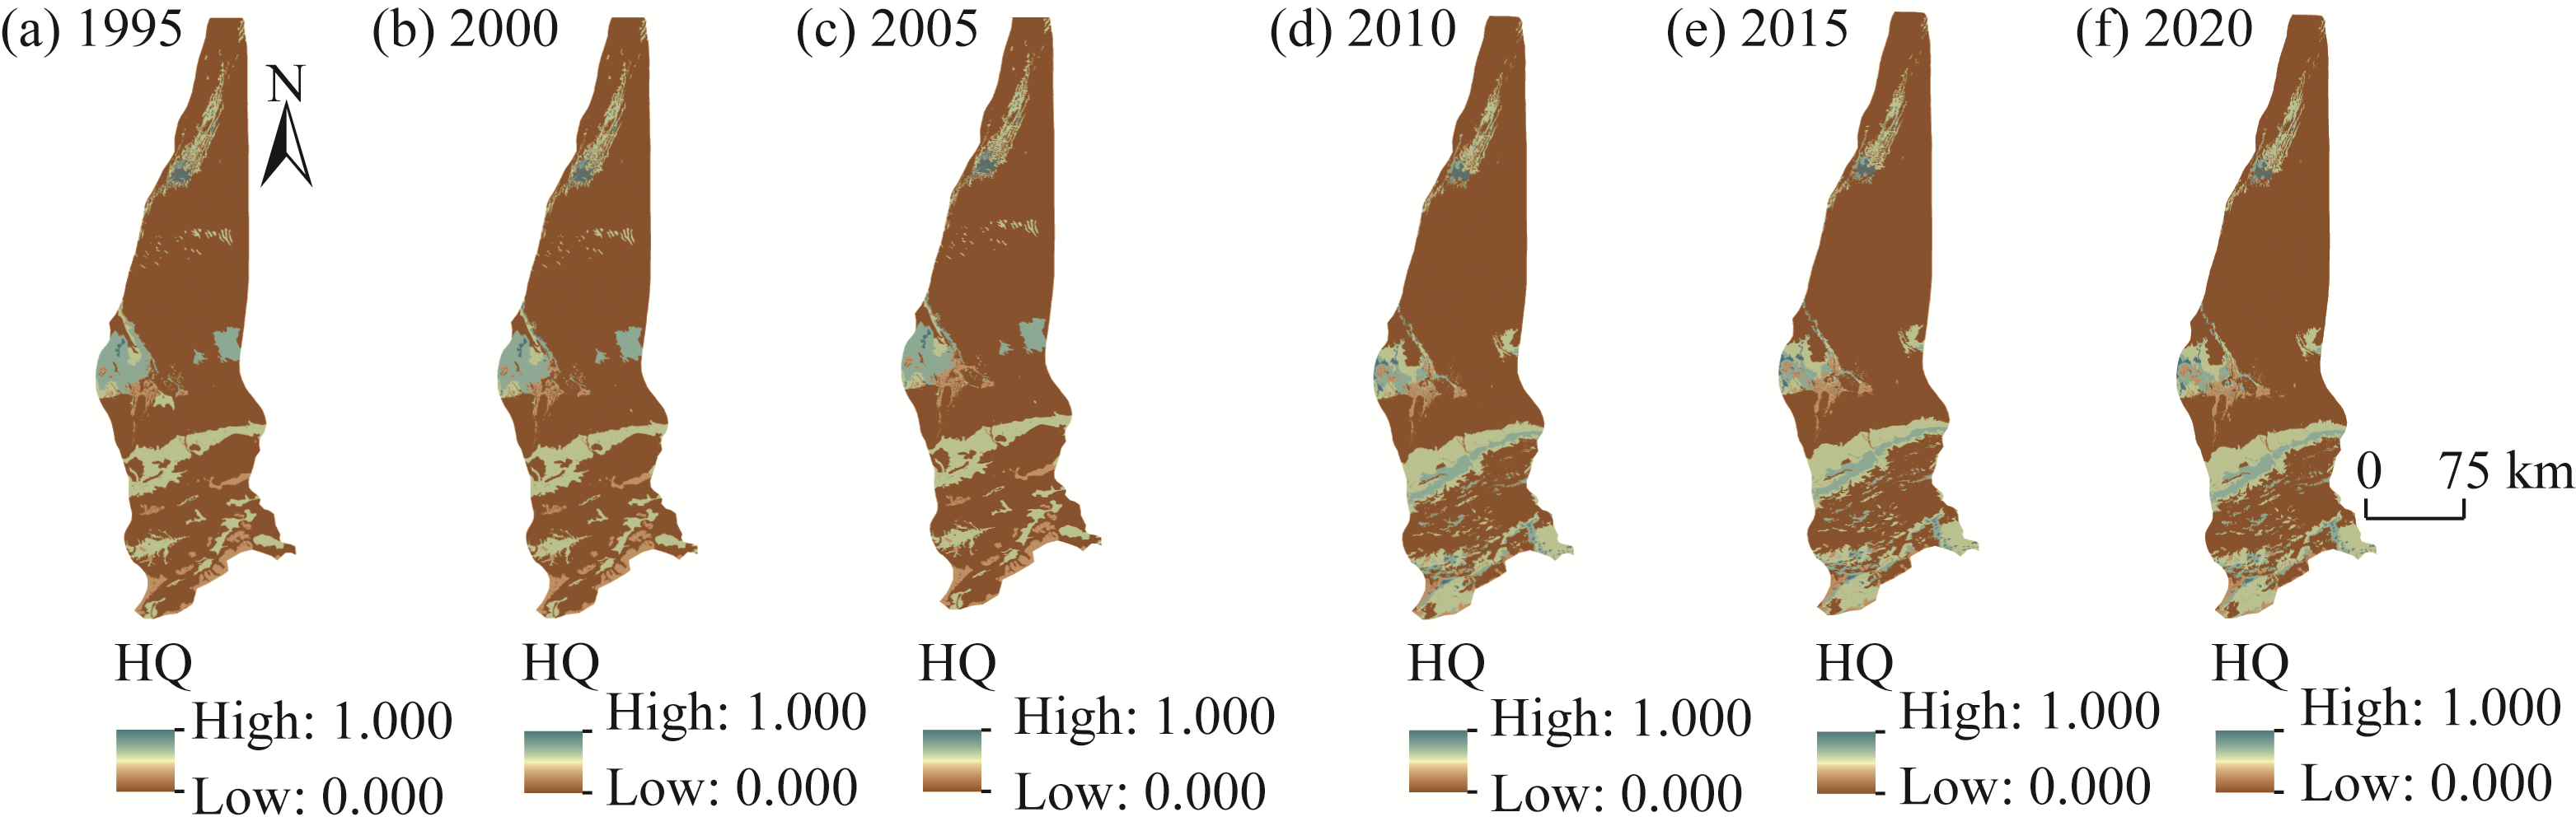
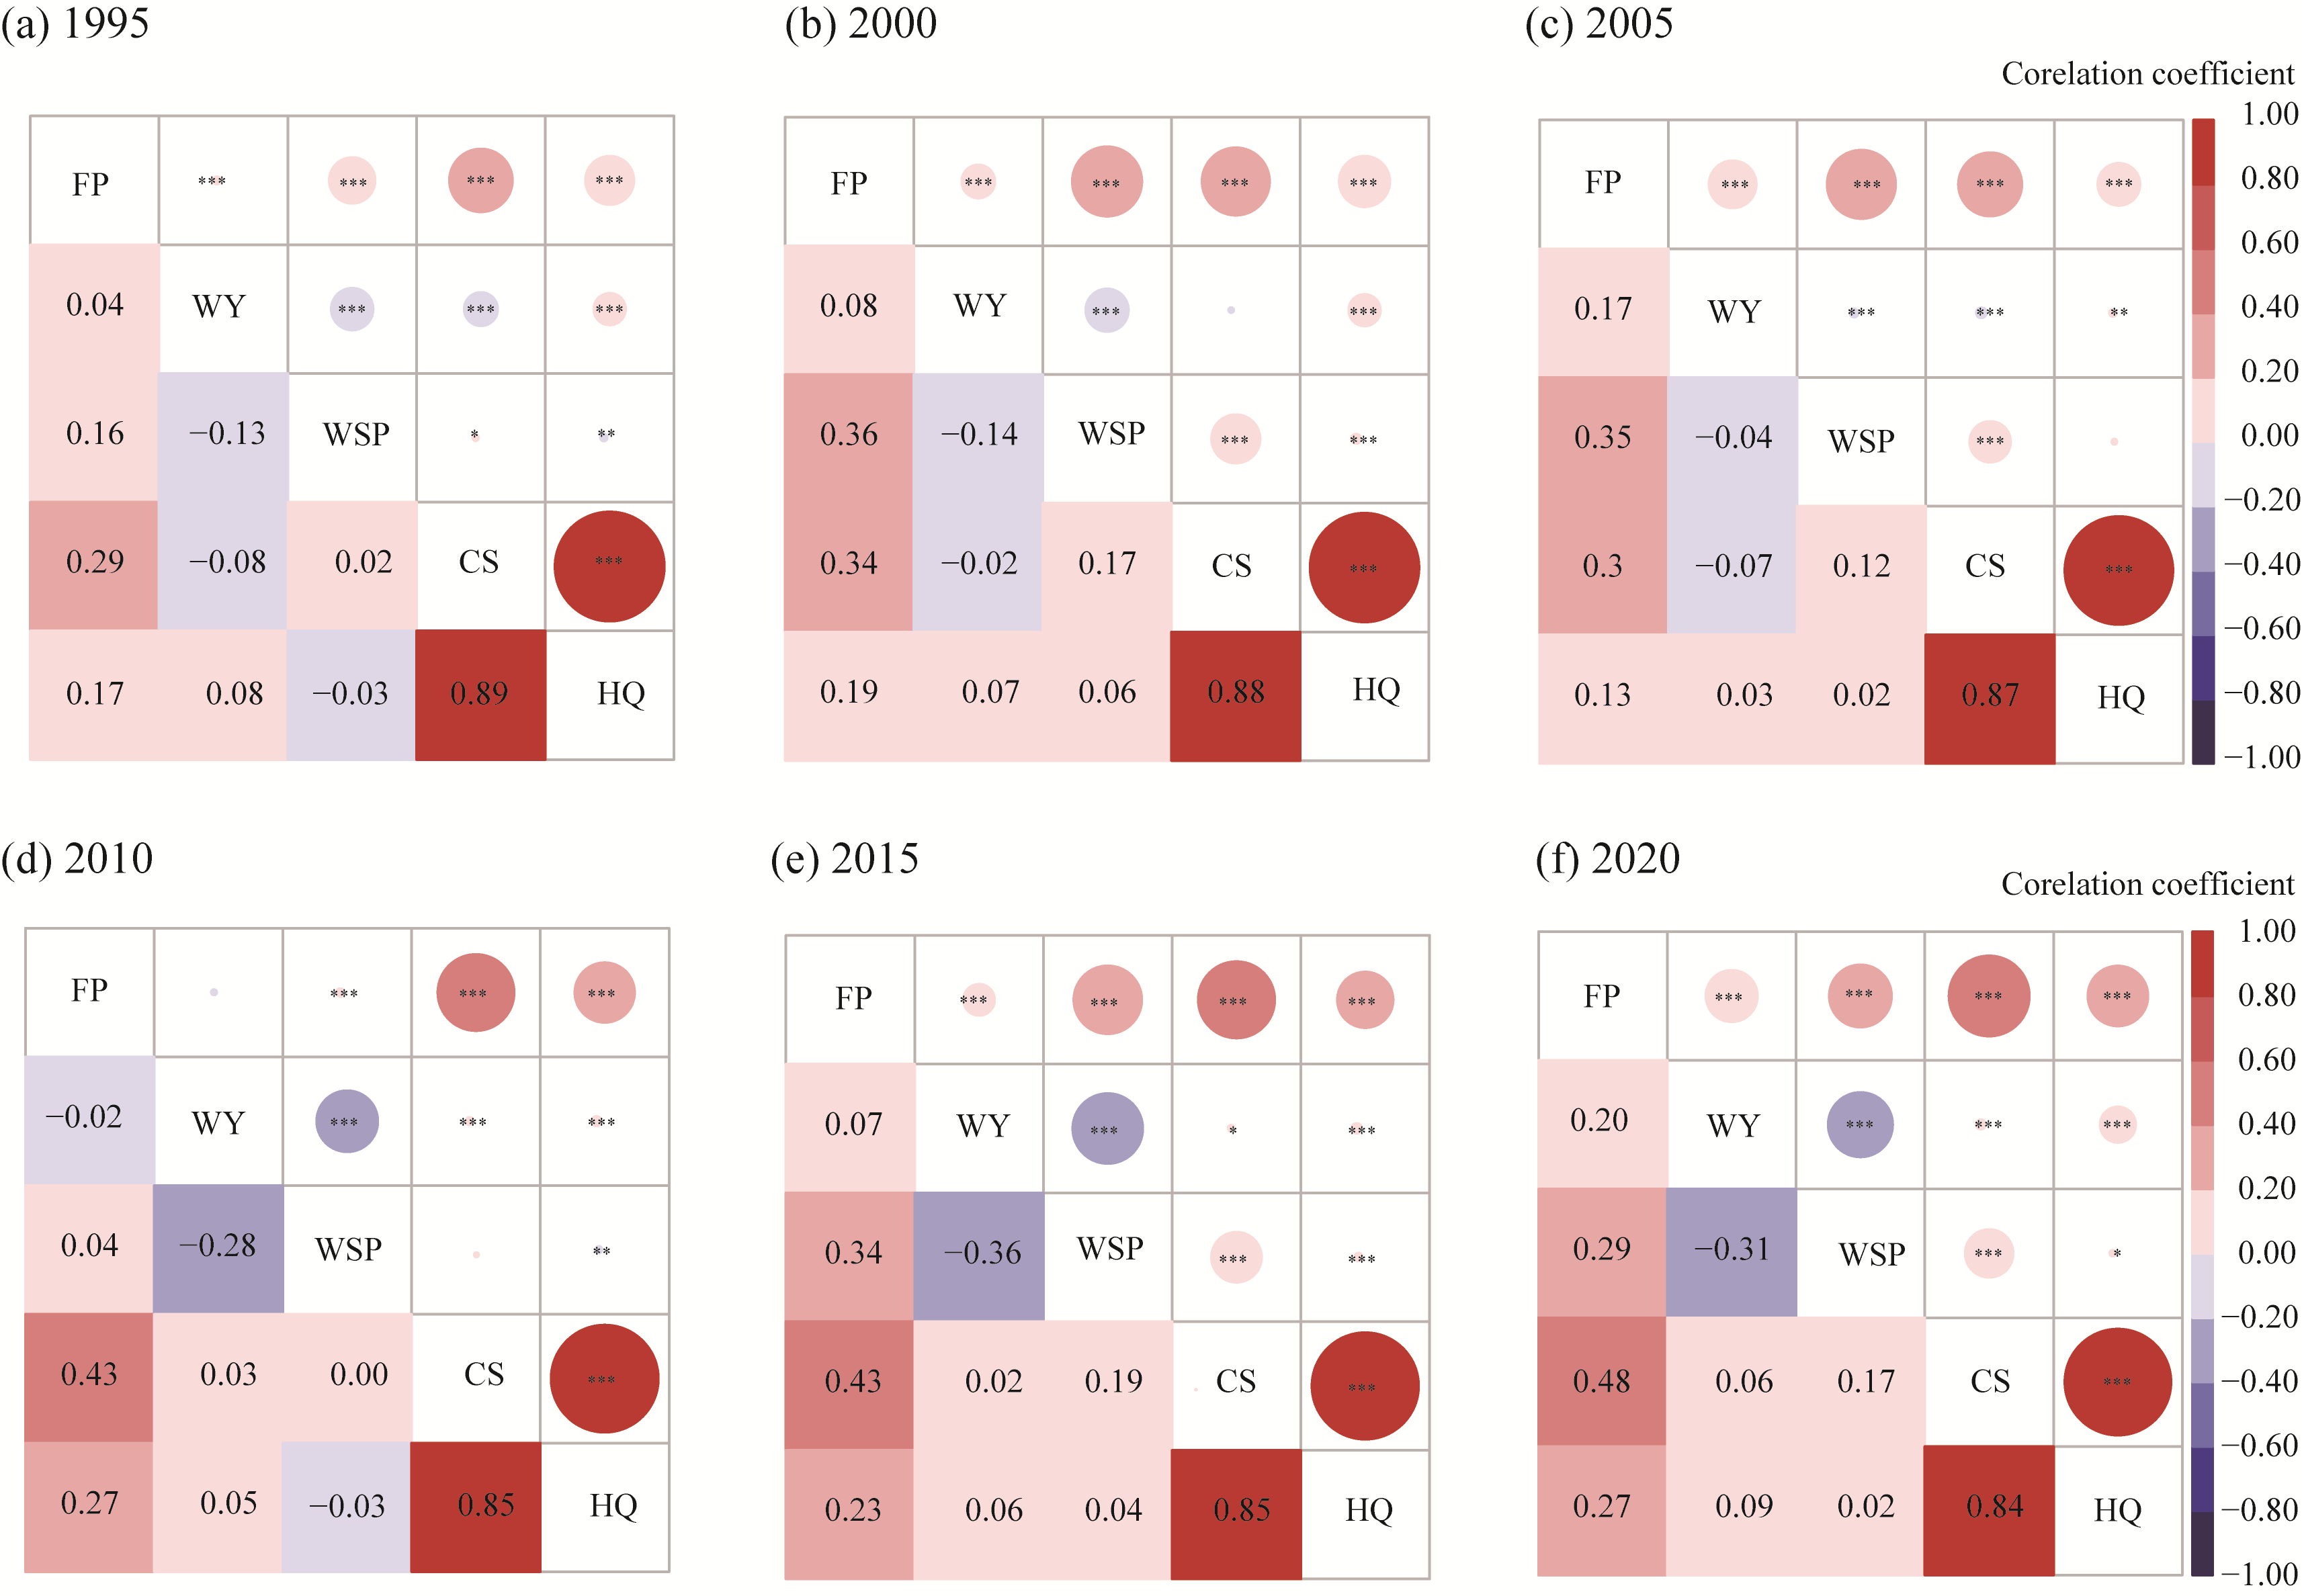
Abstract The Keriya River Basin is located in an extremely arid climate zone on the southern edge of the Tarim Basin of Northwest China, exhibiting typical mountain-oasis-desert distribution characteristics. In recent decades, climate change and human activities have exerted significant impacts on the service functions of watershed ecosystems. However, the trade-offs and synergies between ecosystem services (ESs) have not been thoroughly examined. This study aims to reveal the spatiotemporal changes in ESs within the Keriya River Basin from 1995 to 2020 as well as the trade-offs and synergies between ESs. Leveraging the Integrated Valuation of Ecosystem Services and Trade-offs (InVEST) and Revised Wind Erosion Equation (RWEQ) using land use/land cover (LULC), climate, vegetation, soil, and hydrological data, we quantified the spatiotemporal changes in the five principal ESs (carbon storage, water yield, food production, wind and sand prevention, and habitat quality) of the watershed from 1995 to 2020. Spearman correlation coefficients were used to analyze the trade-offs and synergies between ES pairs. The findings reveal that water yield, carbon storage, and habitat quality exhibited relatively high levels in the upstream, while food production and wind and sand prevention dominated the midstream and downstream, respectively. Furthermore, carbon storage, food production, wind and sand prevention, and habitat quality demonstrated an increase at the watershed scale while water yield exhibited a decline from 1995 to 2020. Specifically, carbon storage, wind and sand prevention, and habitat quality presented an upward trend in the upstream but downward trend in the midstream and downstream. Food production in the midstream showed a continuously increasing trend during the study period. Trade-off relationships were identified between water yield and wind and sand prevention, water yield and carbon storage, food production and water yield, and habitat quality and wind and sand prevention. Prominent temporal and spatial synergistic relationships were observed between different ESs, notably between carbon storage and habitat quality, carbon storage and food production, food production and wind and sand prevention, and food production and habitat quality. Water resources emerged as a decisive factor for the sustainable development of the basin, thus highlighting the intricate trade-offs and synergies between water yield and the other four services, particularly the relationship with food production, which warrants further attention. This research is of great significance for the protection and sustainable development of river basins in arid areas.
|
|
Received: 30 January 2024
Published: 31 July 2024
|
|
Corresponding Authors:
* ZUBAIDA Muyibul (E-mail: zubayda51@163.com)
|
|
|
| [1] |
Bennett E M, Balvanera P. 2007. The future of production systems in a globalized world. Frontiers in Ecology and the Environment, 5(4): 191-198.
|
|
|
| [2] |
Bennett E M, Peterson G B, Gordon L J. 2009. Understanding relationships among multiple ecosystem services. Ecology Letters, 12(12): 1394-1404.
doi: 10.1111/j.1461-0248.2009.01387.x
pmid: 19845725
|
|
|
| [3] |
Butler J R, Wong G Y, Metcalfe D J, et al. 2013. An analysis of trade-offs between multiple ecosystem services and stakeholders linked to land use and water quality management in the Great Barrier Reef, Australia. Agriculture, Ecosystems & Environment, 180: 176-191.
|
|
|
| [4] |
Chen B M, Jing X, Liu S S, et al. 2022a. Intermediate human activities maximize dryland ecosystem services in the long-term land-use change: Evidence from the Sangong River watershed, northwest China. Journal of Environmental Management, 319: 115708, doi: 10.1016/j.jenvman.2022.115708.
|
|
|
| [5] |
Chen H, Fleskens L, Schild J, et al. 2022b. Impacts of large-scale landscape restoration on spatiotemporal dynamics of ecosystem services in the Chinese Loess Plateau. Landscape Ecology, 37: 329-346.
|
|
|
| [6] |
Crawford S L. 2006. Correlation and regression. Circulation, 114 (19): 2083-2088.
pmid: 17088476
|
|
|
| [7] |
Cui F Q, Tang H P, Zhang Q, et al. 2019. Integrating ecosystem services supply and demand into optimized management at different scales: A case study in Hulunbuir, China. Ecosystem Services, 39: 100984, doi: 10.1016/j.ecoser.2019.100984.
|
|
|
| [8] |
Du H Q, Liu X F, Jia X P, et al. 2022. Assessment of the effects of ecological restoration projects on soil wind erosion in northern China in the past two decades. Catena, 215: 106360, doi: 10.1016/j.catena.2022.106360.
|
|
|
| [9] |
Du K X, Zhang F P, Feng Q. et al. 2023. Topographic gradient effect and ecological zoning of ecosystem services in Heihe River Basin. Journal of Desert Research, 43(2): 139-149. (in Chinese)
doi: 10.7522/j.issn.1000-694X.2022.00102
|
|
|
| [10] |
Gong J, Xie Y C, Cao E J, et al. 2019. Integration of InVEST-habitat quality model with landscape pattern indexes to assess mountain plant biodiversity change: A case study of Bailongjiang watershed in Gansu Province. Journal of Geographical Sciences, 29(7): 1193-1210. (in Chinese)
doi: 10.1007/s11442-019-1653-7
|
|
|
| [11] |
Guo L J. 2021. The study on trade-offs of ecosystem services in Kashgar region, Xinjiang base on land use. MSc Thesis. Shihezi: Shihezi University. (in Chinese)
|
|
|
| [12] |
Han M, Xu C C, Long Y X, et al. 2022. Simulation and prediction of changes in carbon storage and carbon source/sink under different land use scenarios in arid region of Northwest China. Bulletin of Soil and Water Conservation, 42(3): 335-344. (in Chinese)
|
|
|
| [13] |
Hou Y F, Chen Y N, Ding J L, et al. 2022. Ecological impacts of land use change in the arid Tarim River Basin of China. Remote Sensing, 14(8): 1894, doi: 10.3390/rs14081894.
|
|
|
| [14] |
Hu F, Zhang Y, Guo Y, et al. 2022. Spatial and temporal changes in land use and habitat quality in the Weihe River Basin based on the PLUS and InVEST models and predictions. Arid Land Geography, 45(4): 1125-1136. (in Chinese)
|
|
|
| [15] |
Ito A, Nishina K, Noda H M. 2016. Impacts of future climate change on the carbon budget of northern high-latitude terrestrial ecosystems: an analysis using ISI-MIP data. Polar Science, 10(3): 346-355.
|
|
|
| [16] |
Joshi J R. 2021. Quantifying the impact of cropland wind erosion on air quality: A high-resolution modeling case study of an Arizona dust storm. Atmospheric Environment, 263: 118658, doi: 10.1016/j.atmosenv.2021.118658.
|
|
|
| [17] |
Kulaixi Z, Chen Y N, Wang C, et al. 2023. Spatial differentiation of ecosystem service value in an arid region: A case study of the Tarim River Basin, Xinjiang. Ecological Indicators, 151: 110249, doi: 10.1016/j.ecolind.2023.110249.
|
|
|
| [18] |
Kuri F, Murwira A, Murwira K S, et al. 2014. Predicting maize yield in Zimbabwe using dry dekads derived from remotely sensed Vegetation Condition Index. International Journal of Applied Earth Observation & Geoinformation, 33: 39-46.
|
|
|
| [19] |
Li J H, Bai Y, Alatalo J M. 2020. Impacts of rural tourism-driven land use change on ecosystems services provision in Erhai Lake Basin, China. Ecosystem Services, 42: 101081, doi: 10.1016/j.ecoser.2020.101081.
|
|
|
| [20] |
Li J X, Yuan X L, Su Y, et al. 2023. Trade-offs and synergistic relationships in wind erosion in Central Asia over the last 40 years: A Bayesian Network analysis. Geoderma, 437: 116597, doi: 10.1016/j.geoderma.2023.116597.
|
|
|
| [21] |
Li Y, Luo H F. 2023. Trade-off/synergistic changes in ecosystem services and geographical detection of its driving factors in typical karst areas in southern China. Ecological Indicators, 154: 110811, doi: 10.1016/j.ecolind.2023.110811.
|
|
|
| [22] |
Li Z H, Deng X Z, Jin G, et al. 2020. Tradeoffs between agricultural production and ecosystem services: A case study in Zhangye, Northwest China. Science of the Total Environment, 707: 136032, doi: 10.1016/j.scitotenv.2019.136032.
|
|
|
| [23] |
Li Z H, Xia J, Deng X Z, et al. 2021. Multilevel modelling of impacts of human and natural factors on ecosystem services change in an oasis, Northwest China. Resources, Conservation and Recycling, 169: 105474, doi: 10.1016/j.resconrec.2021.105474.
|
|
|
| [24] |
Ling H B, Yan J J, Xu H L, et al. 2019. Estimates of shifts in ecosystem service values due to changes in key factors in the Manas River basin, northwest China. Science of the Total Environment, 659: 177-187.
|
|
|
| [25] |
Liu F T, Xu E Q. 2020. Comparison of spatial-temporal evolution of habitat quality between Xinjiang crops and non-crops region based on land use. Chinese Journal of Applied Ecology, 31(7): 2341-2351. (in Chinese)
|
|
|
| [26] |
Liu J M, Pei X T, Zhu W Y, et al. 2023. Scenario modeling of ecosystem service trade-offs and bundles in a semi-arid valley basin. Science of the Total Environment, 896: 166413, doi: 10.1016/j.scitotenv.2023.166413.
|
|
|
| [27] |
Liu L M, Wang T T, Li X F, et al. 2021a. Spatiotemporal variations of wind prevention and sand fixation function in the sand-prevention belt in Inner Mongolia in recent 15 years. Chinese Journal of Ecology, 40(11): 3436-3447. (in Chinese)
|
|
|
| [28] |
Liu Y, Zhang J, Zhou D M, et al. 2021b. Temporal and spatial variation of carbon storage in the Shule River Basin based on InVEST model. Acta Ecologica Sinica, 41(10): 4052-4065. (in Chinese)
|
|
|
| [29] |
Maimaiti B, Chen S S, Kasimu A, et al. 2021. Urban spatial expansion and its impacts on ecosystem service value of typical oasis cities around Tarim Basin, northwest China. International Journal of Earth Observations and Geoinformation, 104: 102554, doi: 10.1016/j.jag.2021.102554.
|
|
|
| [30] |
Muhtar P, Xia J X, Muyibul Z, et al. 2021. Evaluating the evolution of oasis water metabolism using ecological network analysis: A synthesis of structural and functional properties. Journal of Cleaner Production, 280: 124422, doi: 10.1016/j.jclepro.2020.124422.
|
|
|
| [31] |
Nagendra H, Mairota P, Marangi C, et al. 2015. Satellite Earth observation data to identify anthropogenic pressures in selected protected areas. International Journal of Applied Earth Observation and Geoinformation, 37: 124-132.
|
|
|
| [32] |
Ni P R. 1993. Hisdery, present situation and evolution prospect of Daliyaboyi Oasis. Arid Zone Research, 4: 12-18. (in Chinese)
|
|
|
| [33] |
Pan N H, Guan Q Y, Wang Q Z, et al. 2021. Spatial differentiation and driving mechanisms in ecosystem service value of arid region: A case study in the middle and lower reaches of Shule River Basin, NW China. Journal of Cleaner Production, 319: 128718, doi: 10.1016/j.jclepro.2021.128718.
|
|
|
| [34] |
Pellowe K E, Meacham M, Peterson G D, et al. 2023. Global analysis of reef ecosystem services reveals synergies, trade-offs and bundles. Ecosystem Services, 63: 101545, doi: 10.1016/j.ecoser.2023.101545.
|
|
|
| [35] |
Peng S Z, Ding Y X, Wen Z M, et al. 2017. Spatiotemporal change and trend analysis of potential evapotranspiration over the Loess Plateau of China during 2011-2100. Agricultural and Forest Meteorology, 233: 183-194.
|
|
|
| [36] |
Power A G. 2010. Ecosystem services and agriculture: tradeoffs and synergies. Philosophical Transactions of the Royal Society B-Biological Sciences, 365(1554): 2959-2971.
doi: 10.1098/rstb.2010.0143
pmid: 20713396
|
|
|
| [37] |
Qian C, Gong J, Zhang J. et al. 2018. Change and tradeoffs-synergies analysis on watershed ecosystem services: A case study of Bailongjiang Watershed, Gansu. Acta Geographica Sinica, 753(5): 868-879. (in Chinese)
|
|
|
| [38] |
Raudsepp H C, Peterson G D, Bennett E M. 2010. Ecosystem service bundles for analyzing tradeoffs in diverse landscapes. Proceedings of National Academy of Sciences of the United States of America, 107(11): 5242-5247.
|
|
|
| [39] |
Sanon S, Hein T, Douven W, et al. 2012. Quantifying ecosystem service trade-offs: The case of an urban floodplain in Vienna, Austria. Journal of Environmental Management, 111: 159-172.
doi: 10.1016/j.jenvman.2012.06.008
pmid: 22892145
|
|
|
| [40] |
Sharp R, Tallis H T, Ricketts T, et al. 2014. InVEST 3.2.0 User's Guide. San Francisco: The Natural Capital Project, Stanford University, University of Minnesota, The nature Conservancy, World Wildlife Fund, 25-144.
|
|
|
| [41] |
Tengberg A, Radstake F, Zhang K B, et al. 2016. Scaling up of sustainable land management in the Western People's Republic of China: Evaluation of a 10-year partnership. Land Degradation & Development, 27(2): 134-144.
|
|
|
| [42] |
Terrado M, Sabater S, Chaplin-Kramer B, et al. 2016. Model development for the assessment of terrestrial and aquatic habitat quality in conservation planning. Science of the Total Environment, 540: 63-70.
|
|
|
| [43] |
Wang B, Li X, Ma C F, et al. 2022a. Uncertainty analysis of ecosystem services and implications for environmental management-An experiment in the Heihe River Basin, China. Science of the Total Environment, 821: 153481, doi: 10.1016/j.scitotenv.2022.153481.
|
|
|
| [44] |
Wang C, Liu C F, Wu Y H et al. 2019. Spatial pattern, tradeoffs and synergies of ecosystem services in loess hilly region: A case study in Yuzhong County. Chinese Journal of Ecology, 38(2): 521-531. (in Chinese)
|
|
|
| [45] |
Wang J H, Zhang F, Luo G M, et al. 2022b. Influence of natural and anthropogenic controls on runoff in the Keriya River, central Tarim Basin, China. PLoS ONE, 17(5): e0269132, doi: 10.1371/journal.pone.0269132.
|
|
|
| [46] |
Wang Y C, Zhao J, Fu J W, et al. 2019. Effects of the Grain for Green Program on the water ecosystem services in an arid area of China-Using the Shiyang River Basin as an example. Ecological Indicators, 104: 659-668.
|
|
|
| [47] |
Wasige J E, Groen T A, Rwamukwaya B N, et al. 2014. Contemporary land use/land cover types determine soil organic carbon stocks in south-west Rwanda. Nutrient Cycling in Agroecosystems, 100(1): 1-15.
|
|
|
| [48] |
Wei P J, Wu M H, Jia Y L, et al. 2022. Spatiotemporal variation of water yield in the upstream regions of the Shule River Basin using the InVEST model. Acta Ecologia Sinica, 42(15): 6418-6429. (in Chinese)
|
|
|
| [49] |
Wu H, Xu M, Peng Z Y, et al. 2022. Quantifying the potential impacts of meltwater on cotton yields in the Tarim River Basin, Central Asia. Agricultural Water Management, 269: 107639, doi: 10.1016/j.agwat.2022.107639.
|
|
|
| [50] |
Xu Z H, Wei H J, Fan W Q, et al. 2019. Relationships between ecosystem services and human well-being changes based on carbon flow-A case study of the Manas River Basin, Xinjiang, China. Ecosystem Services, 37: 100934, doi: 10.1016/j.ecoser.2019.100934.
|
|
|
| [51] |
Xu Z W, Zhang Z J. 2018. Spatiotemporal variation of carbon storage in Yuli County during 2010-2016. Research of Environmental Sciences, 31(11): 1909-1917. (in Chinese)
|
|
|
| [52] |
Yue D X, Zhou Y Y, Guo J J, et al. 2022. Ecosystem service evaluation and optimisation in the Shule River Basin, China. Catena, 215: 106320, doi: 10.1016/j.catena.2022.106320.
|
|
|
| [53] |
Zhang F, Wang J, Ma L, et al. 2023. OSL chronology reveals Late Pleistocene floods and their impact on landform evolution in the lower reaches of the Keriya River in the Taklimakan Desert. Journal of Geographical Sciences, 33(5): 945-960.
doi: 10.1007/s11442-023-2114-x
|
|
|
| [54] |
Zhao J, Shao Z, Xia C Y, et al. 2022. Ecosystem services assessment based on land use simulation: A case study in the Heihe River Basin, China. Ecological Indicators, 143: 109402, doi: 10.1016/j.ecolind.2022.109402.
|
|
|
| [55] |
Zhao W Y, Wu S Y, Chen X, et al. 2023. How would ecological restoration affect multiple ecosystem service supplies and tradeoffs? A study of mine tailings restoration in China. Ecological Indicators, 153: 110451, doi: 10.1016/j.ecolind.2023.110451.
|
|
|
| [56] |
Zheng Z M, Fu B J, Hu H T, et al. 2014. A method to identify the variable ecosystem services relationship across time: A case study on Yanhe Basin, China. Landscape Ecology, 29: 1689-1696.
|
|
|
| [57] |
Zhou J J, Zhao Y R, Huang P, et al. 2020. Impacts of ecological restoration projects on the ecosystem carbon storage of inland river basin in arid area, China. Ecological Indicators, 118: 106803, doi: 10.1016/j.ecolind.2020.106803.
|
|
|
| [58] |
Zhu G F, Qiu D D, Zhang Z X, et al. 2021. Land-use changes lead to a decrease in carbon storage in arid region, China. Ecological Indicators, 127: 107770, doi: 10.1016/j.ecolind.2021.107770.
|
|
|
| [59] |
Zhu H S, Zhai J, Hou P, et al. 2022. The protection characteristics of key ecological functional zones from the perspective of ecosystem service trade-off and synergy. Acta Geographica Sinica, 77(5): 1275-1288. (in Chinese)
doi: 10.11821/dlxb202205016
|
|
|
| [60] |
Zhu P, Liu X, Zheng Y H, et al. 2020. Tradeoffs and synergies of ecosystem services in key ecological function zones in northern China. Acta Ecologica Sinica, 40(23): 8694-8706. (in Chinese)
|
|
|
| [61] |
Zou X Y, Li J F, Cheng H, et al. 2018. Spatial variation of topsoil features in soil wind erosion areas of northern China. Catena, 167: 429-439.
|
|
|
| [62] |
Zubaida M, Xia J X, Polat M, et al. 2018. Spatiotemporal changes of land use/cover from 1995 to 2015 in an oasis in the middle reaches of the Keriya River, southern Tarim Basin, Northwest China. Catena, 171: 416-425.
|
|
|
|
Viewed |
|
|
|
Full text
|
|
|
|
|
Abstract
|
|
|
|
|
Cited |
|
|
|
|
| |
Shared |
|
|
|
|
| |
Discussed |
|
|
|
|