Response of soil microarthropod communities to long-term water and nitrogen changes in desert steppes, China
MA Shangfei1, LI Jing2, WU Zhendan1, YE He1, WEN Xin3, HONG Mei1,4,5,*()
1College of Resources and Environment Sciences, Inner Mongolia Agricultural University, Hohhot 010018, China 2Inner Mongolia Agriculture and Animal Husbandry Technology Popularization Center, Hohhot 010018, China 3Agricultural and Livestock Ecology and Resource Protection Center of Otog Front Banner, Erdos 016299, China 4Inner Mongolia Key Laboratory of Soil Quality and Nutrient Resources, Hohhot 010018, China 5Key Laboratory of Agricultural Ecological Security and Green Development at Universities of Inner Mongolia Autonomous Region, Hohhot 010018, China
Desert steppe ecosystems are highly sensitive to variations in water and nitrogen (N) levels. Soil microarthropods serve as crucial indicators of belowground ecological processes, yet their responses to long-term water-N interactions remain unclear. This study investigated the combined effects of long-term N deposition and rainfall variation on the microarthropod community in the desert steppe soil, as well as their potential driving mechanisms. Utilizing a field control experimental platform for global change in the desert steppe of Inner Mongolia Autonomous Region, China, researchers had established a multigradient two-factor (water-N) experiment since 2015. The experiment employed a split-plot design with three water levels (natural rainfall (NR), 30.00% rainfall enhancement (RE), and 30.00% rainfall reduction (RR)) and four N addition levels (0 (N0), 30 (N30), 50 (N50), and 100 (N100) kg N/(hm2•a)), resulting in 12 treatment combinations. After the experimental treatments had been conducted for 5 a and treatment effects had reached a long-term steady state, we collected the soil samples to analyze the variations of soil microarthropod communities. The results revealed that at varying water conditions, N addition increased the abundance, number of taxa, and diversity of soil microarthropods. In the RE treatment, the total abundance and total number of taxa of soil microarthropods were significantly greater than those in the NR and RR treatments. Water-N interactions had a significant effect on soil microarthropod community structure, with the N30 treatment coupled with water variation having the strongest effect. Moreover, the influence of N addition on soil microarthropod communities depended on water changes; both the RR and RE treatments amplified the effect of N addition, with the RR treatment resulting in the greatest amplification. N deposition and changes in rainfall shape the soil microarthropod community by altering key environmental factors. N addition and water variation positively affect the abundance of soil microarthropods by increasing the ammonium nitrogen (NH4+-N) content, litter fall (LF), and soil moisture (SM) content. The interaction between water and N primarily promotes soil microarthropod abundance by reducing the NH4+-N content and increasing the biomass of perennial grass. In summary, this study not only reveals the key pathways through which water and N drive changes in the soil microarthropod community in desert steppes but also provides a scientific basis for understanding soil biodiversity maintenance and ecosystem management in arid regions under global change.
Received: 20 November 2025
Published: 30 June 2026
Conceptualization: MA Shangfei; Methodology: MA Shangfei, LI Jing, WU Zhendan, YE He, WEN Xin; Formal analysis: MA Shangfei, LI Jing, WU Zhendan; Writing - original draft preparation: MA Shangfei; Writing - review and editing: HONG Mei; Funding acquisition: HONG Mei. All authors approved the manuscript.
MA Shangfei, LI Jing, WU Zhendan, YE He, WEN Xin, HONG Mei. Response of soil microarthropod communities to long-term water and nitrogen changes in desert steppes, China. Journal of Arid Land, 2026, 18(6): 1076-1097.
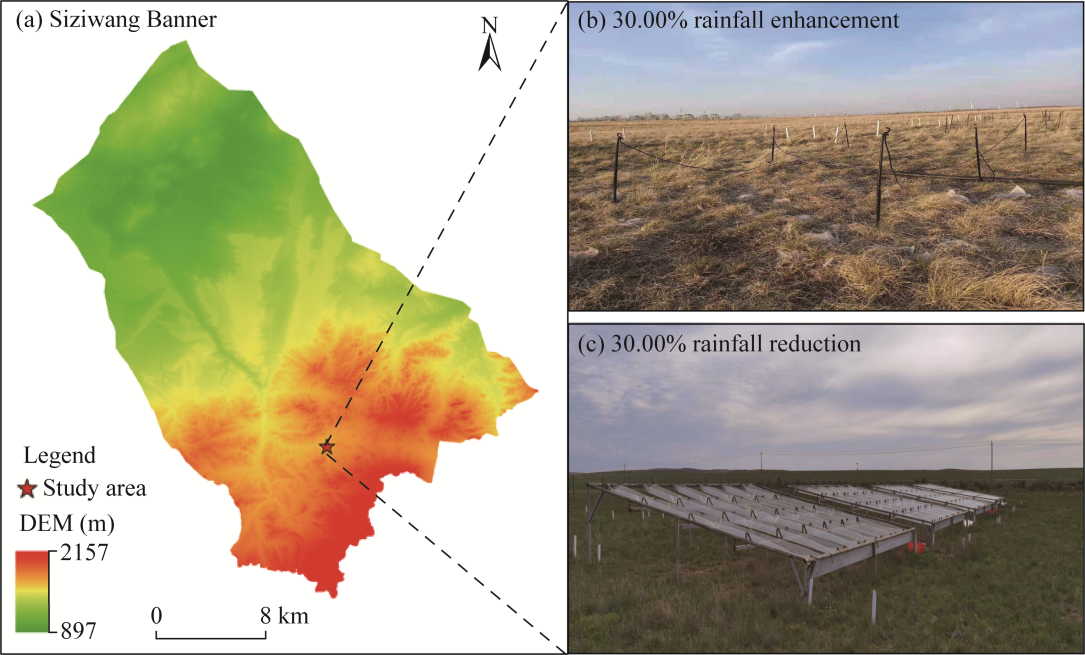
Fig. 1Study area in Siziwang Banner, Ulanqab City, Inner Mongolia Autonomous Region, China (a), and photos of the 30.00% rainfall enhancement (b) and 30.00% rainfall reduction (c) treatments. DEM, digital elevation model.
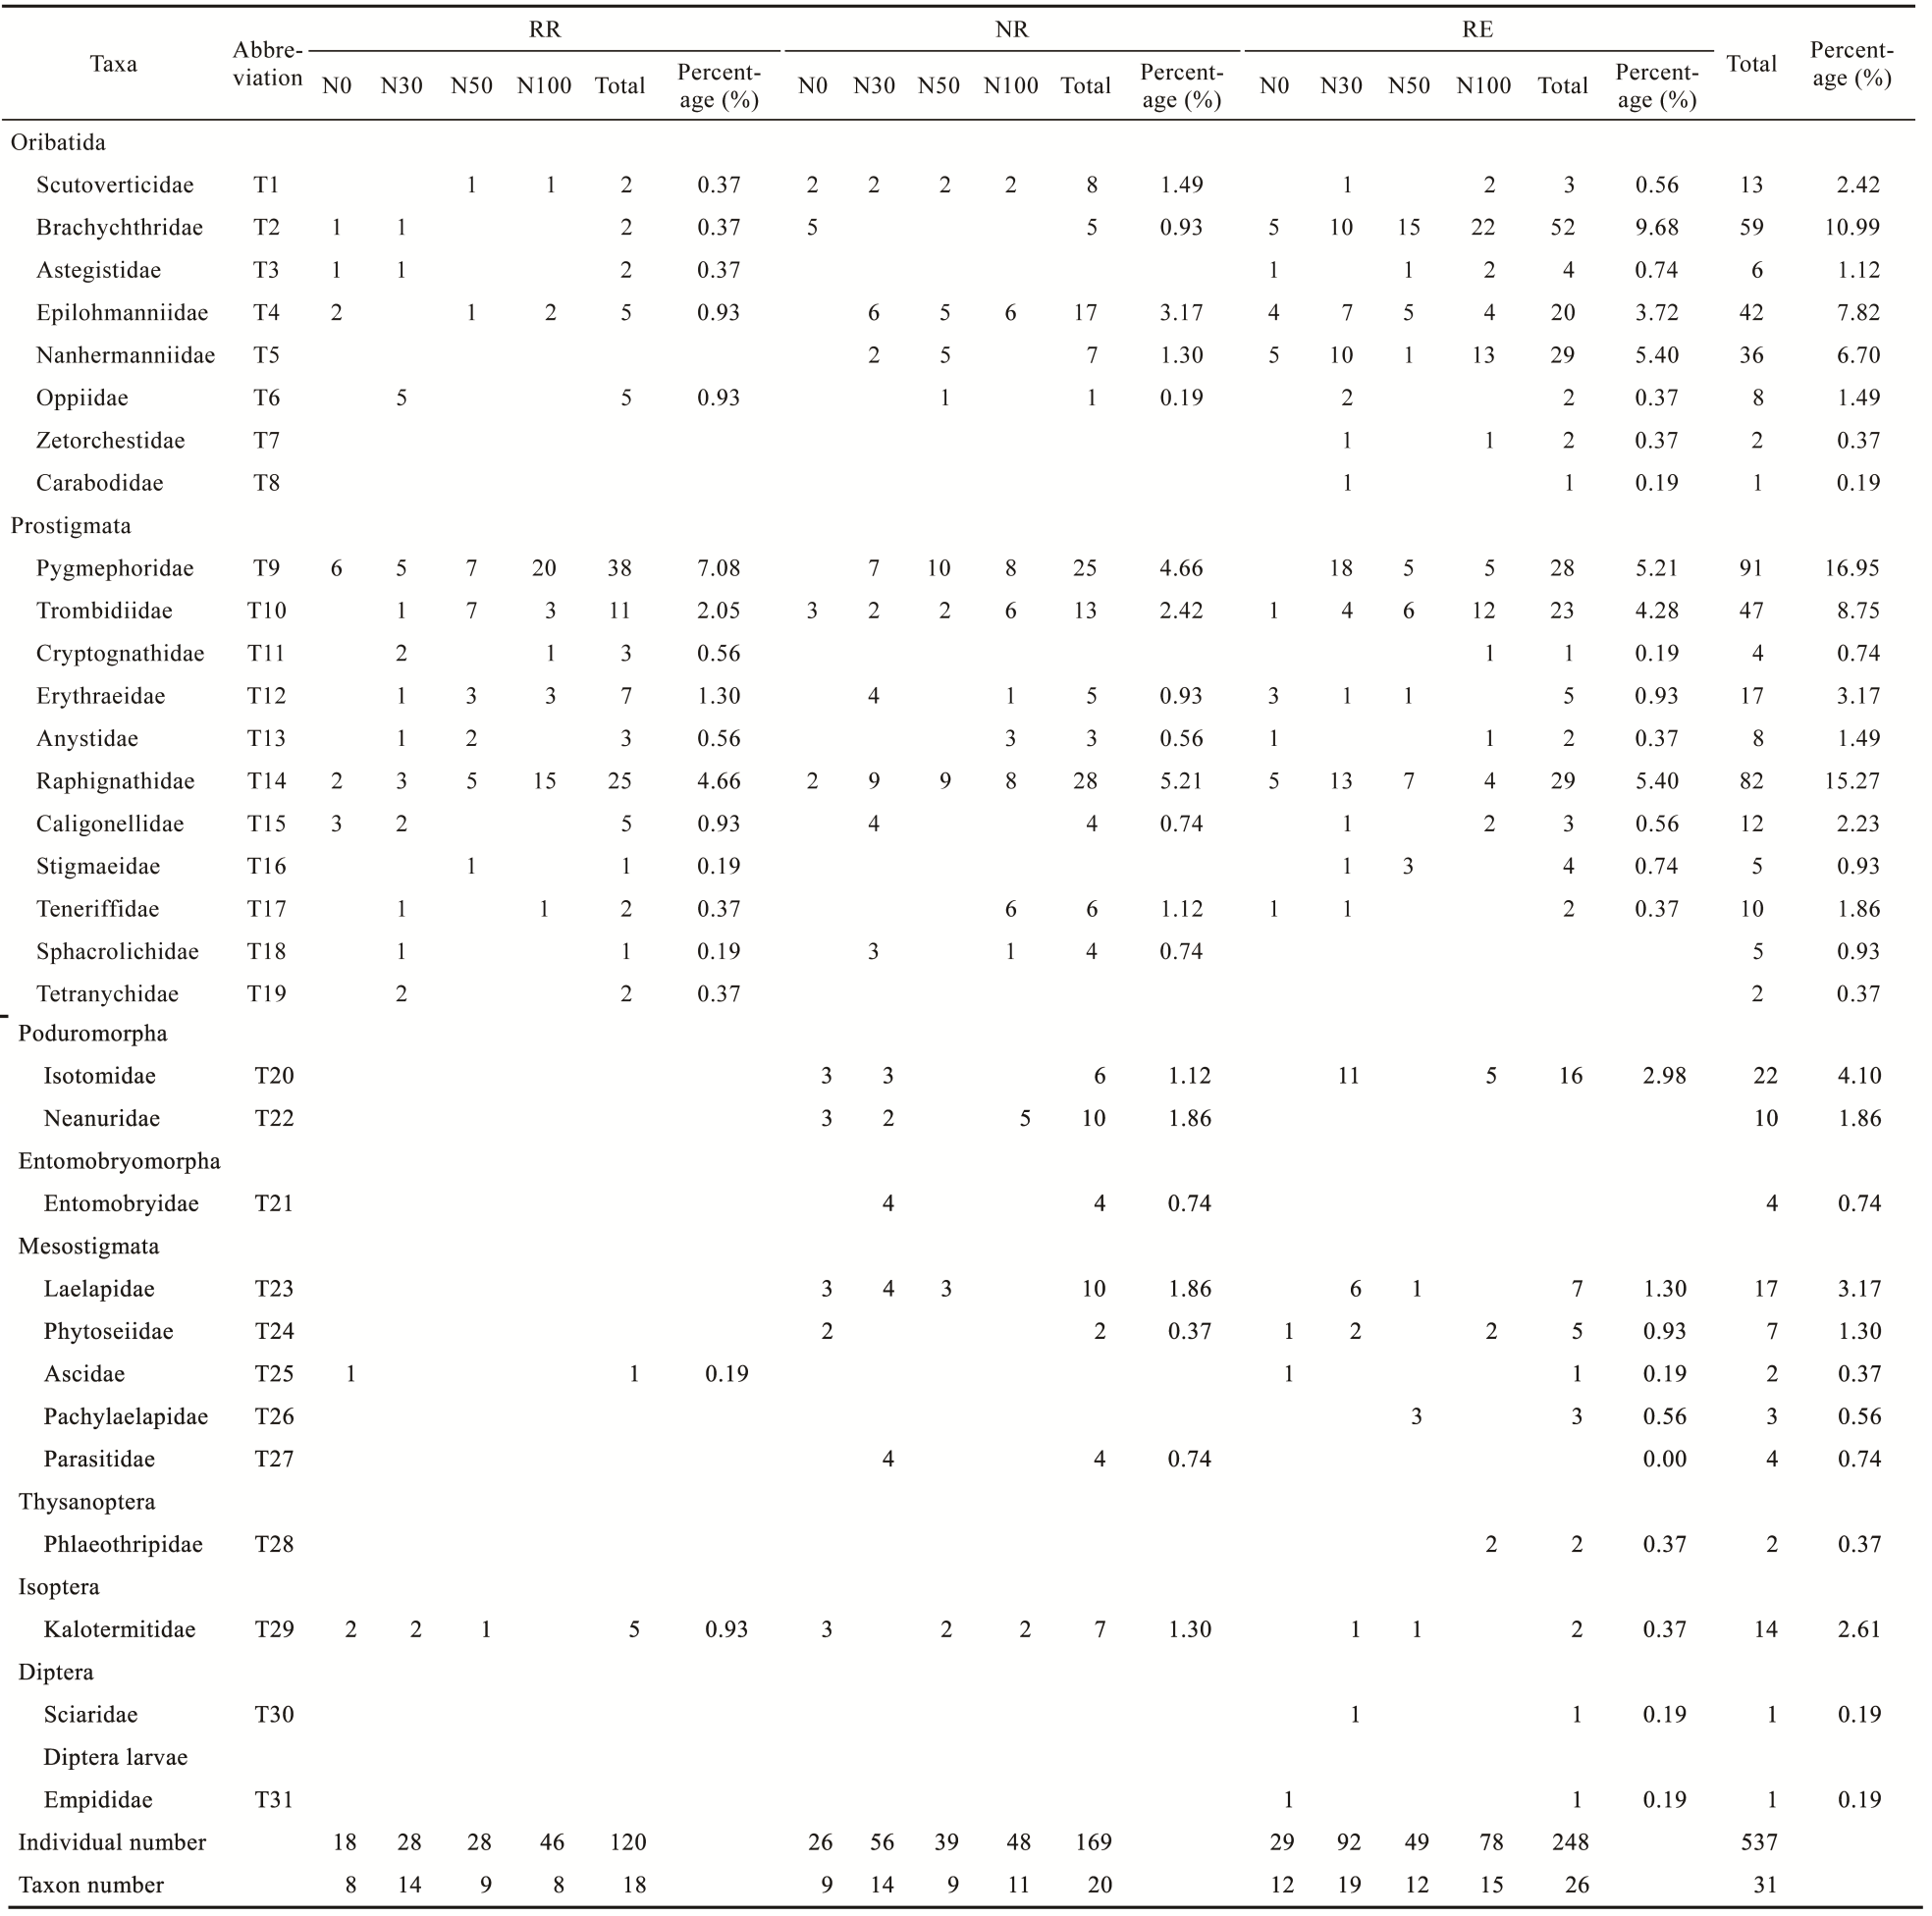
Table S1 Changes in soil microarthropod abundance and ovcupancy underdifferent water-ntrogen (N) interactions in Sipa breviflora Griseb.desert steppe
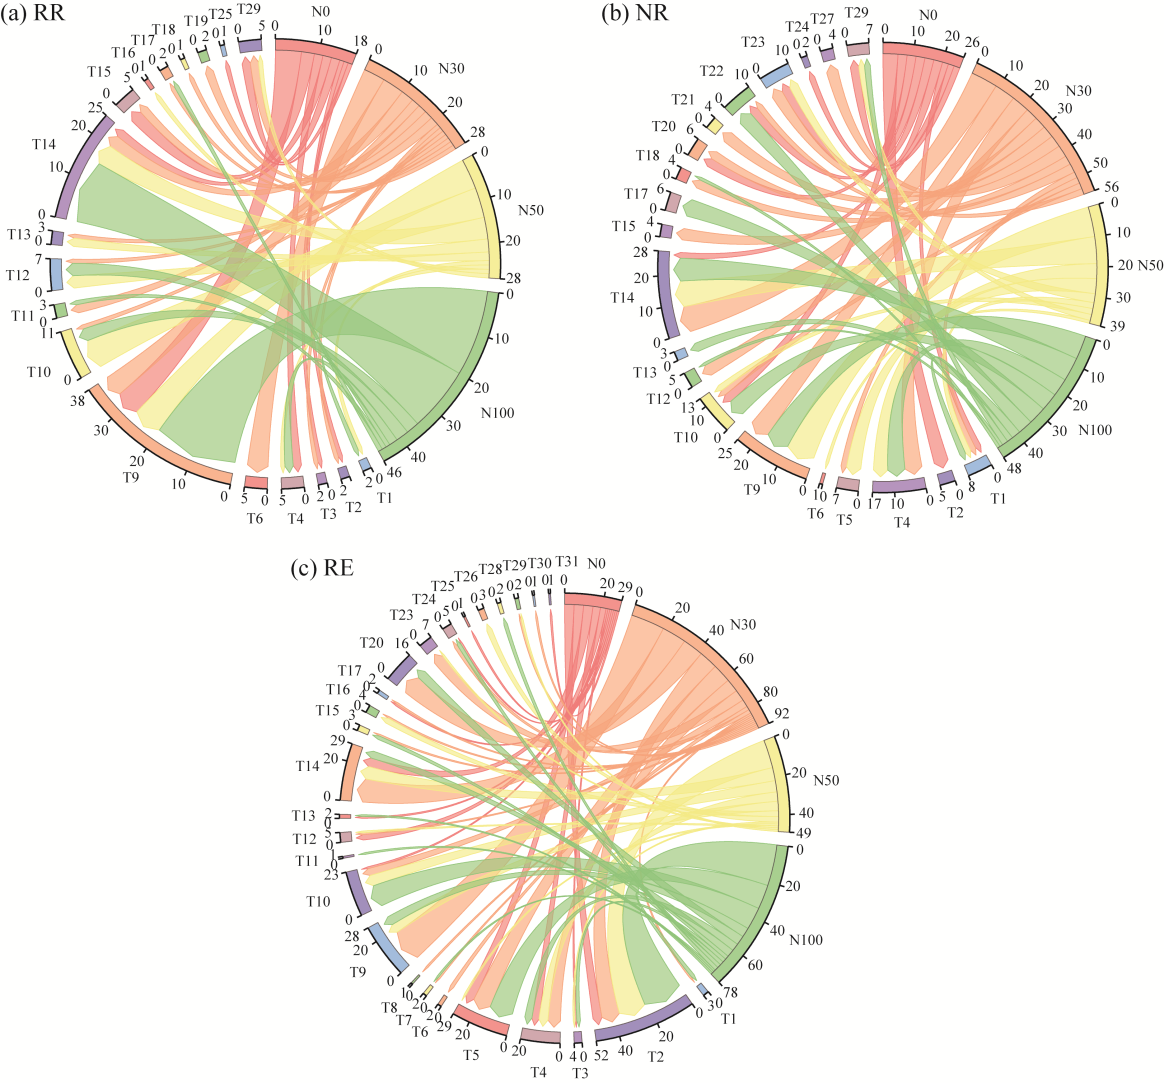
Fig. 2Distribution of soil microarthropod communities under different nitrogen (N) addition treatments at each water level. RR (a), NR (b), and RE (c) represent 30.00% rainfall reduction, natural rainfall, and 30.00% rainfall enhancement, respectively. N0, N30, N50, and N100 denote N application rates of 0, 30, 50, and 100 kg N/(hm2•a), respectively. T1-T31 correspond to soil microarthropod taxa at the family level. The specific taxa corresponding to each code are listed in Table S1.
Factor
Water
N
Water×N
df
F
df
F
df
F
Individual
3
19.79***
4
15.29***
12
2.85*
Taxa number
3
10.80***
4
11.41***
12
0.92
Simpson index
3
4.58*
4
1.94
12
1.42
Shannon-wiener index
3
10.04***
4
9.22***
12
1.25
Margalef index
3
1.51
4
2.21
12
1.46
Pielou index
3
6.12**
4
13.86***
12
1.02
Table S2 Two-way analysis of variance (ANOVA) of soil microarthropod community composition and diversity under different water levels and N addition treatments
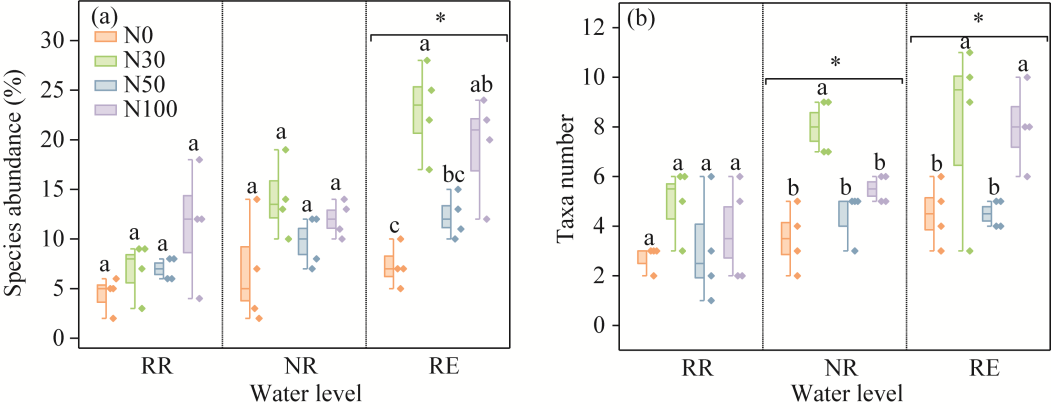
Fig. 3Changes in soil microarthropod community structure under different water levels and N addition treatments. (a), species abundance; (b), taxa number. Different lowercase letters within the same water level indicate significant differences among different N treatments at P<0.050 level. *, P<0.050 level among different water levels. Boxes indicate the IQR (interquartile range, 75th to 25th of the data). The median value is shown as a line within the box. The colored diamonds represent the data. Whiskers extend to the most extreme value within 1.5×IQR.
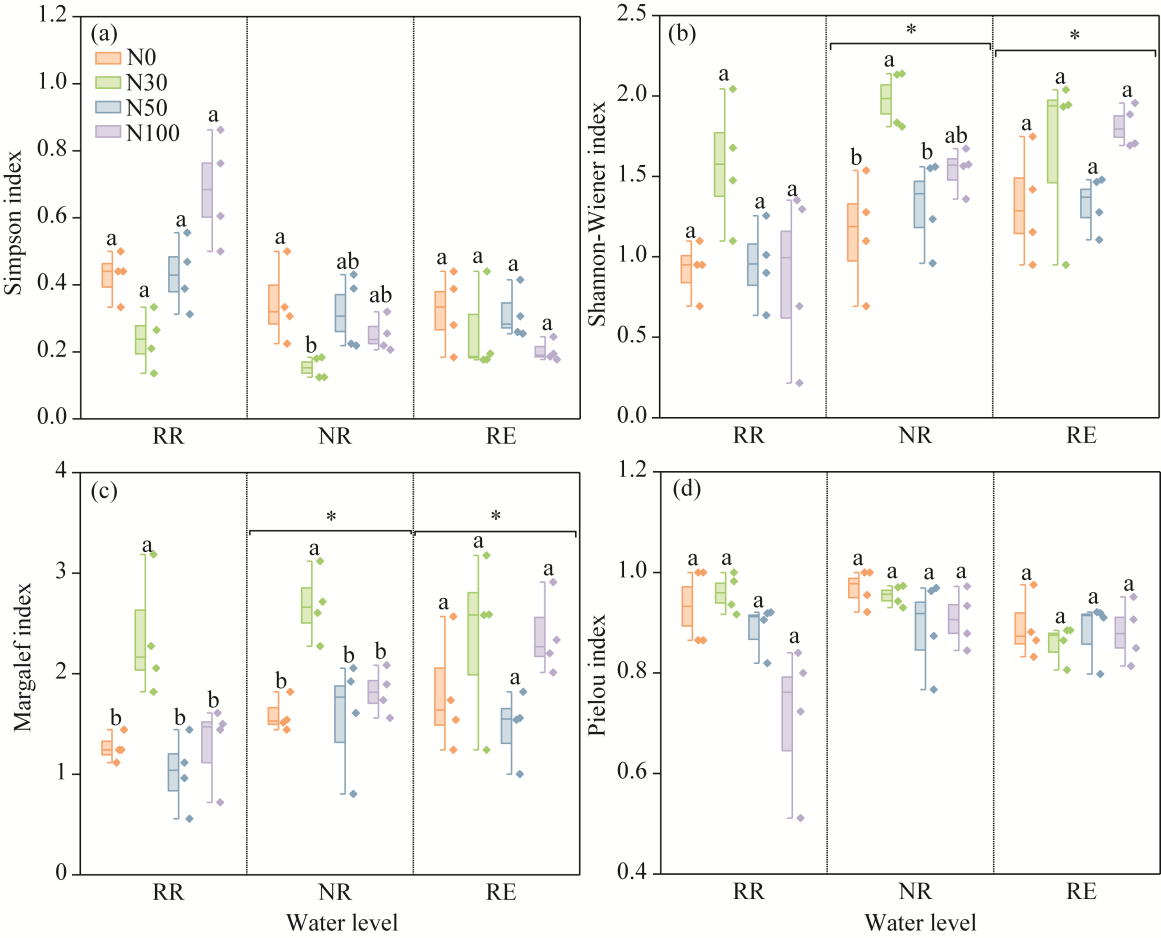
Fig. 4Changes in soil microarthropod diversity in desert steppe under different water levels and N addition treatments. (a), Simpson index; (b), Shannon-Wiener index; (c), Margalef index; (d), Pielou index. Different lowercase letters within the same water level indicate significant differences among different N treatments at P<0.050 level. *, P<0.050 level among different water levels.
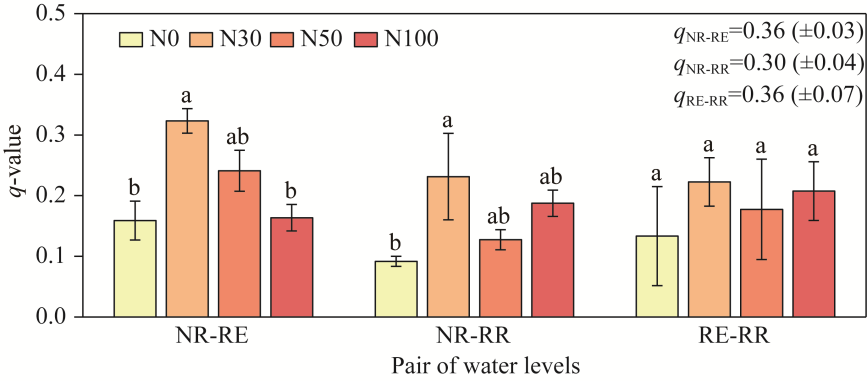
Fig. 5Changes in the similarity coefficient (q-value) of soil microarthropod communities in desert steppes under water-N interactions. The indices qNR-RE, qNR-RR, and qRE-RR compare the soil microarthropods levels between the NR and RE, NR and RR, and RE and RR levels, respectively. Different lowercase letters within the same pair of water levels indicate significant differences among different N treatments at P<0.050 level.
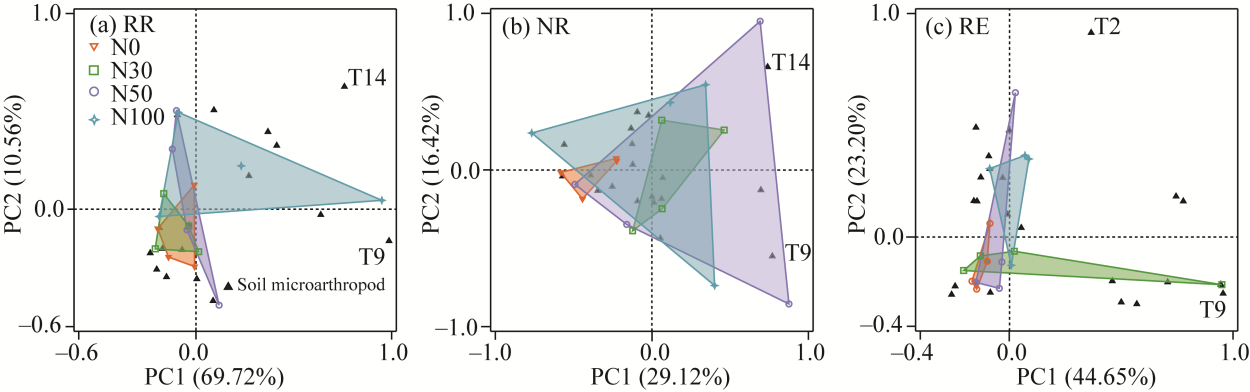
Fig. 6Principal component analysis (PCA) result in soil microarthropod community structure at different water levels. (a), RR; (b), NR; (c), RE. PC, principal component.
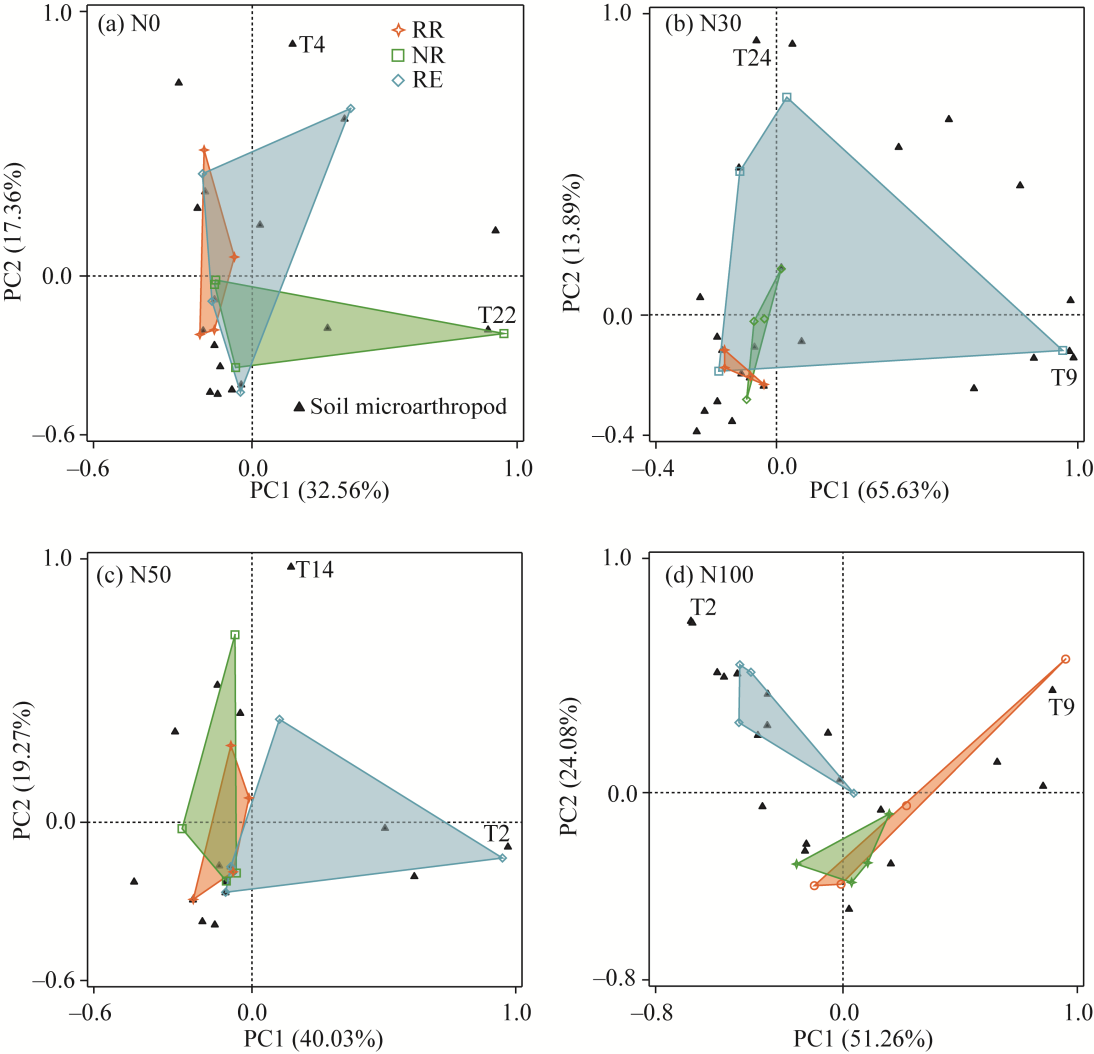
Fig. 7PCA result in soil microarthropod community structure under different N addition treatments. (a), N0; (b), N30; (c), N50; (d), N100.
Factor
Water
N
Water×N
df
F
df
F
df
F
pH
3
41.09***
4
91.10***
12
7.21***
TN
3
0.19
4
0.59
12
0.83
SOM
3
6.49**
4
7.28***
12
1.52
AP
3
26.59***
4
3.79*
12
8.20***
AK
3
3.92*
4
1.86
12
4.81**
NH4+-N
3
11.86***
4
11.56***
12
6.16***
NO3‒-N
3
412.87***
4
288.04***
12
131.93***
SM
3
95.20***
4
0.21
12
0.70
T
3
109.45***
4
0.47
12
1.29
AGB
3
848.44***
4
22.61***
12
7.28***
AB plants
3
335.43***
4
18.49***
12
3.70**
P. weeds
3
56.48***
4
12.35***
12
14.39***
P. grasses
3
63.15***
4
4.43**
12
2.04
LF
3
233.73***
4
1.55
12
5.04**
Richness index
3
6.80**
4
5.02**
12
0.77
Shannon-wiener index
3
17.29***
4
9.13***
12
4.33**
Pielou index
3
7.47**
4
13.54***
12
9.88***
Simpson index
3
4.73*
4
6.49**
12
1.26
Table S3 Two-way ANOVA of soil physical-chemical properties, and plant community structure and diversity under different water levels and N addition treatments
Treatment
pH
TN (g/kg)
SOM (g/kg)
AP (mg/kg)
AK (mg/kg)
NH4+-N (mg/kg)
NO3‒-N (mg/kg)
SM (%)
T (°C)
RR-N0
8.24±0.05a
1.76±0.08a
24.80±0.07b
4.01±0.09b
222.40±11.09b
1.43±0.10b
3.44±0.04d
5.03±0.02a
15.97±0.43a
RR-N30
8.06±0.03b
1.71±0.04a
28.11±0.77a
4.35±0.11a
244.19±4.54ab
1.49±0.07b
7.40±0.27c
4.82±0.01a
15.95±0.39a
RR-N50
8.13±0.02c
1.72±0.13a
28.00±0.39a
3.63±0.07c
257.86±11.50a
1.53±0.18b
20.84±0.76b
4.74±0.01a
15.61±0.42a
RR-N100
7.85±0.01d
1.77±0.03a
26.97±0.83a
4.28±0.14a
243.18±11.41ab
3.10±0.61a
32.51±2.50a
4.75±0.01a
16.29±0.18a
NR-N0
8.38±0.02a
1.71±0.07a
27.78±0.99a
3.25±0.08b
221.48±8.72a
1.06±0.05b
3.43±0.03c
6.69±0.03a
14.32±0.37a
NR-N30
8.24±0.10ab
1.69±0.04a
28.52±0.96a
3.58±0.07a
221.21±1.82b
1.99±0.40a
4.84±0.46b
6.59±0.01a
14.04±0.29a
NR-N50
8.11±0.08bc
1.80±0.07a
28.86±1.05a
3.38±0.12b
237.36±0.90a
1.59±0.19ab
5.38±0.31b
6.55±0.02a
13.99±0.55a
NR-N100
8.01±0.10c
1.80±0.06a
28.12±0.89a
3.70±0.17a
219.33±8.32b
1.92±0.37a
8.51±0.28a
6.72±0.01a
13.51±0.37a
RE-N0
8.56±0.02a
1.69±0.14a
26.87±0.70a
3.52±0.17a
229.00±4.93a
1.21±0.15a
3.27±0.33d
7.06±0.01a
13.48±0.23a
RE-N30
8.13±0.01c
1.83±0.02a
28.30±0.62a
3.75±0.16a
248.64±9.04a
1.34±0.09a
7.28±0.66c
7.77±0.01a
13.48±0.19a
RE-N50
8.25±0.01b
1.74±0.13a
27.59±0.43a
3.62±0.32a
228.46±10.70a
1.19±0.11a
5.44±0.17b
8.06±0.01a
13.51±0.26a
RE-N100
8.11±0.03c
1.79±0.07a
27.30±0.72a
2.60±0.23a
234.68±10.93a
1.27±0.21a
8.64±0.49a
7.93±0.02a
13.39±0.39a
RR
8.07±0.01c
1.74±0.02a
26.97±0.26b
4.07±0.01a
241.91±5.12a
1.89±0.08a
16.05±0.56a
4.85±0.01c
15.95±0.20a
NR
8.18±0.01b
1.75±0.03a
28.32±0.32a
3.49±0.13b
229.84±3.18a
1.64±0.10a
5.54±0.02b
6.63±0.01b
13.96±0.28b
RE
8.26±0.01a
1.76±0.04a
27.51±0.38ab
3.37±0.08b
235.19±2.13a
1.25±0.06b
6.16±0.12b
7.01±0.02a
13.47±0.06b
Table S4 Changes in soil physical-chemical properties under water-N interactions
Treatment
AGB (g/m2)
AB plants (g/m2)
P. weeds (g/m2)
P. grasses (g/m2)
LF (g/m2)
Richness index
Shannon- wiener index
Pielou index
Simpson index
RR-N0
104.51±4.35ab
19.99±1.86ab
31.66±4.88a
39.17±8.16a
34.46±1.95c
6.92±0.46b
1.20±0.17b
0.58±0.05c
0.54±0.07b
RR-N30
111.26±11.70ab
18.79±1.18b
22.58±2.14bc
43.92±4.26a
41.39±0.89b
7.83±0.17a
1.46±0.01a
0.72±0.02ab
0.71±0.02a
RR-N50
98.47±2.05b
23.69±0.99a
16.39±3.65c
51.02±3.59a
54.69±4.93a
7.33±0.60ab
1.31±0.07b
0.67±0.03b
0.68±0.05a
RR-N100
117.75±4.24a
21.09±2.72ab
29.78±1.84ab
51.16±2.89a
45.75±2.71b
7.50±0.10ab
1.51±0.02a
0.79±0.03a
0.75±0.02a
NR-N0
159.82±3.37c
62.42±2.65b
10.67±0.87b
86.59±6.49b
100.10±0.51a
7.00±0.50b
1.41±0.03ab
0.68±0.02b
0.65±0.03a
NR-N30
191.97±3.71a
62.57±4.42b
14.50±4.47b
128.31±15.86a
97.25±13.27a
8.50±0.29a
1.61±0.06a
0.76±0.04a
0.67±0.08a
NR-N50
192.34±3.43a
78.84±3.02a
32.64±3.87a
88.35±6.52b
98.21±8.30a
8.33±1.01a
1.55±0.03ab
0.73±0.04ab
0.69±0.03a
NR-N100
183.09±1.98b
56.70±4.50b
23.96±5.56a
117.59±5.52a
96.03±6.88a
8.50±0.29a
1.44±0.17b
0.69±0.02ab
0.72±0.05a
RE-N0
237.7±5.98c
57.92±10.81b
29.13±4.65bc
105.84±14.92b
109.46±2.39b
7.83±0.93a
1.46±0.01b
0.68±0.02b
0.56±0.09a
RE-N30
291.57±4.62ab
66.15±1.41b
80.30±14.15a
142.12±16.47a
105.92±10.41b
8.75±0.25a
1.70±0.01a
0.64±0.01c
0.64±0.04a
RE-N50
278.1±12.11b
84.08±2.10a
29.51±1.48b
116.72±16.25ab
96.57±2.96b
8.75±0.52a
1.68±0.06a
0.58±0.10d
0.57±0.02a
RE-N100
312.89±20.51a
65.78±3.09b
80.36±15.98a
104.52±10.37b
127.68±7.30a
8.00±0.29a
1.52±0.05b
0.64±0.02a
0.67±0.05a
RR
107.99±1.85c
20.89±0.57b
25.10±1.88b
46.32±1.82c
44.07±0.54c
7.40±0.15b
1.41±0.02c
0.69±0.01ab
0.67±0.01a
NR
181.81±0.53b
65.13±1.49a
20.44±1.55b
105.21±0.95b
97.90±3.33b
8.08±0.11a
1.49±0.02b
0.71±0.02a
0.68±0.03a
RE
280.07±5.82a
68.48±1.36a
54.83±5.60a
117.30±6.39a
109.91±2.76a
8.33±0.28a
1.59±0.01a
0.66±0.01b
0.61±0.03a
Table S5 Effects of water-N interactions on vegetation biomass, litter fall (LF), and vegetation diversity
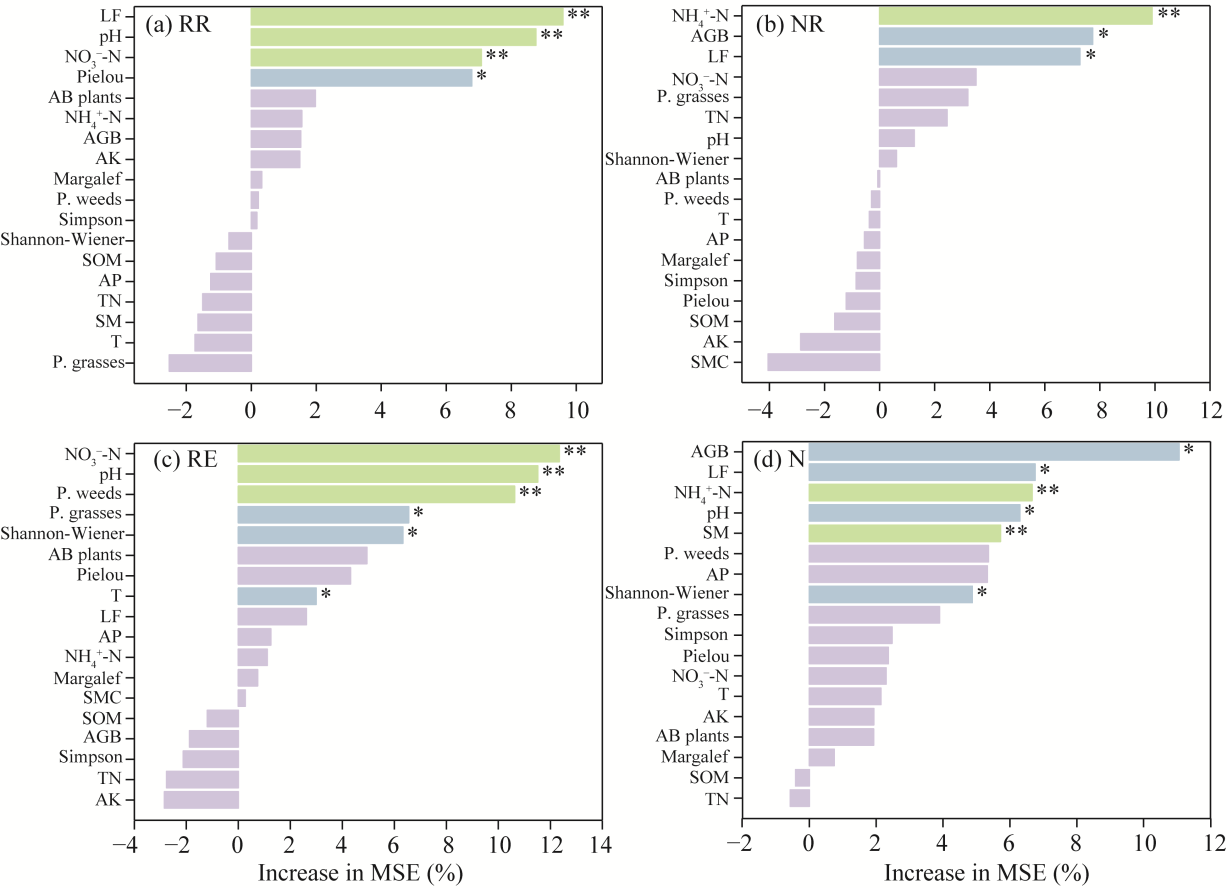
Fig. 8Importance ranking of environmental factors affecting soil microarthropods under different water levels and N addition treatments. (a), RR; (b), NR; (c), RE; (d), N. LF, litter fall; AB plants, annual and biennial plants; AGB, aboveground biomass; AK, available potassium; P. weeds, perennial weeds; SOM, soil organic matter; AP, available phosphorus; TN, total nitrogen; SM, soil moisture; T, soil temperature; P. grasses, perennial grasses; MSE, mean square error. *, P<0.050 level; **, P<0.010 level.
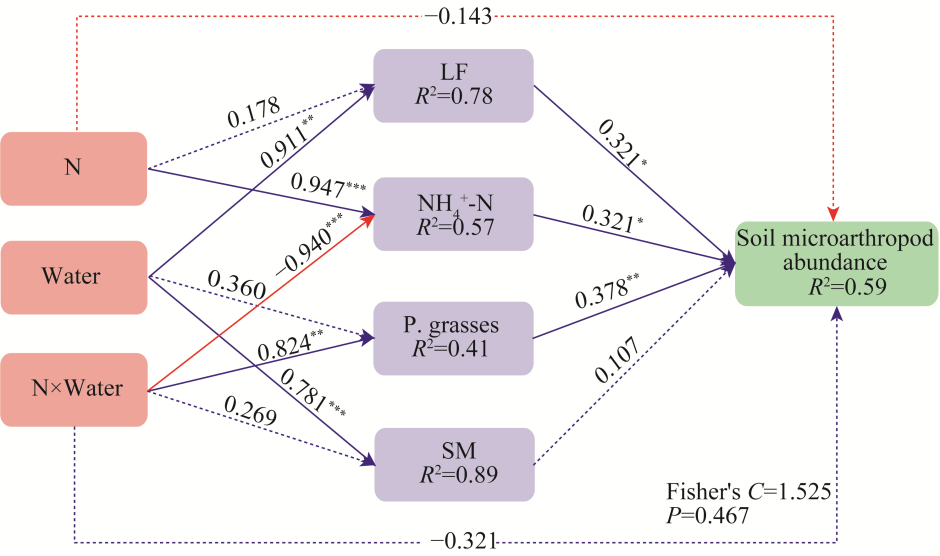
Fig. 9Main pathways affecting soil microarthropod abundance under different water levels and N addition treatments. The solid line indicates the direct effect and the dashed line indicates the indirect effect. *, P<0.050 level; **, P<0.010 level; ***, P<0.001 level.
[1]
Bao S D. 2000. Soil and Agricultural Chemistry Analysis (3rd ed.). Beijing: Agriculture Press, 20-97. (in Chinese)
[2]
Bian H X, Geng Q H, Xiao H R, et al. 2019. Fine root biomass mediates soil fauna community in response to nitrogen addition in poplar plantations (Populus deltoids) on the east coast of China. Forests, 10(2): 122, doi: 10.3390/f10020122.
[3]
Bobbink R, Hicks K, Galloway J, et al. 2010. Global assessment of nitrogen deposition effects on terrestrial plant diversity: A synthesis. Ecological Applications, 20(1): 30-59.
pmid: 20349829
[4]
De L C J, Sardans J, Galindo M, et al. 2025. Stoichiometry of litter decomposition under the effects of climate change and nutrient enrichment: A meta-analysis. Plant and Soil, 506(1): 709-726.
doi: 10.1007/s11104-024-06718-3
[5]
Doblas-Miranda E, Paquette A, Work T T. 2014. Intercropping trees' effect on soil oribatid diversity in agro-ecosystems. Agroforestry Systems, 88(4): 671-678.
doi: 10.1007/s10457-014-9680-y
[6]
Du Z Y, Zhang X W, Liu S X, et al. 2024. Nitrogen and water addition alters species diversity and interspecific relationship in a desert grassland. Science of The Total Environment, 908: 168386, doi: 10.1016/j.scitotenv.2023.168386.
[7]
Duan D Y, Kent A D. 2024. Nitrogen acquisition and retention pathways in sustainable perennial bioenergy grass cropping systems. GCB Bioenergy, 16(6): 13143, doi: 10.1111/gcbb.13143.
[8]
Fujii S, Cornelissen J H C, van Logtestijn R S P, et al. 2023. Downed deadwood habitat heterogeneity drives trophic niche diversity of soil-dwelling animals. Soil Biology and Biochemistry, 187: 109193, doi: 10.1016/j.soilbio.2023.109193.
[9]
Gallese F, Gismero-Rodriguez L, Govednik A, et al. 2025. Soil microarthropods as tools for monitoring soil quality: The QBS-ar index in three European agroecosystems. Agriculture, 15(1): 89, doi: 10.3390/agriculture15010089.
[10]
Galloway J N, Dentener F J, Capone D G, et al. 2004. Nitrogen cycles: Past, present, and future. Biogeochemistry, 70(2): 153-226.
doi: 10.1007/s10533-004-0370-0
[11]
Gao H, Hu H N, Bindeliya, et al. 2025. Reseeding Caragana korshinskii recovers soil microbiome structure but not stability or complexity after eight years in degraded desert steppe. Journal of Plant Ecology, 18(3): rtaf055, doi: 10.1093/jpe/rtaf055.
[12]
Gonzalez G, Barberena-Arias M F, Huang W, et al. 2021. Measuring Arthropod Biodiversity. Switzerland: Springer, 495-522.
[13]
Guo X H, Endler A, Poll C, et al. 2021. Independent effects of warming and altered precipitation pattern on nematode community structure in an arable field. Agriculture, Ecosystems and Environment, 316(15): 107467, doi: 10.1016/j.agee.2021.107467.
[14]
Guo X X, Zuo X A, Yue P, et al. 2022. Direct and indirect effects of precipitation change and nutrients addition on desert steppe productivity in Inner Mongolia, northern China. Plant and Soil, 471(1/2): 527-540.
doi: 10.1007/s11104-021-05206-2
[15]
Houghton R A. 2001. Counting terrestrial sources and sinks of carbon. Climatic Change, 48(4): 525-534.
doi: 10.1023/A:1005658316062
[16]
Hu C C, Liu X Y, Driscoll A W, et al. 2024. Global distribution and drivers of relative contributions among soil nitrogen sources to terrestrial plants. Nature Communications, 15(1): 6407, doi: 10.1038/S41467-024-50674-6.
[17]
Hu J X, Zhou S X, Tie L H, et al. 2022. Effects of nitrogen addition on soil faunal abundance: A global meta-analysis. Global Ecology and Biogeography, 31(8): 1655-1666.
doi: 10.1111/geb.v31.8
[18]
Li J H, Liu Q, Yin R, et al. 2025. Nitrogen addition and plant functional type mediate the mesofauna-driven litter element release of subtropical forest. Plant and Soil, 510(1): 907-921.
doi: 10.1007/s11104-024-06969-0
[19]
Li W H, Hodzic J, Su J S, et al. 2020. A dataset of plant and microbial community structure after long-term grazing and mowing in a semiarid steppe. Scientific Data, 7(1): 403, doi: 10.1038/s41597-020-00738-1.
[20]
Lindberg N, Engtsson J B, Persson T. 2002. Effects of experimental irrigation and drought on the composition and diversity of soil fauna in a coniferous stand. Journal of Applied Ecology, 39(6): 924-936.
doi: 10.1046/j.1365-2664.2002.00769.x
[21]
Ma Q H, Li Y B, Zhu Y, et al. 2022. Precipitation variations, rather than N deposition, determine plant ecophysiological traits in a desert steppe in Northern China. Ecological Indicators, 141: 109144, doi: 10.1016/j.ecolind.2022.109144.
[22]
Maraun M, Scheu S. 2000. The structure of oribatid mite communities (Acari, Oribatida): Patterns, mechanisms and implications for future research. Ecography, 23(3): 374-383.
doi: 10.1111/eco.2000.23.issue-3
[23]
Meehan M L, Barreto C, Turnbull M S, et al. 2020. Response of soil fauna to simulated global change factors depends on ambient climate conditions. Pedobiologia, 83: 150672, doi: 10.1016/j.pedobi.2020.150672.
[24]
Muller J N, Loh S, Braggion L, et al. 2014. Diverse urban plantings managed with sufficient resource availability can increase plant productivity and arthropod diversity. Frontiers in Plant Science, 5: 517, doi: 10.3389/fpls.2014.00517.
pmid: 25400642
[25]
Munjonji L, Behn K, Vincent M, et al. 2025. Drought, grazing, and nitrogen input influence nutrient supply and soil faunal activity in a semi-arid savannah grassland. Scientific Reports, 15(1): 34248, doi: 10.1038/S41598-025-16281-1.
[26]
Oleg C, Yakov K, Irina P, et al. 2022. Modelling the rhizosphere priming effect in combination with soil food webs to quantify interaction between living plant, soil biota and soil organic matter. Plants, 11(19): 2605, doi: 10.3390/plants11192605.
[27]
Pan W K, Zhou J J, Tang S, et al. 2023. Utilisation and transformation of organic and inorganic nitrogen by soil microorganisms and its regulation by excessive carbon and nitrogen availability. Biology and Fertility of Soils, 59(4): 379-389.
doi: 10.1007/s00374-023-01712-w
[28]
Peguero G, Sol D, Arnedo M, et al. 2019. Fast attrition of springtail communities by experimental drought and richness-decomposition relationships across Europe. Global Change Biology, 25(8): 2727-2738.
doi: 10.1111/gcb.14685
pmid: 31206913
[29]
Peguero G, Folch E, Liu L, et al. 2021. Divergent effects of drought and nitrogen deposition on microbial and arthropod soil communities in a Mediterranean forest. European Journal of Soil Biology, 103: 103275, doi: 10.1016/j.ejsobi.2020.103275.
[30]
Peng Y, Peñuelas J, Vesterdal L, et al. 2022. Responses of soil fauna communities to the individual and combined effects of multiple global change factors. Ecology Letters, 25(9): 1961-1973.
doi: 10.1111/ele.14068
pmid: 35875902
[31]
Peng Y, Vesterdal L, Peñuelas J, et al. 2023. Soil fauna effects on litter decomposition are better predicted by fauna communities within litterbags than by ambient soil fauna communities. Plant and Soil, 487(1-2): 49-59.
doi: 10.1007/s11104-023-05902-1
[32]
Phillips M L, Winkler D E, Reibold R H, et al. 2021. Muted responses to chronic experimental nitrogen deposition on the Colorado Plateau. Oecologia, 195(2): 513-524.
doi: 10.1007/s00442-020-04841-3
pmid: 33415421
[33]
Qiu X, Hou J, Guo N, et al. 2022. Seasonal variations and influencing factors of gross nitrification rate in desert steppe soil. Sustainability, 14(8): 4787, doi: 10.3390/su14084787.
[34]
Reichmann L G, Sala O E, Peters D P C. 2013. Water controls on nitrogen transformations and stocks in an arid ecosystem. Ecosphere, 4(1): 1-17.
[35]
Santonja M, Fernandez C, Proffit M, et al. 2017. Plant litter mixture partly mitigates the negative effects of extended drought on soil biota and litter decomposition in a Mediterranean oak forest. Journal of Ecology, 105(3): 801-815.
doi: 10.1111/jec.2017.105.issue-3
[36]
Wei X Y, Wu F Z, Heděnec P, et al. 2022. Changes in soil faunal density and microbial community under altered litter input in forests and grasslands. Fundamental Research, 2(6): 954-963.
doi: 10.1016/j.fmre.2022.01.029
pmid: 38933376
[37]
Wu T J, Su F L, Han H Y, et al. 2014. Responses of soil microarthropods to warming and increased precipitation in a semiarid temperate steppe. Applied Soil Ecology, 84: 200-207.
doi: 10.1016/j.apsoil.2014.07.003
[38]
Wu Q Q, Yue K, Wang X C, et al. 2020. Differential responses of litter decomposition to warming, elevated CO2, and changed precipitation regime. Plant and Soil, 455(1-2): 155-169.
doi: 10.1007/s11104-020-04675-1
[39]
Wu Z D, Ma S F, Lu J Y, et al. 2024. Vertical distribution and driving mechanisms of soil microarthropods in a Stipa baicalensis meadow steppe under long-term nitrogen addition. Ecological Indicators, 159: 111732, doi: 10.1016/j.ecolind.2024.111732.
[40]
Wu Z D, Ma S F, Wu R H, et al. 2025. Community variation characteristics and driving pathways of soil microarthropods in meadow steppe under different nitrogen application durations. Agriculture, Ecosystems & Environment, 393: 109818, doi: 10.1016/j.agee.2025.109818.
[41]
Yang A, Song B, Zhang W X, et al. 2024. Chronic enhanced nitrogen deposition and elevated precipitation jointly benefit soil microbial community in a temperate forest. Soil Biology and Biochemistry, 193: 109397, doi: 10.1016/j.soilbio.2024.109397.
[42]
Yang X, Shao M A, Li T C, et al. 2021. Community characteristics and distribution patterns of soil fauna after vegetation restoration in the northern Loess Plateau. Ecological Indicators, 122: 107236, doi: 10.1016/j.ecolind.2020.107236.
[43]
Yang X, Shao M A, Li T C. 2025. Climate change enhances soil fauna population and biomass in grasslands of the Loess Plateau. Communications Earth & Environment, 6(1): 550, doi: 10.1038/S43247-025-02542-4.
[44]
Yang X J, Huang Z Y, Dong M, et al. 2019. Responses of community structure and diversity to nitrogen deposition and rainfall addition in contrasting steppes are ecosystem-dependent and dwarfed by year-to-year community dynamics. Annals of Botany, 124(3): 461-469.
doi: 10.1093/aob/mcz098
pmid: 31161191
[45]
Ye H, Zhao Y, He S L, et al. 2024. Metagenomics reveals the response of desert steppe microbial communities and carbon-nitrogen cycling functional genes to nitrogen deposition. Frontiers in Microbiology, 15: 1369196, doi: 10.3389/fmicb.2024.1369196.
[46]
Yin W Y. 1998. Pictorial Keys to Soil Animals of China. Beijing: Science Press. (in Chinese)
[47]
Yu H Y, Ma Q H, Liu X D, et al. 2021. Resistance, recovery, and resilience of desert steppe to precipitation alterations with nitrogen deposition. Journal of Cleaner Production, 317: 128434, doi: 10.1016/j.jclepro.2021.128434.
[48]
Yu Y, Peñuelas J, Sardans J, et al. 2024. Water addition but not reduction alters plant biomass-diversity relationship. Global Change Biology, 30(7): e17430, doi: 10.1111/gcb.17430.
[49]
Yue K, Peng Y, Fornara D A, et al. 2019. Responses of nitrogen concentrations and pools to multiple environmental change drivers: A meta-analysis across terrestrial ecosystems. Global Ecology and Biogeography, 28(5): 690-724.
doi: 10.1111/geb.v28.5
[50]
Zhang Y Q, Luo Z Z, Li L L, et al. 2025. Nitrogen fertilization shapes soil microbial diversity and ecosystem multifunctionality by modulating soil nutrients. Microorganisms, 13(3): 540, doi: 10.3390/microorganisms13030540.
[51]
Zheng Y J, Zhang X, Du X X, et al. 2026. From nitrogen addition to productivity: Above-belowground mechanisms and nonlinear thresholds in grasslands. Frontiers in Plant Science, 16: 1719906, doi: 10.3389/fpls.2025.1719906.