| Research article |
|


|
|
|
| Coupling analysis of social-economic water consumption and its effects on the arid environments in Xinjiang of China based on the water and ecological footprints |
ZHANG Pei1, DENG Mingjiang2, LONG Aihua1,3,*( ), DENG Xiaoya1, WANG Hao1, HAI Yang1, WANG Jie3, LIU Yundong4 ), DENG Xiaoya1, WANG Hao1, HAI Yang1, WANG Jie3, LIU Yundong4 |
1 State Key Laboratory of Simulation and Regulation of Water Cycle in River Basin, China Institute of Water Resources and Hydropower Research, Beijing 100038, China
2 Xinjiang Water Conservancy and Hydropower Planning and Design Management Bureau, Urumqi 830000, China
3 College of Water Conservancy and Architectural Engineering, Shihezi University, Shihezi 832003, China
4 College of Soil & Water Conservation, Beijing Forestry University, Beijing 100083, China; |
|
|
|
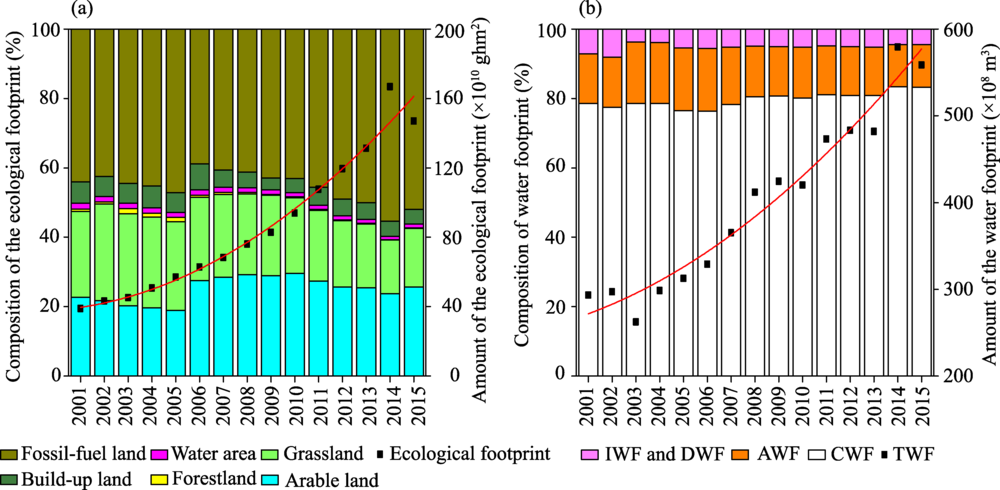
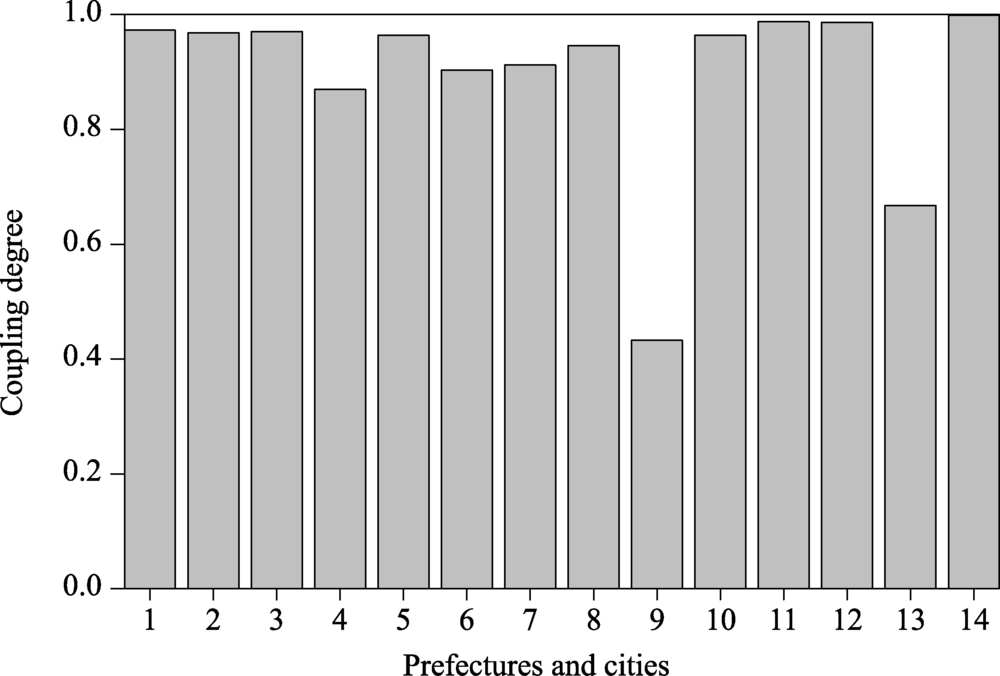
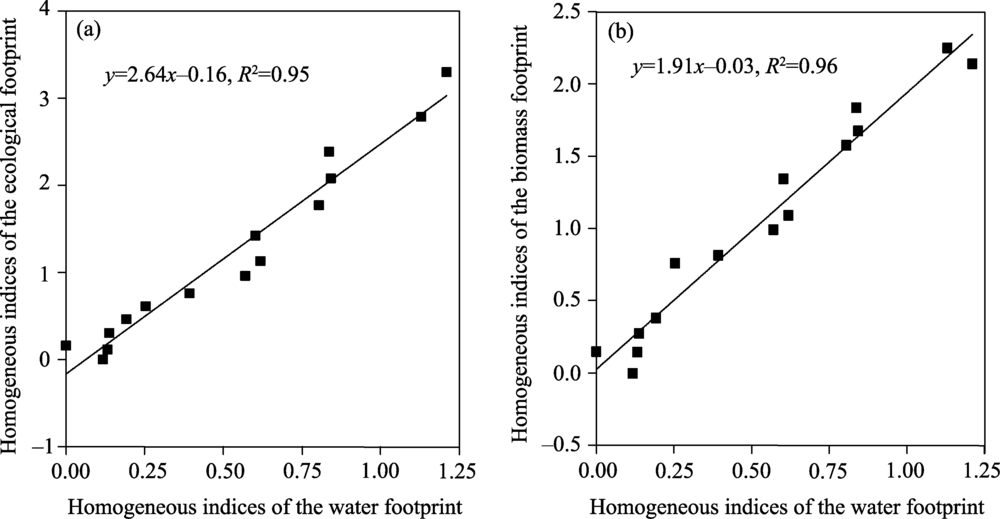
Abstract In arid areas, ecological degradation aroused by over-exploitation of fresh water, expansion of artificial oasis and shrinkage of natural oasis, has drawn attention of many scholars and officials. The water and ecological footprints can be used to quantitatively evaluate the water consumption of social-economic activities and their influence on the eco-environments. In addition, increase of the water footprint indicates the expansion of artificial oasis, and the influence on the natural oasis could be reflected by the variation of the ecological footprint. This study was conducted to answer a scientific question that what is the quantitative relationship between the expansion of the artificial oasis and the degradation of the natural oasis in the arid environments of Xinjiang, China. Thus, based on the social-economic data, water consumption data and meteorological data during 2001-2015, we calculated the water and ecological footprints to express the human-related pressure exerted on the water resources and arid environments in Xinjiang (including 14 prefectures and cities), and explore the relationship between the water and ecological footprints and its mechanism by using the coupling analysis and Granger causality test. The results show that both the water and ecological footprints of Xinjiang increased significantly during 2001-2015, and the increasing rate of the ecological footprint was much faster than that of the water footprint. The coupling degree between the water and ecological footprints was relatively high at the temporal scale and varied at the spatial scale. Among the 14 prefectures and cities examined in Xinjiang, the greater social-economic development (such as in Karamay and Urumqi) was associated with the lower coupling degree between the two footprints. Increases in the water footprint will cause the ecological footprint to increase, such that a 1-unit increase in the consumption of water resources would lead to 2-3 units of ecological degradation. The quantitative relationship between the increases of the water and ecological footprints, together with the intensities of water consumption both in the natural and artificial oases of Tarim River Basin, have approved the fact that the formation and expansion of 1 unit of the artificial oasis would bring about the degradation of 2 units of the natural oasis. These conclusions not only provide a technical basis for sustainable development in Xinjiang, but also offer a theoretical guide and scientific information that could be used in similar arid areas around the world.
|
|
Received: 05 December 2018
Published: 10 February 2020
|
|
Corresponding Authors:
|
| About author: *Corresponding author: LONG Aihua (E-mail: ahlong@iwhr.com) |
| Cite this article:
ZHANG Pei, DENG Mingjiang, LONG Aihua, DENG Xiaoya, WANG Hao, HAI Yang, WANG Jie, LIU Yundong. Coupling analysis of social-economic water consumption and its effects on the arid environments in Xinjiang of China based on the water and ecological footprints. Journal of Arid Land, 2020, 12(1): 73-89.
URL:
http://jal.xjegi.com/10.1007/s40333-020-0050-5 OR http://jal.xjegi.com/Y2020/V12/I1/73
|
|
|
| [1] |
Bosire C K, Ogutu J O, Said M Y, et al. 2015. Trends and spatial variation in water and land footprints of meat and milk production systems in Kenya. Agriculture, Ecosystems & Environment, 205: 36-47.
|
|
|
| [2] |
Bureau of Statistics of Xinjiang Production and Construction Corps. 2002-2016. Xinjiang Production and Construction Corps Statistical Yearbook. Beijing: China Statistics Press. (in Chinese)
|
|
|
| [3] |
Bureau of Statistics of Xinjiang Uygur Autonomous Region. 2002-2016. Xinjiang Statistical Yearbook. Beijing: China Statistics Press. (in Chinese)
|
|
|
| [4] |
Chen L. 2012. Protecting the source of life, the backbone of production, the foundation of ecology-implementing the strictest water resources management system. Qiushi, 14: 38-40. (in Chinese)
|
|
|
| [5] |
Chen Y N, Li B F, Fan Y T, et al. 2019. Hydrological and water cycle processes of inland river basins in the arid region of Northwest China. Journal of Arid Land, 11(2): 161-179.
|
|
|
| [6] |
Dai J J, Wu Y J, Ouyang Y R. 2015. Calculations of the national average yield, equivalence factor and yield factor in ten years based on national hectares' ecological footprint model-A case study of Xiamen City. Communications in Computer & Information Science, 482: 338-349.
|
|
|
| [7] |
Deng M J. 2010. Research and thinking on water resources in Xinjiang. Quaternary Sciences, 30(1): 107-114. (in Chinese)
|
|
|
| [8] |
Ewing B R, Hawkins T R, Wiedmann T O, et al. 2012. Integrating ecological and water footprint accounting in a multi-regional input-output framework. Ecological Indicators, 23(4): 1-8.
|
|
|
| [9] |
Fan Z L, Mu G J, Ma Y J, et al. 2002. Formation and development of the artificially irrigated oases in the northern piedmont of the Tianshan Mountains. Scientia Geographica Sinica, 22(2): 184-189. (in Chinese)
|
|
|
| [10] |
Fang K, Heijungs R, de Snoo G R. 2014. Theoretical exploration for the combination of the ecological, energy, carbon, and water footprints: Overview of a footprint family. Ecological Indicators, 36: 508-518.
|
|
|
| [11] |
Fang K, Duan Z. 2015. An integrated assessment of national environmental sustainability by synthesizing carbon, water and land footprints and boundaries. Journal of Natural Resources, 30(4): 539-548. (in Chinese)
|
|
|
| [12] |
Feng M. 2011. Resource and environmental pressure and efficiency of regional economies. PhD Dissertation. Shenyang: Northeastern University, 18-24. (in Chinese)
|
|
|
| [13] |
Galli A, Wiedmann T, Ercin E, et al. 2012. Integrating ecological, carbon and water footprint into a "footprint family" of indicators: Definition and role in tracking human pressure on the planet. Ecological Indicators, 16: 100-112.
|
|
|
| [14] |
Gao F, Li Y Z, Guo J X, et al. 2017. A review of water footprint assessment for agricultural products. Chinese Journal of Eco-Agriculture, 25(7): 1071-1080. (in Chinese)
|
|
|
| [15] |
Gao G Y, Shen Q, Zhang Y, et al. 2018. Determining spatio-temporal variations of ecological water consumption by natural oases for sustainable water resources allocation in a hyper-arid endorheic basin. Journal of Cleaner Production, 185: 1-13.
|
|
|
| [16] |
Ge L Q, Xie G D, Zhang C X, et al. 2011. An evaluation of China's water footprint. Water Resources Management, 25(10): 2633-2647.
|
|
|
| [17] |
Granger C W J. 1969. Investigating causal relations by econometric models and cross-spectral methods. Econometrica, 37(3): 424-438.
|
|
|
| [18] |
Granger C W J. 1988. Some recent development in a concept of causality. Journal of Econometrics, 39(1-2): 199-211.
|
|
|
| [19] |
Guo H W, Xu H L, Ling H B, et al. 2017. Transformation process and appropriate area proportion of artificial and natural oases in the Tarim River Basin. Chinese Journal of Soil Science, 48(3): 532-539. (in Chinese)
|
|
|
| [20] |
Hao H G, Zhang J P, Li X B, et al. 2015. Impact of livelihood diversification of rural households on their ecological footprint in agro-pastoral areas of northern China. Journal of Arid Land, 7(5): 653-664.
|
|
|
| [21] |
Hertwich E G, Peters G P. 2009. Carbon footprint of nations: a global, trade-linked analysis. Environmental Science & Technology, 43(16): 6414-6420.
|
|
|
| [22] |
Hoekstra A Y, Chapagain A K. 2008. Globalization of Water: Sharing the Planet's Freshwater Resources. Oxford: Blackwell Publishing Press, 23-25.
|
|
|
| [23] |
Hoekstra A Y, Chapagain A, Aldaya A, et al. 2011. The Water Footprint Assessment Manual: Setting the Global Standard. London: Earthscan Press, 25-39.
|
|
|
| [24] |
Hu S J, Song Y D, Tian C Y, et al. 2007. Suitable scale of Weigan River plain oasis. Science in China, 50(S1): 56-64. (in Chinese)
|
|
|
| [25] |
Hurlin C, Venet B. 2001. Granger causality tests in panel data models with fixed coefficients. Paris: EURIsCO, University Paris IX Dauphin, 1-31. .
|
|
|
| [26] |
Jiao J Y, Gui L D, Jia G J. 2013. Sustainable development of ecological economy of small watersheds in semi-arid loess hilly region. Journal of Ecology and Rural Environment, 29(5): 559-565. (in Chinese)
|
|
|
| [27] |
Li J L, Feng Q, Guo Q L. 2008. Fractal study of sustainable proportions of natural and artificial oases. Environmental Geology, 55(7): 1389-1396.
|
|
|
| [28] |
Li J L, Zhang S Q, Pu Z C, et al. 2013. Spatial-temporal variation of seasonal and annual air temperature in Xinjiang during 1961-2010. Arid Land Geography, 36(2): 228-237. (in Chinese)
|
|
|
| [29] |
Li Y, Guo T T, Zhao Q Y. 2011. Ecological footprint model parameters revised study. Applied Mechanics and Materials, 99-100: 582-586.
|
|
|
| [30] |
Ling H B, Xu H L, Liu X H, et al. 2012. Suitable scale of oasis in Keriya River basin, Xinjiang. Advances in Water Science, 23(4): 563-568. (in Chinese)
|
|
|
| [31] |
Ling H B, Xu H L, Fu J Y, et al. 2013. Suitable oasis scale in a typical continental river basin in an arid region of China: A case study of the Manas River Basin. Quaternary International, 286(430): 116-125.
|
|
|
| [32] |
Ling H B, Guo B, Xu H L, et al. 2014. Configuration of water resources for a typical river basin in an arid region of China based on the ecological water requirements (EWRs) of desert riparian vegetation. Global and Planetary Change, 122: 292-304.
|
|
|
| [33] |
Liu B, Zhao W Z, Chang X X, et al. 2010. Water requirements and stability of oasis ecosystem in arid region, China. Environmental Earth Sciences, 59(6): 1235-1244.
|
|
|
| [34] |
Mekonnen M M, Hoekstra A Y. 2014. Water footprint benchmarks for crop production: A first global assessment. Ecological Indicators, 46: 214-223.
|
|
|
| [35] |
National Bureau of Statistics of China. 2002-2016. China Statistical Yearbook. Beijing: China Statistics Press. (in Chinese)
|
|
|
| [36] |
Perry C. 2014. Water footprints: Path to enlightenment, or false trail. Agricultural Water Management, 134: 119-125.
|
|
|
| [37] |
Qi C, Chang N B. 2012. Integrated carbon footprint and cost evaluation of a drinking water infrastructure system for screening expansion alternatives. Journal of Cleaner Production, 27: 51-63.
|
|
|
| [38] |
Qin X G, Liu J Q, Jia H J, et al. 2012. New evidence of agricultural activity and environmental change associated with the ancient Loulan kingdom, China, around 1500 years ago. The Holocene, 22(1): 53-61.
|
|
|
| [39] |
Rees W E. 1992. Ecological footprints and appropriated carrying capacity: what urban economics leaves out. Environment and Urbanization, 6(2): 121-130.
|
|
|
| [40] |
Ridha I, Ben S H. 2018. Water footprint and economic water productivity of sheep meat at farm scale in humid and semi-arid agro-ecological zones. Small Ruminant Research, 166: 101-108.
|
|
|
| [41] |
Rushforth R R, Adams E A, Ruddell B L. 2013. Generalizing ecological, water and carbon footprint methods and their worldview assumptions using Embedded Resource Accounting. Water Resources and Industry, 1-2: 77-90.
|
|
|
| [42] |
Salameh E. 2008. Over-exploitation of groundwater resources and their environmental and socio-economic implications: the case of Jordan. Water International, 33(1): 55-68.
|
|
|
| [43] |
Somogyi Z. 2016. A framework for quantifying environmental sustainability. Ecological Indicators, 61: 338-345.
|
|
|
| [44] |
Sun S, Wu P, Wang Y B, et al. 2013. The impacts of inter-annual climate variability and agricultural inputs on water footprint of crop production in an irrigation district of China. Science of the Total Environment, 444(2): 498-507.
|
|
|
| [45] |
Veettil A V, Mishra A K. 2016. Water security assessment using blue and green water footprint concepts. Journal of Hydrology, 542: 589-602.
|
|
|
| [46] |
Wackernagel M, Yount J D. 1998. The ecological footprint: an indicator of progress toward regional sustainability. Environmental Monitoring and Assessment, 51(1-2): 511-529.
|
|
|
| [47] |
Wackernagel M, Onisto L, Bello P, et al. 1999. National natural capital accounting with the ecological footprint concept. Ecological Economics, 29(3): 375-390.
|
|
|
| [48] |
Wackernagel M, Monfreda C, Schulz N B, et al. 2004. Calculating national and global ecological footprint time series: Resolving conceptual challenges. Land Use Policy, 21(3): 271-278.
|
|
|
| [49] |
Wang Y J, Guo Y H. 2018. Characteristics of oasis before and after the ecology water transportation in lower reaches of the Tarim River. Desert & Oasis Meteorology, 12(2): 37-42. (in Chinese)
|
|
|
| [50] |
Water Resources Bureau of Xinjiang Uygur Autonomous Region. 2001-2015. Xinjiang Water Resources Bulletin. Beijing: Water Resources and Electric Power Press. . (in Chinese)
|
|
|
| [51] |
Wu Y, Wu S X, Zhang J, et al. 2014. Study of Xinjiang oasis with multitude of temporal and spatial data. Arid Land Geography, 37(2): 333-341. (in Chinese)
|
|
|
| [52] |
Xie G D, Lu C X, Cheng S K, et al. 2001. Evaluation of natural capital utilization with ecological footprint in China. Resources Science, 23(6): 20-23. (in Chinese)
|
|
|
| [53] |
Xu Z M, Zhang Z Q, Cheng G D, et al. 2003. Ecological footprint calculation and development capacity analysis of China in 1999. Chinese Journal of Applied Ecology, 14(2): 280-285. (in Chinese)
|
|
|
| [54] |
Xue N C, Aniwar A, Gong L. 2009. A study on ecological capacity and ecological footprint in recent 10 years in Xinjiang. Journal of Arid Land Resources and Environment, 23(6): 24-27. (in Chinese)
|
|
|
| [55] |
Yang K Z, Yang Y, Chen J. 2000. Ecological footprint analysis: concept, method and cases. Advances in Earth Science, 15(6): 630-636. (in Chinese)
|
|
|
| [56] |
Yang X P, Dong J F, White P D. 2006. The key role of water resources management in ecological restoration in western China. Geographical Research, 44(2): 146-154.
|
|
|
| [57] |
Zhang P, Xu H L, Du Q, et al. 2017. Change of ecological conditions in the mainstream area of the Tarim River based on RS and GIS during the period of 1990-2010. Arid Zone Research, 34(2): 416-422. (in Chinese)
|
|
|
| [58] |
Zhang P, Long A H, Deng X Y, et al. 2018. Impact of social factors in agricultural production on the crop water footprint in Xinjiang, China. Water, 10(9): 1145.
|
|
|
| [59] |
Zhang Y, Li S S. 2012. The time-series study of Xiangjiang River water carrying capacity based on the ecological footprint of water resource-the Changzhutan Region, for example. Advanced Materials Research, 518-523: 4362-4370.
|
|
|
| [60] |
Zhang Y, Zhang H. 2013. Analysis of water ecological footprint in Guangxi based on ecosystem services. Acta Ecologica Sinica, 33(13): 4111-4124. (in Chinese)
|
|
|
| [61] |
Zhang Y, Yang Q Y, Min J. 2016. An analysis of coupling between the bearing capacity of the ecological environment and the quality of new urbanization in Chongqing. Acta Geographica Sinica, 71(5): 817-828. (in Chinese)
|
|
|
| [62] |
Zhang Z. 2016. The lost civilization of the Niya. Snowlotus, 5: 41-45. (in Chinese)
|
|
|
|
Viewed |
|
|
|
Full text
|
|
|
|
|
Abstract
|
|
|
|
|
Cited |
|
|
|
|
| |
Shared |
|
|
|
|
| |
Discussed |
|
|
|
|