| Research article |
|


|
|
|
| Biomass and carbon stocks in three types of Persian oak (Quercus brantii var. persica) of Zagros forests in a semi-arid area, Iran |
Ali MAHDAVI1,*( ), Soghra SAIDI1, Yaghob IRANMANESH2, Mostafa NADERI1 ), Soghra SAIDI1, Yaghob IRANMANESH2, Mostafa NADERI1 |
1Faculty of Agriculture and Natural Resources, Ilam University, Ilam 69315516, Iran
2Research Division of Natural Resources, Chaharmahal and Bakhtiari Agricultural and Natural Resources Research and Education Center, AREEO, Shahrekord 8818434141, Iran |
|
|
|
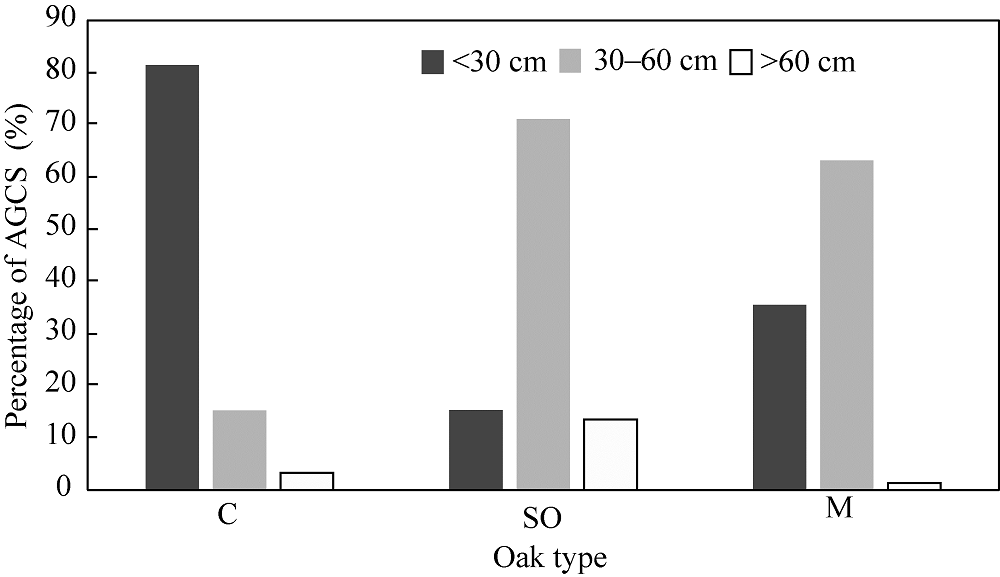
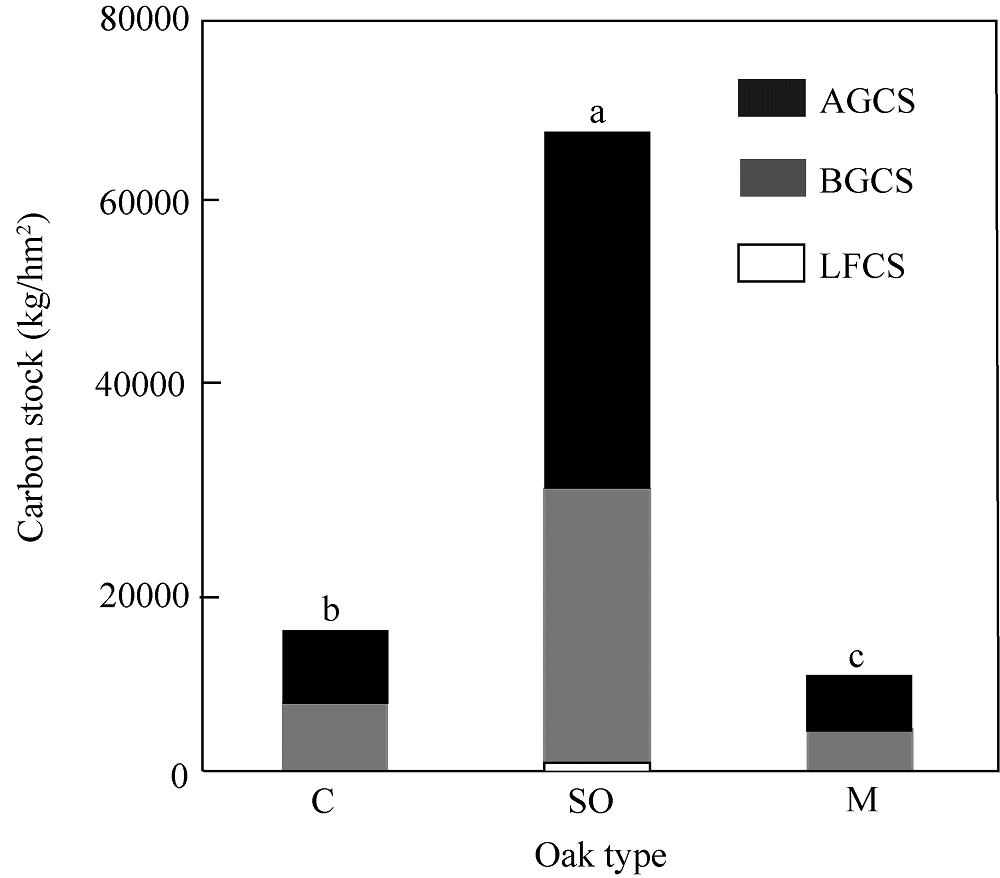
Abstract Persian oak (Quercus brantii var. persica) is a dominant tree species of Zagros forests in a semi-arid area, western Iran. However, the capacity of biomass and carbon stocks of these forests is not well studied. We selected three types of oak, i.e., seed-originated oak, coppice oak and mixed (seed-originated and coppice) oak of Zagros forests in Dalab valley, Ilam Province, Iran to survey the capacity of biomass and carbon stocks in 2018. Thirty plots with an area of 1000 m2 were systematically and randomly assigned to each type of oak. Quantitative characteristics of trees, such as diameter at breast height (DBH), height, crown diameter and the number of sprouts in each plot were measured. Then, aboveground biomass (AGB), belowground biomass (BGB), aboveground carbon stock (AGCS) and belowground carbon stock (BGCS) of each tree in plots were calculated using allometric equations. The litterfall biomass (LFB) and litterfall carbon stock (LFCS) were measured in a quadrat with 1 m×1 m in each plot. One-way analysis of variance and Duncan's test were performed to detect the differences in biomass and carbon stocks among three types of oak. Results showed that AGB, BGB and BGCS were significantly different among three types of oak. The highest values of AGB, AGCS, BGB and BGCS in seed-originated oak were 76,043.25, 14,725.55, 36,737.79 and 7362.77 kg/hm2, respectively. Also, the highest values of LFB and LFCS in seed-originated oak were 3298.33 and 1520.48 kg/hm2, respectively, which were significantly higher than those of the other two types of oak. The results imply the significant role of seed-originated oak for the regeneration of Zagros forests. Further conservation strategy of seed-originated oak is an important step in the sustainable management of Zagros forests in Iran.
|
|
Received: 18 December 2018
Published: 10 September 2020
|
|
Corresponding Authors:
|
| About author: *Corresponding author: Ali MAHDAVI (E-mail: mahdaviali56@gmail.com) |
|
|
| [1] |
Ali A, Yan E R, Chen H Y H, et al. 2016. Stand structural diversity rather than species diversity enhances aboveground carbon storage in secondary subtropical forests in eastern China. Biogeosciences, 13: 4627-4635.
doi: 10.5194/bg-13-4627-2016
|
|
|
| [2] |
Alinejadi S, Basiri R, Tahmasebi K P, et al. 2016. Estimation of biomass and carbon sequestration in various forms of Quercus brantii Lindl. stands in Balout Boland, Dehdez. Iranian Journal of Forest, 8(2): 129-139. (in Persian)
|
|
|
| [3] |
Allen M R, Gillett N P, Kettleborough J A, et al. 2006. Quantifying anthropogenic influence on recent near-surface temperature change. Surveys in Geophysics, 27: 491-544.
doi: 10.1007/s10712-006-9011-6
|
|
|
| [4] |
Allen S E, Grimshaw H M, Rowland A P. 1986. Chemical analysis. In: Moore P D, Chapman S B. Methods in Plant Ecology London: Blackwell Scientific Publication, 285-344.
|
|
|
| [5] |
Askari Y, Soltani A, Akhavan R, et al. 2017. Assessment of root-shoot ratio biomass and carbon storage of Quercus brantii Lindl. in the central Zagros forests of Iran. Journal of Forest Science, 63(6): 282-289.
doi: 10.17221/JFS
|
|
|
| [6] |
Becknell J M, Powers J S. 2014. Stand age and soils as drivers of plant functional traits and aboveground biomass in secondary tropical dry forest. Canadian Journal of Forest Research, 44(6): 604-613.
doi: 10.1139/cjfr-2013-0331
|
|
|
| [7] |
Brown S. 1996. Tropical forests and the global carbon cycle: estimating state and change in biomass density. In: Apps M J, Price D T. Forest Ecosystems, Forest Management and the Global Carbon Cycle. Heidelberg: Springer, 40.
|
|
|
| [8] |
Brown S. 2002. Measuring carbon in forests: Current status and future challenges. Environmental Pollution, 116(3): 363-372.
doi: 10.1016/s0269-7491(01)00212-3
pmid: 11822714
|
|
|
| [9] |
Chave J, Andalo C, Brown S, et al. 2005. Tree allometry and improved estimation of carbon stocks and balance in tropical forests. Oecologia, 145: 87-99.
doi: 10.1007/s00442-005-0100-x
|
|
|
| [10] |
Chen H Y H, Yong L. 2015. Net aboveground biomass declines of four major forest types with forest ageing and climate change in western Canada's boreal forests. Global Change Biology, 21: 3675-3684.
doi: 10.1111/gcb.12994
pmid: 26136379
|
|
|
| [11] |
Hernandez R, Koohafkan P, Antoine J. 2004. Assessing Carbon Stocks and Modeling Win-win Scenarios of Carbon Sequestration through Land-use Changes. Rome: Food and Agriculture Organization of the United Nations (FAO), 18-24.
|
|
|
| [12] |
Iranmanesh Y. 2013. Assessment on biomass estimation methods and carbon sequestration of Quercus brantii Lindl. in Chaharmahal & Bakhtiari forests. PhD Dissertation. Tehran: Tarbiat Modares University, 107. (in Persian)
|
|
|
| [13] |
Iranmanesh Y, Sagheb-Talebi K, Sohrabi H, et al. 2014. Biomass and carbon stocks of Brant's oak (Quercus brantii Lindl.) in two vegetation forms in Lordegan, Chaharmahal & Bakhtiari forests. Iranian Journal of Forest and Poplar Research, 22(4): 749-762. (in Persian)
|
|
|
| [14] |
Jepsen M R. 2006. Above-ground carbon stocks in tropical fallows, Sarawak, Malaysia. Forest Ecology and Management, 225(1-3): 287-295.
doi: 10.1016/j.foreco.2006.01.005
|
|
|
| [15] |
Karjalainen T. 1996. Dynamics and potentials of carbon sequestration in managed stands and wood products in Finland under changing climatic conditions. Forest Ecology and Management, 80(1-3): 113-132.
doi: 10.1016/0378-1127(95)03634-2
|
|
|
| [16] |
Lexerød N L, Eid T. 2006. An evaluation of different diameter diversity indices based on criteria related to forest management planning. Forest Ecology and Management, 222(1-3): 17-28.
doi: 10.1016/j.foreco.2005.10.046
|
|
|
| [17] |
Lorenz K, Lal R. 2010. Carbon Sequestration in Forest Ecosystems. New York: Springer, 277.
|
|
|
| [18] |
MacDicken K G. 1997. A Guide to Monitoring Carbon Storage in Forestry and Agroforestry Projects. Arlington: Winrock International Institute for Agricultural Development, 84-87.
|
|
|
| [19] |
Mensah S, Veldtman R, Du T B, et al. 2016. Aboveground biomass and carbon in a South African Mistbelt forest and the relationships with tree species diversity and forest structures. Forests, 7(79): 1-17.
doi: 10.3390/f7010001
|
|
|
| [20] |
Nunes L, Lopes D, Rego F C, et al. 2013. Aboveground biomass and net primary production of pine, oak and mixed pine-oak forests on the Vila Real District, Portugal. Forest Ecology and Management, 305: 38-47.
doi: 10.1016/j.foreco.2013.05.034
|
|
|
| [21] |
Pearson T R H, Brown S L, Birdsey R A. 2007. Measurement guidelines for the sequestration of forest carbon. In: General Technical Report NRS18. United States Department of Agriculture (USDA) Forest Service. Tennessee, USA.
|
|
|
| [22] |
Peichl M, Arain M A. 2007. Allometry and partitioning of above and belowground tree biomass in an age-sequence of white pine forests. Forest Ecology and Management, 253(1-3): 68-80.
doi: 10.1016/j.foreco.2007.07.003
|
|
|
| [23] |
SaghebTalebi K, Sajedi T, Pourhashemi M. 2014. Forest of Iran, a Treasure from the Past, a Hope for the Future. New York: Springer, 157.
|
|
|
| [24] |
Sanquetta A P, Silva F S. 2011-Biomass expansion factor and root-to-shoot ratio for Pinus in Brazil. Carbon Balance and Management, 6(6): 1-8.
doi: 10.1186/1750-0680-6-1
|
|
|
| [25] |
Sohrabi H, Bakhtiarvand-Bakhtiari S, Ahmadi K. 2016. Above and belowground biomass and carbon stocks of different tree plantations in central Iran. Journal of Arid Land, 8(1): 138-145.
doi: 10.1007/s40333-015-0087-z
|
|
|
| [26] |
Soltani A, Angelsen A, Eid T. 2014. Poverty, forest dependence and forest degradation links: evidence from Zagros, Iran. Environment and Development Economics, 19(5): 607-630.
doi: 10.1017/S1355770X13000648
|
|
|
| [27] |
Tran D B, Dargusch P, Herbohn J, et al. 2013. Interventions to better manage the carbon stocks in Australian Melaleuca forests. Land Use Policy, 35: 417-420.
doi: 10.1016/j.landusepol.2013.04.018
|
|
|
| [28] |
Wang K B, Deng L, Ren Z P, et al. 2016. Dynamics of ecosystem carbon stocks during vegetation restoration on the Loess Plateau of China. Journal of Arid Land, 8(2): 207-220.
doi: 10.1007/s40333-015-0091-3
|
|
|
| [29] |
Wang W, Lei X, Ma Z, et al. 2011. Positive relationship between aboveground carbon stocks and structural diversity in spruce dominated forest stands in New Brunswick, Canada. Forest Science, 57: 506-515.
|
|
|
| [30] |
Wang Y, Amundson R, Trumbore S. 1999. The impact of land use change on C turnover in soils. Global Biogeochemical Cycles, 13(1): 47-57.
doi: 10.1029/1998GB900005
|
|
|
| [31] |
Zhang Y, Chen H Y H. 2015. Individual size inequality links forest diversity and aboveground biomass. Journal of Ecology, 103: 1245-1252.
doi: 10.1111/1365-2745.12425
|
|
|
| [32] |
Zianis D, Muukkonen P, Mäkipää R, et al. 2005. Biomass and stem volume equations for tree species in Europe. Silva Fennica. Monographs 4: 63.
|
|
|
|
Viewed |
|
|
|
Full text
|
|
|
|
|
Abstract
|
|
|
|
|
Cited |
|
|
|
|
| |
Shared |
|
|
|
|
| |
Discussed |
|
|
|
|