| Research article |
|


|
|
|
| Plant cover as an estimator of above-ground biomass in semi-arid woody vegetation in Northeast Patagonia, Argentina |
Laura B RODRIGUEZ1,2, Silvia S TORRES ROBLES1,*( ), Marcelo F ARTURI3, Juan M ZEBERIO1, Andrés C H GRAND4, Néstor I GASPARRI5,6 ), Marcelo F ARTURI3, Juan M ZEBERIO1, Andrés C H GRAND4, Néstor I GASPARRI5,6 |
1National University of Río Negro, Atlantic Headquarters, Center for Environmental Studies from Norpatagonia (CEANPa), Viedma 8500, Argentina
2National Council of Scientific and Technical Research (CONICET), Viedma 8500, Argentina
3Ecological and Environmental Systems Research Laboratory (LISEA), National University of La Plata, La Plata 1900, Argentina
4National Institute of Agricultural Technology (INTA), AER Patagones, Carmen de Patagones 8504, Argentina
5Institute of Regional Ecology (IER), National University of Tucumán (UNT)-National Council of Scientific and Technical Research (CONICET), Tucumán 4000, Argentina
6Faculty of Natural Sciences and Miguel Lillo Institute, National University of Tucumán (UNT), Yerba Buena 4107, Argentina |
|
|
|
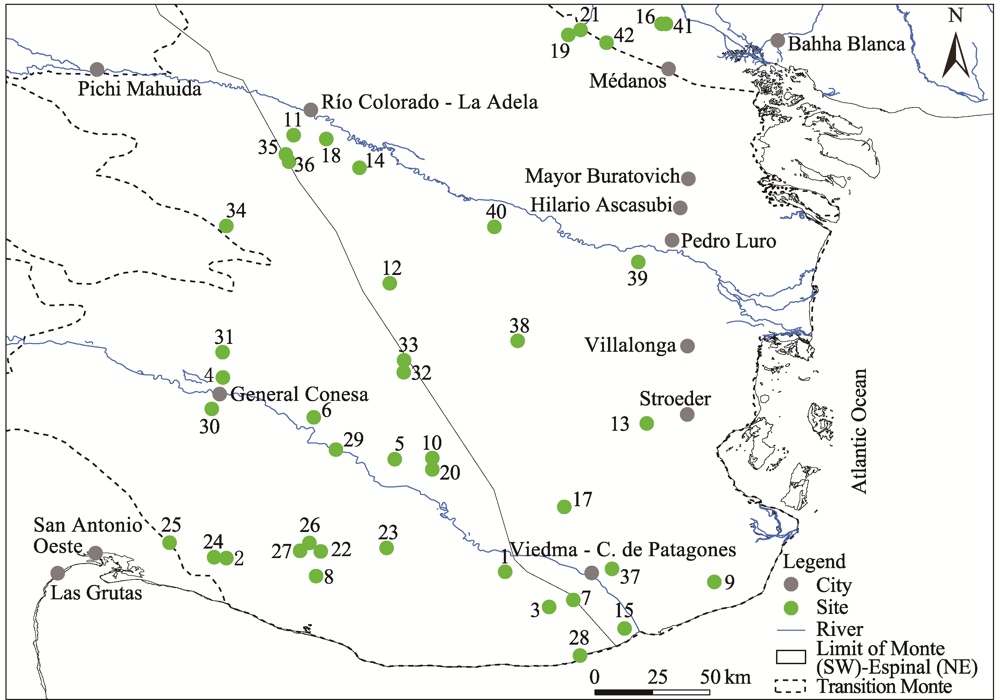
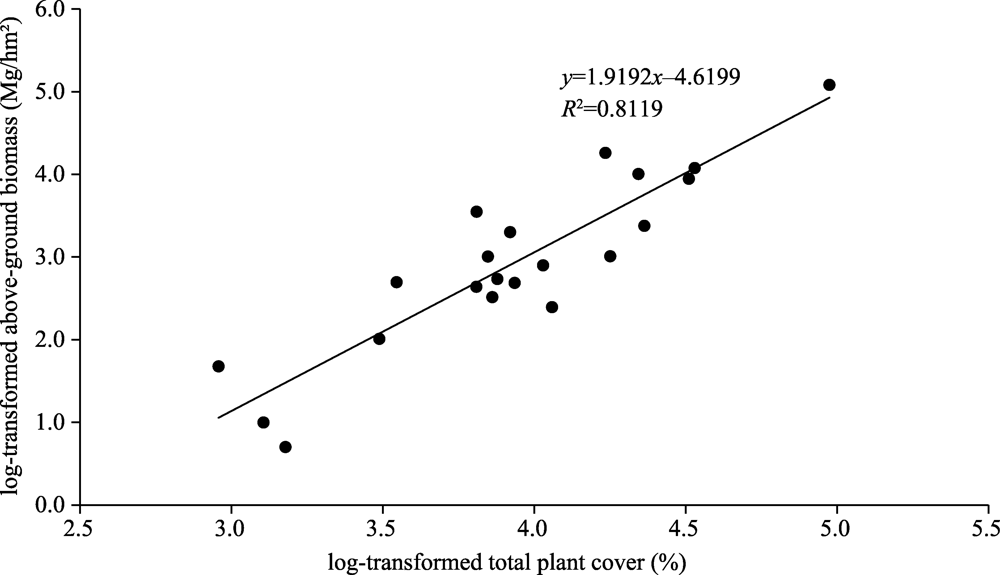
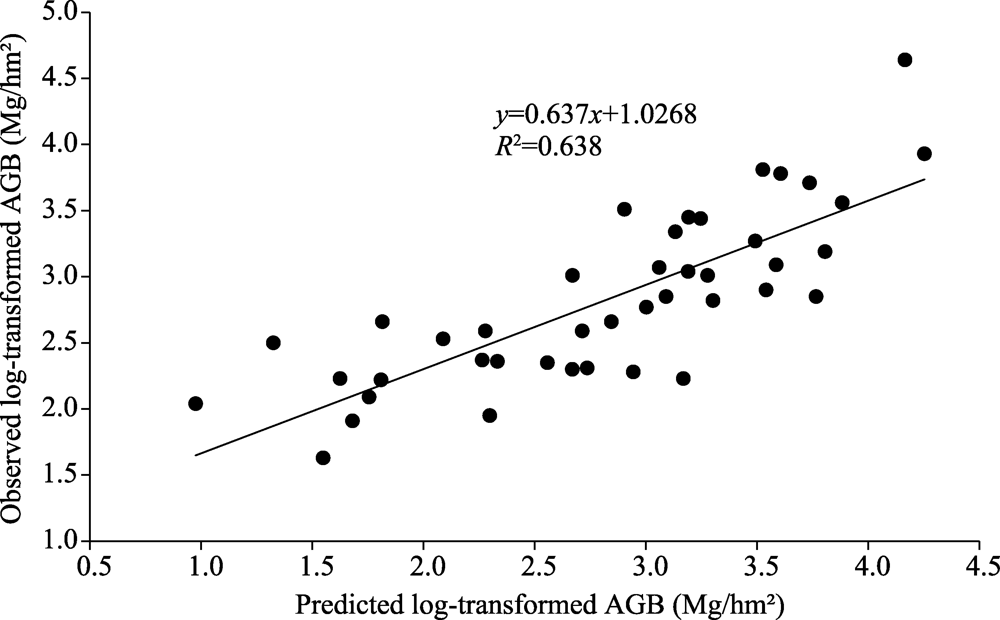
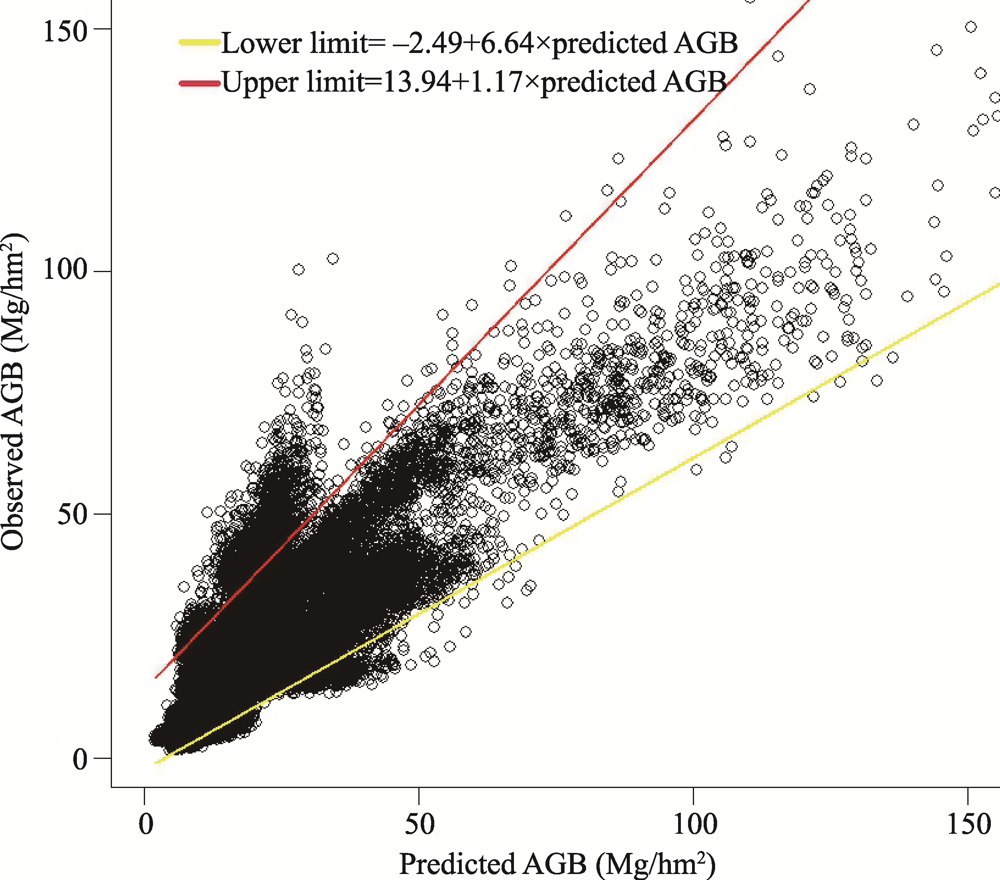
Abstract The quantification of carbon storage in vegetation biomass is a crucial factor in the estimation and mitigation of CO2 emissions. Globally, arid and semi-arid regions are considered an important carbon sink. However, they have received limited attention and, therefore, it should be a priority to develop tools to quantify biomass at the local and regional scales. Individual plant variables, such as stem diameter and crown area, were reported to be good predictors of individual plant weight. Stand-level variables, such as plant cover and mean height, are also easy-to-measure estimators of above-ground biomass (AGB) in dry regions. In this study, we estimated the AGB in semi-arid woody vegetation in Northeast Patagonia, Argentina. We evaluated whether the AGB at the stand level can be estimated based on plant cover and to what extent the estimation accuracy can be improved by the inclusion of other field-measured structure variables. We also evaluated whether remote sensing technologies can be used to reliably estimate and map the regional mean biomass. For this purpose, we analyzed the relationships between field-measured woody vegetation structure variables and AGB as well as LANDSAT TM-derived variables. We obtained a model-based ratio estimate of regional mean AGB and its standard error. Total plant cover allowed us to obtain a reliable estimation of local AGB, and no better fit was attained by the inclusion of other structure variables. The stand-level plant cover ranged between 18.7% and 95.2% and AGB between about 2.0 and 70.8 Mg/hm2. AGB based on total plant cover was well estimated from LANDSAT TM bands 2 and 3, which facilitated a model-based ratio estimate of the regional mean AGB (approximately 12.0 Mg/hm2) and its sampling error (about 30.0%). The mean AGB of woody vegetation can greatly contribute to carbon storage in semi-arid lands. Thus, plant cover estimation by remote sensing images could be used to obtain regional estimates and map biomass, as well as to assess and monitor the impact of land-use change on the carbon balance, for arid and semi-arid regions.
|
|
Received: 07 April 2021
Published: 10 September 2021
|
|
Corresponding Authors:
*Silvia S TORRES ROBLES (storresr@unrn.edu.ar)
|
|
|
| [1] |
Baccini A, Laporte N, Goetz S J, et al. 2008. A first map of tropical Africa's above-ground biomass derived from satellite imagery. Environmental Research Letters, 3(4):045011, Doi: 10.1088/1748-9326/3/4/045011.
doi: 10.1088/1748-9326/3/4/045011
|
|
|
| [2] |
Bertiller M B, Bisigato A J, Carrera A L, et al. 2004. Structure of the vegetation and functioning of the ecosystems of Monte Chubutense. Bulletin of the Argentine Botanical Society, 39(3‒4): 139‒158. (in Spanish)
|
|
|
| [3] |
Burnham K P, Anderson D R. 2002. Model Selection and Multimodel Inference: A Practical Information‒Theoretic Approach. New York, NY: Springer, 261‒303.
|
|
|
| [4] |
Cartus O, Kellndorfer J, Walker W, et al. 2014. A national, detailed map of forest aboveground carbon stocks in Mexico. Remote Sensing, 6(6): 5559‒5588.
doi: 10.3390/rs6065559
|
|
|
| [5] |
Chave J, Andalo C, Brown S, et al. 2005. Tree allometry and improved estimation of carbon stocks and balance in tropical forests. Oecologia, 145(1):87-99.
pmid: 15971085
|
|
|
| [6] |
Chen W, Cao C X, He Q S, et al. 2010. Quantitative estimation of the shrub canopy LAI from atmosphere‒corrected HJ‒1 CCD data in Mu Us Sandland. Science China Earth Sciences, 53: 26‒33.
doi: 10.1007/s11430-010-4127-4
|
|
|
| [7] |
Chen W, Zhao J, Cao C, et al. 2018. Shrub biomass estimation in semi-arid sandland ecosystem based on remote sensing technology. Global Ecology and Conservation, 16:e00479, doi: 10.1016/j.gecco.2018.e00479.
doi: 10.1016/j.gecco.2018.e00479
|
|
|
| [8] |
Chen Y, Gillieson D. 2009. Evaluation of Landsat TM vegetation indices for estimating vegetation cover on semi-arid rangelands: A case study from Australia. Canadian Journal of Remote Sensing, 35(5):435-446.
doi: 10.5589/m09-037
|
|
|
| [9] |
Chojnacky D C, Milton M. 2008. Measuring carbon in shrubs. In: Hoover C M. Field measurements for forest carbón monitoring. New York: Springer, 45‒72.
|
|
|
| [10] |
Conti G, Enrico L, Casanoves F, et al. 2013. Shrub biomass estimation in the semiarid Chaco forest: A contribution to the quantification of an underrated carbon stock. Annals of Forest Science, 70:515-524.
doi: 10.1007/s13595-013-0285-9
|
|
|
| [11] |
Conti G, Gorné L D, Zeballos S R, et al. 2019. Developing allometric models to predict the individual aboveground biomass of shrubs worldwide. Global Ecology and Biogeography, 28(7): 961‒975.
doi: 10.1111/geb.12907
|
|
|
| [12] |
Dengsheng L. 2006. The potential and challenge of remote sensing-based biomass estimation, International Journal of Remote Sensing, 27(7):1297-1328
doi: 10.1080/01431160500486732
|
|
|
| [13] |
di Gregorio A, Jansen L J M. 2000. Land Cover Classification System (LCCS): classification concepts and user manual. FAO/UNEP/Cooperazione Italiana, Rome, 20‒31.
|
|
|
| [14] |
di Rienzo J A, Casanoves F, Balzarini M G, et al. 2016. InfoStat Versión 2016. Grupo InfoStat, FCA, National University of Córdoba, Argentina. http://www.infostat.com.ar.
|
|
|
| [15] |
Dong J, Kaufmann R K, Myneni R B, et al. 2003. Remote sensing estimates of boreal and temperate forest woody biomass: carbon pools, sources, and sinks. Remote Sensing of Environment, 84(3):393-410.
doi: 10.1016/S0034-4257(02)00130-X
|
|
|
| [16] |
Eisfelder C, Kuenzer C, Dech S. 2012. Derivation of biomass information for semi-arid areas using remote-sensing data. International Journal of Remote Sensing, 33(9):2937-2984.
doi: 10.1080/01431161.2011.620034
|
|
|
| [17] |
Fensholt R, Langanke T, Rasmussen K, et al. 2012. Greenness in semi-arid areas across the globe 1981‒2007—an Earth Observing Satellite based analysis of trends and drivers. Remote Sensing of Environment, 121: 144‒158.
doi: 10.1016/j.rse.2012.01.017
|
|
|
| [18] |
Flombaum P, Sala O E. 2007. Cover is a good predictor of aboveground biomass in arid systems. Journal of Arid Environments, 73(6):597-598.
doi: 10.1016/j.jaridenv.2009.01.017
|
|
|
| [19] |
Foley J A, DeFries R, Asner G P, et al. 2005. Global consequences of land use. Science, 309(5734): 570‒574.
doi: 10.1126/science.1111772
|
|
|
| [20] |
Fonseca W G, Alice F G, Rey J M. 2009. Models to estimate the biomass of native species in plantations and secondary forests in the Caribbean zone of Costa Rica. Bosque, 30(1): 36‒47. (in Spanish)
|
|
|
| [21] |
Fusco E J, Rau B M, Falkowski M, et al. 2019. Accounting for aboveground carbon storage in shrubland and woodland ecosystems in the Great Basin. Ecosphere, 10(8):e02821, doi: 10.1002/ecs2.2821.
doi: 10.1002/ecs2.2821
|
|
|
| [22] |
Gabella J, Campo A M. 2016. Fragility and environmental degradation in rural areas of the temperate arid Argentinian diagonal. Estudios Geográficos, 77 (281): 491‒519. (in Spanish)
doi: 10.3989/egeogr.2016.i281
|
|
|
| [23] |
Galidaki G, Zianis D, Gitas I, et al. 2017. Vegetation biomass estimation with remote sensing: focus on forest and other wooded land over the Mediterranean ecosystem. International Journal of Remote Sensing, 38(7): 1940‒1966.
doi: 10.1080/01431161.2016.1266113
|
|
|
| [24] |
Gasparri N I, Parmuchi M G, Bono J, et al. 2010. Assessing multi‒temporal Landsat 7 ETM+ images for estimating above‒ground biomass in subtropical dry forests of Argentina. Journal Arid Environments, 74(10):1262-1270.
doi: 10.1016/j.jaridenv.2010.04.007
|
|
|
| [25] |
Gasparri N I, Baldi G. 2013. Regional patterns and controls of biomass in semiarid woodlands: lessons from the Northern Argentina Dry Chaco. Regional Environmental Change, 13(6):1131-1144.
doi: 10.1007/s10113-013-0422-x
|
|
|
| [26] |
Gasparri N I, Grau H R, Gutierrez‒Angonese J. 2013. Linkages between soybean and neotropical deforestation: Coupling and transient decoupling dynamics in a multi‒decadal analysis. Global Environmental Change‒Human and Policy Dimensions, 23(6):1605-1614.
|
|
|
| [27] |
Godagnone R E, Bran D E. 2009. Integrated inventory of the natural resources of the province of Río Negro. Buenos Aires:INTA, 319-363. (in Spanish)
|
|
|
| [28] |
González‒Iturbe Ahumada J A. 2004. Introduction to remote sensing: sampling techniques for natural resource managers. Mexico: Autonomous University of Mexico, Autonomous University of Yucatán National Council of Science and Technology, and National Institute of Ecology, 455‒471. (in Spanish)
|
|
|
| [29] |
González‒Roglich M, Swenson J. 2016. Tree cover and carbon mapping of Argentine savannas: Scaling from field to region. Remote Sensing of Environment, 172:139-147.
doi: 10.1016/j.rse.2015.11.021
|
|
|
| [30] |
Grainger A. 1999. Constraints on modelling the deforestation and degradation of tropical open woodlands. Global Ecology and Biogeography, 8: 179‒190.
|
|
|
| [31] |
Gregoire T G, Salas C. 2009. Ratio estimation with measurement error in the auxiliary variate. Biometrics, 65(2): 590‒598.
doi: 10.1111/j.1541-0420.2008.01110.x
pmid: 18759838
|
|
|
| [32] |
Grünzweig J M, Lin T, Rotenberg E, et al. 2003. Carbon sequestration in arid-land forest. Global Change Biology, 9(5):791-799.
doi: 10.1046/j.1365-2486.2003.00612.x
|
|
|
| [33] |
GTOS. 2010. A framework for terrestrial climate-related observations and development of standards for the terrestrial essential climate variables: proposed work plan [2016-11-20]. http://www.fao.org/gtos/doc/pub78.pdf. .
|
|
|
| [34] |
Hansen M C, Potapov P V, Moore R, et al. 2013. High-resolution global maps of 21st-century forest cover change. Science, 342(6160):850-853.
doi: 10.1126/science.1244693
pmid: 24233722
|
|
|
| [35] |
Hengeveld G M, Didion M, Clerkx S, et al. 2015. The landscape-level effect of individual‒owner adaptation to climate change in Dutch forests. Regional Environmental Change, 15:1515-1529.
doi: 10.1007/s10113-014-0718-5
|
|
|
| [36] |
Hierro J L, Branch L C, Villarreal D, et al. 2000. Predictive equations for biomass and fuel characteristics of Argentine shrubs. Journal of Range Management, 53: 617‒621.
doi: 10.2307/4003156
|
|
|
| [37] |
Hofstad O. 2005. Review of biomass and volume functions for individual trees and shrubs in southeast Africa. Journal of Tropical Forest Science, 17(1):151-162.
|
|
|
| [38] |
Houghton R A. 2005. Aboveground forest biomass and the global carbon balance. Global Change Biology, 11(6):945-958.
doi: 10.1111/gcb.2005.11.issue-6
|
|
|
| [39] |
Houghton R A. 2007. Balancing the global carbon budget. Annual Review of Earth and Planetary Sciences, 35:313-347.
doi: 10.1146/earth.2007.35.issue-1
|
|
|
| [40] |
Huete A R. 1988. A soil‒adjusted vegetation index (SAVI). Remote Sensing of Environment, 25:295-309.
doi: 10.1016/0034-4257(88)90106-X
|
|
|
| [41] |
Huete A, Didan K, Miura T, et al. 2002. Overview of the radiometric and biophysical performance of the MODIS vegetation indices. Remote Sensing of Environment, 83(1‒2): 195‒213.
doi: 10.1016/S0034-4257(02)00096-2
|
|
|
| [42] |
Issa S M, Dahy B S, Saleous N. 2020. Accurate mapping of date palms at different age-stages for the purpose of estimating their biomass. Annals of the Photogrammetry, Remote Sensing and Spatial Information Sciences, Volume 3. XXIVth International Society for Photogrammetry and Remote Sensing Congress. 4 July‒10 July 2021. Nice, France, 461‒467.
|
|
|
| [43] |
Jenkins J C, Chojnacky D C, Heath L S, et al. 2004. Comprehensive database of diameter‒based biomass regressions for North American trees species. Delaware: US Department of Agriculture, Forest Service and Northeastern Research Station, 1‒45.
|
|
|
| [44] |
Kangas A, Maltamo M. 2006. Forest Inventory: Methodology & Applications. Berlin: Springer, 357.
|
|
|
| [45] |
Kaufman Y J. 1989 The atmospheric effect on remote sensing and its correction. In: Asrar G. Theory and Application of Optical Remote Sensing. New York: Wiley Publication, 336‒428.
|
|
|
| [46] |
Kindermann G, Obersteiner M, Sohngen B, et al. 2008. Global cost estimates of reducing carbon emissions through avoided deforestation. Proceedings of the National Academy of Sciences, 105(30): 10302‒10307.
|
|
|
| [47] |
León R J C, Bran D, Collantes M, et al. 1998. Mean vegetation units of extra-Andean Patagonia. Austral Ecology, 8: 125‒144. (in Spanish)
|
|
|
| [48] |
Le Polain de Waroux Y, Lambin E F. 2012. Monitoring degradation in arid and semi-arid forests and woodlands: the case of the argan woodlands (Morocco). Applied Geography, 32(2): 777-786.
doi: 10.1016/j.apgeog.2011.08.005
|
|
|
| [49] |
Lopez Serrano P M, Cárdenas Domínguez J L, Corral‒Rivas J J, et al. 2020. Modeling of aboveground biomass with landsat 8 oli and machine learning in temperate forests. Forests, 11(1): 11, https://doi:10.3390/f11010011.
doi: 10.3390/f11010011
|
|
|
| [50] |
Mageto T, Motubwa J. 2018. Bootstrap confidence interval for model based sampling. American Journal of Theoretical and Applied Statistics, 7(4): 147-155.
doi: 10.11648/j.ajtas.20180704.13
|
|
|
| [51] |
Malagnoux M, Sène E H, Atzmon N. 2007. Forests, trees and water in arid lands: a delicate balance. Unasylva, 58: 24‒29.
|
|
|
| [52] |
Morello J, Matteucci S D, Rodríguez A F, et al. 2012. Argentine ecoregions and ecosystem complexes. Buenos Aires: Graphic Orientation, 309-347. (in Spanish)
|
|
|
| [53] |
Navone S M. 2003. Remote Sensors Applied to the Study of Natural Resources. Buenos Aires: Faculty of Agronomy, University of Buenos Aires, 81‒95. (in Spanish)
|
|
|
| [54] |
Nosetto M D, Jobbágy E G, Paruelo J M. 2006. Carbon sequestration in semi-arid rangelands: Comparison of Pinus ponderosa plantations and grazing exclusion in NW Patagonia. Journal Arid Environments, 67(1): 142‒156.
doi: 10.1016/j.jaridenv.2005.12.008
|
|
|
| [55] |
Oñatibia G R, Aguiar M R, Cipriotti P A, et al. 2010. Individual plant and population biomass of dominant shrubs in Patagonian grazed fields. Ecología Austral, 20: 269‒279.
|
|
|
| [56] |
Oyarzabal M, Clavijo J, Oakley L, et al. 2018. Vegetation units of Argentina. Austral Ecology, 28: 040‒063 (in Spanish)
|
|
|
| [57] |
Pearce H G, Anderson W R, Fogarty L G, et al. 2010. Linear mixed‒effects models for estimating biomass and fuel loads in shrublands. Canadian Journal of Forest Research, 40(10): 2015‒2026.
doi: 10.1139/X10-139
|
|
|
| [58] |
Peri P L. 2011 Carbon storage in cold temperate ecosystems in Southern Patagonia, Argentina. In: Islam Atazadeh. Biomass and Remote Sensing of Biomass. London, In Tech, 213‒225.
|
|
|
| [59] |
Pordel F, Ebrahimi A, Azizi Z. 2018. Canopy cover or remotely sensed vegetation index, explanatory variables of above-ground biomass in an arid rangeland, Iran. Journal Arid Land, 10(5):767-780.
doi: 10.1007/s40333-018-0017-y
|
|
|
| [60] |
Roig F A, Roig‒Juñent S, Corbalán V. 2009. Biogeography of the Monte Desert. Journal of Arid Environments, 73(2):164-172.
doi: 10.1016/j.jaridenv.2008.07.016
|
|
|
| [61] |
Rouse J W, Haas H R, Deering D W, et al. 1974. Monitoring the vernal advancement and retrogradation (green wave effect) of natural vegetation. NASA/GSFC Type III Final Report, Greenbelt,Md, 371.
|
|
|
| [62] |
Saatchi S S, Harris N L, Brown S, et al. 2011. Benchmark map of forest carbon stocks in tropical regions across three continents. Proceedings of the National Academy of Sciences, 108(24):9899-9904.
|
|
|
| [63] |
Sankarán N M, Hanan N P, Scholes R J, et al. 2005. Determinants of woody cover in African savannas. Nature, 438(7069):846-849.
doi: 10.1038/nature04070
|
|
|
| [64] |
Shoshany M, Karnibad L. 2015. Remote sensing of shrubland drying in the south‒east Mediterranean, 1995-2010: Water‒Use‒Efficiency‒Based mapping of biomass change. Remote Sensor, 7(3):2283-2301.
|
|
|
| [65] |
Ståhl G, Saarela S, Schnell S, et al. 2016. Use of models in large‒area forest surveys: comparing model‒assisted, model‒based and hybrid estimation. Forest Ecosystems, 3(5):1-11.
doi: 10.1186/s40663-016-0060-0
|
|
|
| [66] |
Torres Robles S S, Arturi M, Contreras C, et al. 2015. Geographical variations of the structure and composition of the woody vegetation in the limit between the spinal and the mount in the Northeast of Patagonia (Argentina). Bulletin of the Argentine Botanical Society, 50(2):209-215 (in Spanish)
|
|
|
| [67] |
Yan F, Wu B, Wang Y. 2013. Estimating aboveground biomass in Mu Us Sandy Land using Landsat spectral derived vegetation indices over the past 30 years. Journal Arid Land, 5:521-530.
doi: 10.1007/s40333-013-0180-0
|
|
|
| [68] |
Zeberio J M, Torres Robles S, Calabrese G M. 2018. Land use and conservation status of the woody vegetation of the Monte in the Northeast of Patagonia. Austral Ecology, 28: 543‒552. (in Spanish)
|
|
|
| [69] |
Zeberio J M, Pérez C A. 2020. Rehabilitation of degraded areas in northeastern Patagonia, Argentina: Effects of environmental conditions and plant functional traits on performance of native woody species. Journal of Arid Land, 12: 653‒665.
doi: 10.1007/s40333-020-0021-x
|
|
|
| [70] |
Zhang W, Brandt M, Wang Q, et al. 2019. From woody cover to woody canopies: How Sentinel‒1 and Sentinel‒2 data advance the mapping of woody plants in savannas. Remote Sensing of Environment, 234:111465, doi: 10.1016/j.rse.2019.111465.
doi: 10.1016/j.rse.2019.111465
|
|
|
| [71] |
Zivkovic L, Martínez Carretero E, Dalmasso A, et al. 2013. Carbon accumulated in the plant biomass of the Villavicencio reserve (Mendoza ‒ Argentina). Bulletin of the Argentine Botanical Society, 48(3‒4): 543‒551. (in Spanish)
|
|
|
|
Viewed |
|
|
|
Full text
|
|
|
|
|
Abstract
|
|
|
|
|
Cited |
|
|
|
|
| |
Shared |
|
|
|
|
| |
Discussed |
|
|
|
|