Please wait a minute...
Journal of Arid Land  2021, Vol. 13 Issue (12): 1260-1273    DOI: 10.1007/s40333-021-0026-0
Original article     
Mass balance of saline lakes considering inflow loads of rivers and groundwater: the case of Lake Issyk- Kul, Central Asia
Kei SAITOH1,*(), Rysbek SATYLKANOV2, Kenji OKUBO3
1Beppu Geothermal Research Laboratory, Institute for Geothermal Sciences, Graduate School of Science, Kyoto University, Oita 8740903, Japan
2Tien Shan High Mountain Research Center, Institute of Water Problem and Hydropower of National Academy of Sciences of Kyrgyz Republic, Bishkek 720033, Kyrgyzstan
3Graduate School of Environmental and Life Science, Okayama University, Okayama 7008530, Japan
Download: HTML     PDF(1155KB)
Export: BibTeX | EndNote (RIS)      

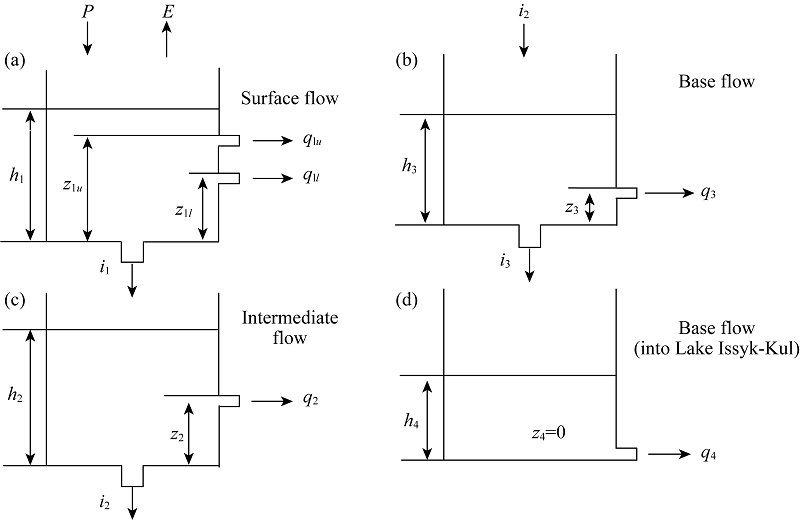
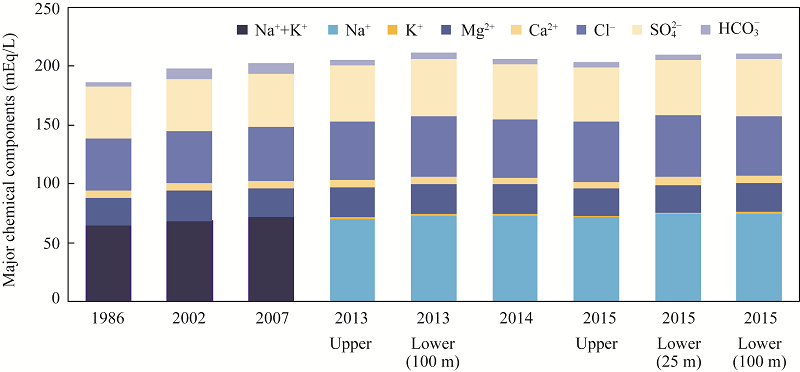
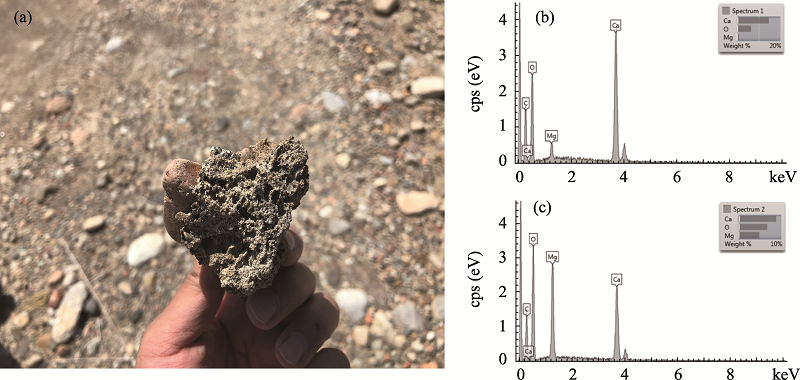
Abstract  

This study aimed to elucidate the influence of inflow water on the salinity concentration process of a saline lake and the mass balance of Lake Issyk-Kul, a tectonic saltwater lake in Kyrgyzstan. Based on the survey results and meteorological data from 2012 to 2015, we analyzed the dissolved chemical composition loads due to water inflow. Then, we discussed the relationship between the increase in salinity and water inflow into the lake. Through the water quality analysis data, we used the tank model to estimate the river inflow and analyze the loads by the L-Q curve. The groundwater loads were then estimated from the average annual increase in salinity of the lake over a period of 30 a. The results suggest that Lake Issyk-Kul was temporarily freshened between about AD 1500 and 1800 when an outflowing river existed, and thereafter, it became a closed lake in AD 1800 and continued to remain a saline lake until present. The chemical components that cause salinization are supplied from the rivers and groundwater in the catchment area, and when they flow into the lake, Ca2+, HCO3- and Mg2+ precipitate as CaCO3 and MgCO3. These compounds were confirmed to have been left on the lakeshore as evaporite. The model analysis showed that 1.67 mg/L of Ca2+ and Mg2+ supplied from rivers and groundwater are precipitated as evaporite and in other forms per year. On the other hand, salinity continues to remain in the lake water at a rate of 27.5 mg/L per year. These are the main causes of increased salinity in Lake Issyk-Kul. Since Na+ and Cl- are considered to be derived from geothermal water, they will continue to flow in regardless of the effects of human activities. Therefore, as long as these components are accumulated in Lake Issyk-Kul as a closed lake, the salinity will continue to increase in the future.


Key wordsgroundwater      geothermal water      mass balance      salinity      saline lake      L-Q curve     
Received: 26 August 2021      Published: 10 December 2021
Corresponding Authors: Kei SAITOH     E-mail: saitoh.k@bep.vgs.kyoto-u.ac.jp
Cite this article:

Kei SAITOH, Rysbek SATYLKANOV, Kenji OKUBO. Mass balance of saline lakes considering inflow loads of rivers and groundwater: the case of Lake Issyk- Kul, Central Asia. Journal of Arid Land, 2021, 13(12): 1260-1273.

URL:

http://jal.xjegi.com/10.1007/s40333-021-0026-0     OR     http://jal.xjegi.com/Y2021/V13/I12/1260

Fig. 1 Study area of Lake Issyk-Kul and survey sites of water samples during the period 2012-2015 (Adapted and modified from Saitoh (2019), and Saitoh and Kodera (2019))
Fig. 2 Overview of the tank model. P, precipitation; E, evaporation; hi is the water depth in the tank (storage height; mm); zi is the height to the side hole (mm); ii and qi are the leachate and discharge (mm/d), respectively.
Fig. 3 Correlation between loads and flows in three (Ka-dzhi-Say, Cholpon-Ata and Karakol) catchment rivers. Original correlation (a) when exponent p is 1 (b).
Fig. 4 Variation in the major chemical components in Lake Issyk-Kul over time (Adapted and modified from Saitoh (2019)). HCO3- from 1986 to 2007 is based on conversion from alkalinity. Upper indicates the surface layer of the lake, and lower indicates the deep water layer of the lake.
Fig. 5 Changes of water level in Lake Issyk-Kul over the past 700 a (Adapted and modified from Romanovsky et al. (2002); Fukushima (2006); Narama (2012); Romanovsky et al. (2013))
Parameter TDS Na+ K+ Ca2+ Mg2+ Cl- HCO3- SO42 -
k (m3/s) 159.000 4.62 1.41 32.100 3.54 3.39 89.000 19.800
γ (m3/s) 143.025 1266.82 130.15 12.273 281.55 1926.95 9.778 399.555
Table 1 Numerical values of parameters used in the L-Q curve
Index Unit Kadzhi-Say
(South)
Cholpon-Ata
(North)
Karakol
(East)
Lake Issyk-Kul
(Estimation)
Lake Issyk-Kul
Drainage area km2 6272 3925 5608 - 6236
Precipitation mm/a 387 424 306 279 280
Evaporation mm/a 894 749 823 822 814
River water km3/a 0.55 0.38 0.41 1.34 1.30
Groundwater km3/a 0.82 0.51 0.74 2.07 2.06
rE=ΣE/ΣP 2.31 1.77 2.69 2.94 2.91
rGQgQr 1.49 1.35 1.80 1.55 1.59
TDS loads t/a 18,777,919 11,757,177 16,778,616 47,313,711 -
Na+ loads t/a 4,816,807 3,014,545 4,306,999 12,138,351 -
K+ loads t/a 151,817 95,060 135,642 382,519 -
Ca2+ loads t/a 332,681 209,352 294,866 836,899 -
Mg2+ loads t/a 821,432 514,186 734,260 2,069,877 -
Cl- loads t/a 5,369,811 3,360,571 4,801,622 13,532,004 -
HCO3- loads t/a 764,929 481,996 676,536 1,923,461 -
SO42 - loads t/a 6,520,286 4,081,152 5,829,042 16,430,480 -
ΔH mm/a 218 227 205 107 110
ΔTDS g/m3 10.80 6.80 9.70 27.20 27.50
ΔNa+ g/m3 2.77 1.73 2.48 6.98 6.62
ΔK+ g/m3 0.09 0.05 0.08 0.22 -
ΔCa2+ g/m3 0.19 0.12 0.17 0.48 -0.24
ΔMg2+ g/m3 0.47 0.30 0.42 1.19 -0.23
ΔCl- g/m3 3.09 1.93 2.76 7.79 8.08
ΔHCO3- g/m3 0.44 0.28 0.39 1.11 8.56
ΔSO42 - g/m3 3.75 2.35 3.35 9.45 4.27
Table 2 Influent river and groundwater loads and water balance of Lake Issyk-Kul
Fig. 6 (a), evaporite found along the southern coast of Lake Issyk-Kul (photo by the author, August 2018); (b and c), energy-dispersive X-ray spectroscopy measurement of a rock-cut surface (courtesy of Dr. Tomokazu HOKADA, National Institute of Polar Research, Japan). In Figure 6b and c, cps (eV) is the counts of eV per second, eV is the energy, and k is the kilo.
No. Area
(km2)
Date
(yyyy-mm-dd)
Time
(LST)
Na+
(mg/L)
K+
(mg/L)
Ca2+
(mg/L)
Mg2+
(mg/L)
Cl-
(mg/L)
HCO3-
(mg/L)
SO42 -
(mg/L)
NO3-
(mg/L)
TDS
(mg/L)
R1 2.56 2012-08-31 09:53 9.11 1.98 47.9 5.56 4.51 145.0 22.6 1.17 238.0
R2 13.60 2012-08-31 10:12 6.86 2.03 41.3 4.46 4.13 119.0 20.4 - 199.0
R3 10.70 2012-08-31 11:30 1.48 1.07 19.1 1.62 1.02 56.8 4.8 1.88 87.8
R5 49.00 2012-08-31 17:30 3.72 1.22 27.2 2.61 1.98 78.1 12.1 2.19 129.0
R11 59.90 2012-08-31 18:27 4.16 0.84 22.2 2.90 1.71 65.1 14.5 1.40 113.0
R13 1207.00 2012-08-31 19:00 8.87 1.04 53.2 6.17 5.99 153.0 28.5 1.92 259.0
R14 2147.00 2012-08-31 19:30 7.12 1.59 39.4 4.19 4.59 112.0 20.4 2.64 192.0
R16 394.00 2012-09-02 11:55 1.07 0.68 12.6 1.18 1.08 23.4 15.9 1.80 57.7
R17 497.00 2012-09-02 13:20 1.33 0.70 14.9 1.71 1.27 31.8 13.7 1.80 67.1
R18 548.00 2012-09-02 15:50 2.33 0.97 27.0 3.75 1.73 56.1 23.2 1.66 117.0
R19 627.00 2012-09-02 17:10 2.33 1.51 31.9 5.18 1.97 71.0 45.7 2.03 162.0
R21 146.00 2012-09-03 08:45 1.96 0.76 27.1 4.35 1.54 69.3 33.0 1.91 140.0
R23 324.00 2012-09-03 09:10 4.84 1.32 25.2 2.78 3.70 68.3 28.8 1.21 136.0
R24 805.00 2012-09-03 11:45 5.44 1.93 40.2 5.36 3.35 119.0 20.1 2.99 199.0
R27 592.00 2012-09-03 12:45 5.40 1.37 36.4 7.18 4.11 103.0 30.4 - 187.0
R1 2.56 2013-08-24 09:20 8.41 1.76 41.6 5.37 3.91 121.0 32.4 0.65 215.0
R4 31.20 2013-08-26 14:00 4.87 1.47 24.0 2.90 3.45 68.8 18.9 2.41 127.0
R5 49.00 2013-08-26 14:30 2.60 1.16 20.5 1.69 1.38 58.6 11.3 1.90 99.1
R7 371.00 2013-08-26 14:50 2.63 1.11 21.7 1.77 1.37 64.7 11.5 2.15 107.0
R11 59.90 2013-08-26 15:40 3.90 1.29 25.8 3.73 1.52 73.2 26.9 1.15 138.0
G2 - 2013-08-26 16:00 36.40 1.93 43.1 6.38 29.00 127.0 49.2 5.94 299.0
R13 1207.00 2013-08-26 16:30 8.49 1.58 52.9 6.58 6.34 149.0 33.0 1.50 259.0
G4 - 2013-08-26 17:40 48.70 20.30 81.3 41.9 54.4 215.0 180.0 104.00 746.0
R14 2147.00 2013-08-26 19:20 5.32 1.38 34.1 3.85 3.69 101.0 19.4 2.50 172.0
R16 394.00 2013-08-27 12:00 2.15 1.37 25.4 2.71 1.19 75.9 18.7 1.97 129.0
R17 497.00 2013-08-27 12:45 5.83 1.14 28.4 3.45 8.92 82.0 18.2 2.05 150.0
R18 548.00 2013-08-27 13:15 2.78 1.22 29.9 4.05 2.05 83.9 24.8 2.13 151.0
R19 627.00 2013-08-27 13:40 3.19 1.37 39.0 7.18 2.78 90.9 53.3 2.81 201.0
R21 146.00 2013-08-27 15:00 2.53 1.10 19.7 1.90 2.01 59.0 6.1 2.21 94.4
R23 324.00 2013-08-28 09:15 4.86 1.80 26.8 3.23 3.15 76.9 17.2 2.14 136.0
R24 805.00 2013-08-30 07:20 4.35 1.59 33.5 4.84 2.52 92.5 27.1 3.00 170.0
R27 592.00 2013-08-30 08:30 9.40 2.52 59.5 13.3 7.33 175.0 53.2 1.48 321.0
R0 0.78 2014-08-21 10:15 43.30 3.72 117.0 15.5 39.60 322.0 96.5 24.40 661.0
R4 31.20 2014-08-22 10:00 7.96 1.73 35.2 3.02 5.52 102.0 15.7 2.45 173.0
R5 49.00 2014-08-22 10:27 3.10 1.40 28.2 1.72 1.75 78.5 17.7 2.97 135.0
R6 371.00 2014-08-22 10:40 3.72 1.71 28.6 1.80 4.84 76.8 19.5 3.08 140.0
R7 371.00 2014-08-22 11:00 3.67 1.13 28.7 2.31 2.18 80.3 15.1 3.75 137.0
R11 59.90 2014-08-22 11:50 8.89 1.61 49.2 4.86 5.73 142.0 27.0 2.60 242.0
G2 2014-08-22 12:00 38.00 1.72 50.2 5.74 30.20 150.0 37.6 6.09 320.0
R13 1207.00 2014-08-22 12:20 14.10 1.58 61.5 7.24 10.00 168.0 43.1 2.51 308.0
R14 2147.00 2014-08-22 12:55 10.80 1.55 51.5 4.26 6.67 153.0 30.3 3.36 262.0
R16 394.00 2014-08-23 10:15 2.18 1.35 29.5 2.27 1.17 70.4 20.5 2.65 130.0
No. Area
(km2)
Date
(yyyy-mm-dd)
Time
(LST)
Na+
(mg/L)
K+
(mg/L)
Ca2+
(mg/L)
Mg2+
(mg/L)
Cl-
(mg/L)
HCO3-
(mg/L)
SO42 -
(mg/L)
NO3-
(mg/L)
TDS
(mg/L)
R18 548.00 2014-08-24 11:15 3.46 1.44 38.3 3.58 2.67 84.7 31.1 2.62 168.0
R19 627.00 2014-08-24 11:45 4.23 1.65 49.9 6.06 3.83 101.0 54.5 2.10 223.0
R21 146.00 2014-08-24 12:35 3.09 1.09 40.2 5.45 2.14 90.6 42.4 3.36 188.0
R22 145.00 2014-08-24 12:50 4.28 1.81 35.9 3.02 2.69 109.0 9.9 3.30 170.0
R23 324.00 2014-08-24 13:10 9.12 2.26 39.3 3.51 6.72 124.0 11.3 3.51 199.0
R26 725.00 2014-08-24 14:10 13.80 3.93 71.0 12.7 11.20 192.0 58.4 6.56 370.0
R27 592.00 2014-08-24 15:40 9.79 3.59 56.1 8.35 5.59 169.0 32.8 13.80 299.0
R4 31.20 2015-08-22 10:02 4.00 1.70 30.3 4.87 6.14 83.5 16.9 1.99 149.0
R5 49.00 2015-08-22 10:15 3.14 1.27 24.6 3.27 1.01 86.5 5.6 1.80 127.0
R6 371.00 2015-08-22 10:33 4.57 0.95 19.9 2.60 2.19 70.2 6.8 1.82 109.0
R7 371.00 2015-08-22 10:55 3.38 1.52 22.9 2.42 1.85 62.8 16.7 1.82 113.0
R8 231.00 2015-08-22 11:08 2.55 1.21 21.1 1.92 1.78 58.4 14.7 2.08 104.0
R9 111.00 2015-08-22 11:27 3.23 1.14 21.9 2.80 1.42 64.6 13.9 1.91 111.0
R10 97.10 2015-08-22 11:52 1.64 0.51 19.4 2.20 1.86 60.5 9.1 1.76 97.0
R11 59.90 2015-08-22 12:06 3.23 0.84 24.1 3.37 1.72 78.3 11.1 1.37 124.0
G2 2015-08-22 12:36 44.40 2.08 41.3 7.26 15.50 184.0 31.4 5.43 331.0
R12 67.70 2015-08-22 12:46 3.80 0.70 19.5 1.78 2.34 64.5 4.1 1.70 98.3
R13 1207.00 2015-08-22 13:07 13.50 1.66 52.7 7.19 11.20 193.0 37.2 1.08 318.0
R14 2147.00 2015-08-22 14:03 6.69 0.70 33.7 3.45 9.37 99.6 19.5 0.91 174.0
G7 2015-08-23 11:47 24.60 0.23 88.3 13.00 25.80 243.0 57.9 0.00 452.0
G6 2015-08-23 12:00 29.10 0.64 43.5 7.39 23.30 167.0 36.9 5.98 314.0
G3 2015-08-23 14:33 12.60 0.11 40.4 4.32 7.66 119.0 21.8 3.77 210.0
G5 2015-08-23 14:56 151.00 16.60 90.0 24.40 125.00 237.0 227.0 0.00 871.0
G4 2015-08-23 15:20 69.30 10.40 160.0 48.30 91.20 323.0 204.0 201.00 1107.0
R15 138.00 2015-08-23 15:42 13.20 5.14 61.6 10.60 8.22 230.0 34.1 3.59 366.0
G9 2015-08-25 11:11 7.52 1.16 33.4 0.02 4.07 84.3 24.4 2.10 157.0
G8 2015-08-25 11:37 13.00 1.85 71.0 9.51 10.70 277.0 15.8 3.37 402.0
G10 2015-08-25 12:48 4.57 0.59 50.7 3.21 4.10 152.0 10.9 1.17 227.0
G11 2015-08-25 13:14 6.46 1.85 43.0 5.17 2.65 110.0 40.8 1.55 211.0
G12 2015-08-25 13:32 119.00 0.46 16.1 0.50 73.30 94.0 116.0 0.00 420.0
R16 394.00 2015-08-26 09:15 2.39 1.42 14.0 3.05 2.46 32.4 20.9 1.61 783.0
G13 2015-08-26 10:00 3265.00 45.00 1977.0 0.00 7898.00 19.7 723.0 1122.00 15,050.0
R17 497.00 2015-08-26 10:45 7.86 1.38 25.6 4.61 11.50 65.0 20.8 1.21 138.0
R18 548.00 2015-08-26 11:05 2.80 1.19 29.8 4.33 2.66 75.4 28.6 1.72 147.0
G14 2015-08-26 11:35 5.76 1.94 35.3 5.50 5.37 85.1 54.0 2.02 195.0
R20 102.00 2015-08-26 11:56 3.45 0.90 23.3 2.17 4.17 63.9 9.7 1.88 109.0
R21 146.00 2015-08-26 12:07 2.27 1.10 20.7 2.20 1.31 54.6 21.7 1.79 106.0
R22 145.00 2015-08-26 13:18 4.09 1.83 28.8 3.78 4.76 97.5 8.7 2.10 152.0
G15 2015-08-26 13:37 39.50 4.30 84.1 16.00 67.30 253.0 47.2 5.85 517.0
R23 324.00 2015-08-26 13:47 6.19 1.75 27.0 3.66 7.00 91.9 9.7 2.28 150.0
R24 805.00 2015-08-27 09:05 4.80 1.19 22.2 2.87 2.81 73.2 6.0 2.74 116.0
G16 2015-08-27 09:15 50.50 2.20 44.4 6.77 21.00 200.0 37.8 1.56 364.0
R25 805.00 2015-08-27 09:27 7.20 3.31 33.6 5.07 8.40 107.0 22.2 1.74 189.0
R26 725.00 2015-08-27 09:48 8.96 2.87 45.5 9.16 4.51 153.0 30.3 1.70 256.0
R27 592.00 2015-08-27 10:17 12.10 2.02 50.2 15.90 6.55 203.0 49.2 1.12 340.0
G1 2015-08-27 13:18 18.30 0.95 55.6 10.80 12.10 190.0 47.7 2.90 338.0
Table S1 Date and time of collection and data of for each site
Direction α1u α1l α2 α3 α4 β1 β2 β3
North 0.03 0.02 0.03 0.01 0.0000012 0.010 0.020 0.005
East 0.03 0.02 0.03 0.01 0.0000012 0.030 0.020 0.010
South 0.03 0.02 0.03 0.01 0.0000012 0.010 0.020 0.001
Table S2 Parameters used in the tank model
[1]   Alifujiang Y, Abuduwaili J, Groll M, et al. 2021. Changes in intra-annual runoff and its response to climate variability and anthropogenic activity in the Lake Issyk-Kul Basin, Kyrgyzstan. CATENA, 198: 104974, doi: 10.1016/j.catena.2020.104974.
doi: 10.1016/j.catena.2020.104974
[2]   Amano A, Kazama S. 2012. Relationship between discharge and nutrient concentration in inundation areas in Cambodia. Journal of Water & Environment Technology, 10(2): 165-175.
[3]   Benduhn F, Renard P. 2019. A dynamic model of the Aral Sea water and salt balance. Journal of Marine Systems, 47(1-4): 35-50.
doi: 10.1016/j.jmarsys.2003.12.007
[4]   Chen X, Liu X, Peng W, et al. 2019. Hydroclimatic influence on the salinity and water volume of a plateau lake in southwest China. Science of the Total Environment, 659: 746-755.
doi: 10.1016/j.scitotenv.2018.12.013
[5]   Eugster H P, Hardie L A. 1978. Saline lakes. In: Lerman A. Physics. Chemistry: Lakes, Geology. Springer-Verlag: New York, 237-293.
[6]   Fukushima Y. 2006. Long-term water level changes in the sky lakes of central Asia Lake Issyk-Kul. Water Science, 49(6): 74-91. (in Japanese)
[7]   Gross M. 2017. The world's vanishing lakes. Current Biology, 27(2): R43-R46.
[8]   International Lake Environment Committee. 2003. World lake database. [2021-10-22]. https://wldb.ilec.or.jp/Lake/ASI-55 .
[9]   Karmanchuk A S. 2002. Water chemistry and ecology of Lake Issyk-Kul. In: Klerkx J, Imanackunov B. Lake Issyk-Kul: Its Natural Environment, NATO Science Series (Series IV: Earth and Environmental Sciences). Springer: Dordrecht, 13-26.
[10]   Kawabata Y, Kurita T, Nagai M, et al. 2014. Water quality in the Lake Issyk-Kul and the river flowing into it. Journal of Arid Land Studies, 24(1): 105-108.
[11]   Korzukhin M D, Kolosov P A, Semenov S M. 2011. Applying Dalton's law of potential evaporation rate over the territory of Russia and neighboring countries using long-term observation data. Russian Meteorology & Hydrology, 36(12): 786-793.
[12]   Lensky N G, Dvorkin Y, Lyakhovsky V, et al. 2005. Water, salt, and energy balances of the Dead Sea. Water Resources Research, 41(12): 1-13.
[13]   Livingston D A. 1963. Chemical composition of rivers and lakes. In: Nolan T B. Data of Geochemistry (6th ed). Washington: U.S. Government Printing Office, G12-G32.
[14]   Meng Q. 2019. Climate change and extreme weather drive the declines of saline lakes: A showcase of the Great Salt Lake. Climate, 7(2): 19.
doi: 10.3390/cli7020019
[15]   Miyazako T, Sugahara S, Tabayashi Y, et al. 2014. Comparison of measured and calculated loads using quadratic LQ equation for Hii River flows, eastern Shimane Prefecture, Japan. Japanese Journal of Limnology, 75(3): 151-159. (in Japanese)
doi: 10.3739/rikusui.75.151
[16]   Mochizuki A, Murata T, Hosoda K, et al. 2018. Distribution of trace elements and the influence of major ion water chemistry in saline lakes. Limnology and Oceanography, 63(3): 1253-1263.
doi: 10.1002/lno.10770
[17]   Narama C. 2012. The natural environment and man in central Eurasia-a millennial history of change and adaptation. In: Narama C. Environmental Change and Humans (Central Eurasian Environmental History). Kyoto: Rinsen Publishing, 288. (in Japanese)
[18]   Ricketts R D, Johnson T C, Brown E T, et al. 2001. The Holocene paleolimnology of Lake Issyk-Kul, Kyrgyzstan: trace element and stable isotope composition of ostracodes. Palaeogeography, Palaeoclimatology, Palaeoecology, 176(1-4): 207-227.
doi: 10.1016/S0031-0182(01)00339-X
[19]   Romanovsky V V. 2002. Water level variations and water balance of Lake Issyk-Kul. In: Jean K, Beishen I. Lake Issyk-Kul: Its Natural Environment. Dordrecht: Springer Science+Business Media, 45-57.
[20]   Romanovsky V V, Tashbaeva S, Crétaux J F, et al. 2013. The closed Lake Issyk-Kul as an indicator of global warming in Tien Shan. Natural Science, 5(5): 608-623.
doi: 10.4236/ns.2013.55076
[21]   Saitoh K. 2019. Geographical study on water chemistry in Lake Issyk-Kul and its catchment, Central Asia. Journal of Geographical Society of Hosei University, 51: 35-44. (in Japanese)
[22]   Saitoh K, Kodera K. 2019. Major chemical components of Lake Issyk-Kul and the river and ground water in its catchment area (Central Asia). Journal of Japanese Association of Hydrological Sciences, 49(2): 91-106. (in Japanese)
doi: 10.4145/jahs.49.91
[23]   Salamat A, Abuduwaili J, Shaidyldaeva N. 2015. Impact of climate change on water level fluctuation of Issyk-Kul Lake. Arabian Journal of Geosciences, 8(8): 5361-5371.
doi: 10.1007/s12517-014-1516-6
[24]   Savvaitova K, Petr T. 1992. Lake Issyk-Kul, Kirgizia. International Journal of Salt Lake Research, 1(2): 21-46.
[25]   Shope C L, Angeroth C E. 2015. Calculating salt loads to Great Salt Lake and the associated uncertainties for water year 2013; updating a 48 year old standard. Science of the Total Environment, 536: 391-405.
doi: 10.1016/j.scitotenv.2015.07.015
[26]   Sugai R, Mizokoyama I, Sugahara S, et al. 2016. Inflow characteristics of pollutant loads from surrounding rivers into Lake Shinji. Japanese Journal of Limnology, 77(2): 117-136. (in Japanese)
doi: 10.3739/rikusui.77.117
[27]   Sugawara M. 1972. Outflow Analysis Method (Lectures on Hydrology). Tokyo: Kyoritsu Publishing. (in Japanese)
[28]   Tien H Le, Okubo K, Thi P H, et al. 2020. Estimation of long-term external nutrient loading from watersheds to Lake Biwa by a combined rainfall-runoff model and loading-discharge curve approach. Hydrological Research Letters, 14(4): 143-149.
doi: 10.3178/hrl.14.143
[29]   Tsigelnaya D. 1995. Issyk-Kul Lake. In: Maudych A F. Enclosed Seas and Large Lakes of Eastern Europe and Middle Asia, 1. Amsterdam: SPB Academic Publishing, 199-229.
[30]   Vollmer M K, Weiss R F, Schlosser P, et al. 2002. Deep-water renewal in Lake Issyk-Kul. Geophysical Research Letters, 29(8): 121-124.
[31]   Wurtsbaugh W A, Miller C, Null S E, et al. 2017. Decline of the world's saline lakes. Nature Geoscience, 10(11): 816-821.
doi: 10.1038/ngeo3052
[32]   Yokota K, Inoue T, Yokokawa M, et al. 2013. Evaluation of the amount of nitrogen and phosphorus runoff load from rivers based on the high-frequency survey. Environmental Science, 26(2): 140-149.
[1] CHEN Shumin, JIN Zhao, ZHANG Jing, YANG Siqi. Soil quality assessment in different dammed-valley farmlands in the hilly-gully mountain areas of the northern Loess Plateau, China[J]. Journal of Arid Land, 2021, 13(8): 777-789.
[2] WANG Yuejian, GU Xinchen, YANG Guang, YAO Junqiang, LIAO Na. Impacts of climate change and human activities on water resources in the Ebinur Lake Basin, Northwest China[J]. Journal of Arid Land, 2021, 13(6): 581-598.
[3] JIA Wuhui, YIN Lihe, ZHANG Maosheng, ZHANG Xinxin, ZHANG Jun, TANG Xiaoping, DONG Jiaqiu. Quantification of groundwater recharge and evapotranspiration along a semi-arid wetland transect using diurnal water table fluctuations[J]. Journal of Arid Land, 2021, 13(5): 455-469.
[4] XIANG Longwei, WANG Hansheng, JIANG Liming, SHEN Qiang, Holger STEFFEN, LI Zhen. Glacier mass balance in High Mountain Asia inferred from a GRACE release-6 gravity solution for the period 2002-2016[J]. Journal of Arid Land, 2021, 13(3): 224-238.
[5] WANG Panpan, LI Zhongqin, XU Chunhai, WANG Puyu. Region-wide glacier area and mass budgets for the Shaksgam River Basin, Karakoram Mountains, during 2000-2016[J]. Journal of Arid Land, 2021, 13(2): 175-188.
[6] SUN Lingxiao, YU Yang, GAO Yuting, ZHANG Haiyan, YU Xiang, HE Jing, WANG Dagang, Ireneusz MALIK, Malgorzata WISTUBA, YU Ruide. Temporal and spatial variations of net primary productivity and its response to groundwater of a typical oasis in the Tarim Basin, China[J]. Journal of Arid Land, 2021, 13(11): 1142-1154.
[7] WANG Wanrui, CHEN Yaning, WANG Weihua, XIA Zhenhua, LI Xiaoyang, Patient M KAYUMBA. Hydrochemical characteristics and evolution of groundwater in the dried-up river oasis of the Tarim Basin, Central Asia[J]. Journal of Arid Land, 2021, 13(10): 977-994.
[8] Syed Z SHAH, Aysha RASHEED, Bilquees GUL, Muhammad A KHAN, Brent L NIELSEN, Abdul HAMEED. Maternal salinity improves yield, size and stress tolerance of Suaeda fruticosa seeds[J]. Journal of Arid Land, 2020, 12(2): 283-293.
[9] DONG Zhengwu, LI Shengyu, ZHAO Ying, LEI Jiaqiang, WANG Yongdong, LI Congjuan. Stable oxygen-hydrogen isotopes reveal water use strategies of Tamarix taklamakanensis in the Taklimakan Desert, China[J]. Journal of Arid Land, 2020, 12(1): 115-129.
[10] Rashid KULMATOV, Jasur MIRZAEV, Jilili ABUDUWAILI, Bakhtiyor KARIMOV. Challenges for the sustainable use of water and land resources under a changing climate and increasing salinization in the Jizzakh irrigation zone of Uzbekistan[J]. Journal of Arid Land, 2020, 12(1): 90-103.
[11] DANG Hongzhong, ZHANG Lizhen, YANG Wenbin, FENG Jinchao, HAN Hui, CHEN Yiben. Severe drought strongly reduces water use and its recovery ability of mature Mongolian Scots pine (Pinus sylvestris var. mongolica Litv.) in a semi-arid sandy environment of northern China[J]. Journal of Arid Land, 2019, 11(6): 880-891.
[12] MAMUT Jannathan, Dunyan TAN, C BASKIN Carol, M BASKIN Jerry. Effects of water stress and NaCl stress on different life cycle stages of the cold desert annual Lachnoloma lehmannii in China[J]. Journal of Arid Land, 2019, 11(5): 774-784.
[13] Peng ZHAO, Jianjun QU, Xianying XU, Qiushi YU, Shengxiu JIANG, Heran ZHAO. Desert vegetationdistribution and species-environment relationshipsinan oasis-desert ecotone ofnorthwestern China[J]. Journal of Arid Land, 2019, 11(3): 461-476.
[14] Tana QIAN, TSUNEKAWA Atsushi, Fei PENG, TsugiyukiMASUNAGA, Tao WANG, Rui LI. Derivation of salt content in salinized soil from hyperspectral reflectance data: A case study at Minqin Oasis, Northwest China[J]. Journal of Arid Land, 2019, 11(1): 111-122.
[15] EL-RAWY Mustafa, AL-MAKTOUMI Ali, ZEKRI Slim, ABDALLA Osman, AL-ABRI Rashid. Hydrological and economic feasibility of mitigating a stressed coastal aquifer using managed aquifer recharge: a case study of Jamma aquifer, Oman[J]. Journal of Arid Land, 2019, 11(1): 148-159.