| Research article |
|

|
|
|
| Glacier mass balance and its impacts on streamflow in a typical inland river basin in the Tianshan Mountains, northwestern China |
PENG Jiajia1,2, LI Zhongqin1,3,4,*( ), XU Liping1,2,*(), MA Yuqing1,2, LI Hongliang3, ZHAO Weibo3, FAN Shuang4 ), XU Liping1,2,*(), MA Yuqing1,2, LI Hongliang3, ZHAO Weibo3, FAN Shuang4 |
1College of Sciences, Shihezi University, Shihezi 832003, China
2Xinjiang Production and Construction Corps Key Laboratory of Oasis Town and Mountain-basin System Ecology, Shihezi 832003, China
3State Key Laboratory of Cryospheric Sciences/Tianshan Glaciological Station, Northwest Institute of Eco-Environment and Resources, Chinese Academy of Sciences, Lanzhou 730000, China
4College of Geography and Environmental Science, Northwest Normal University, Lanzhou 730070, China |
|
|
|
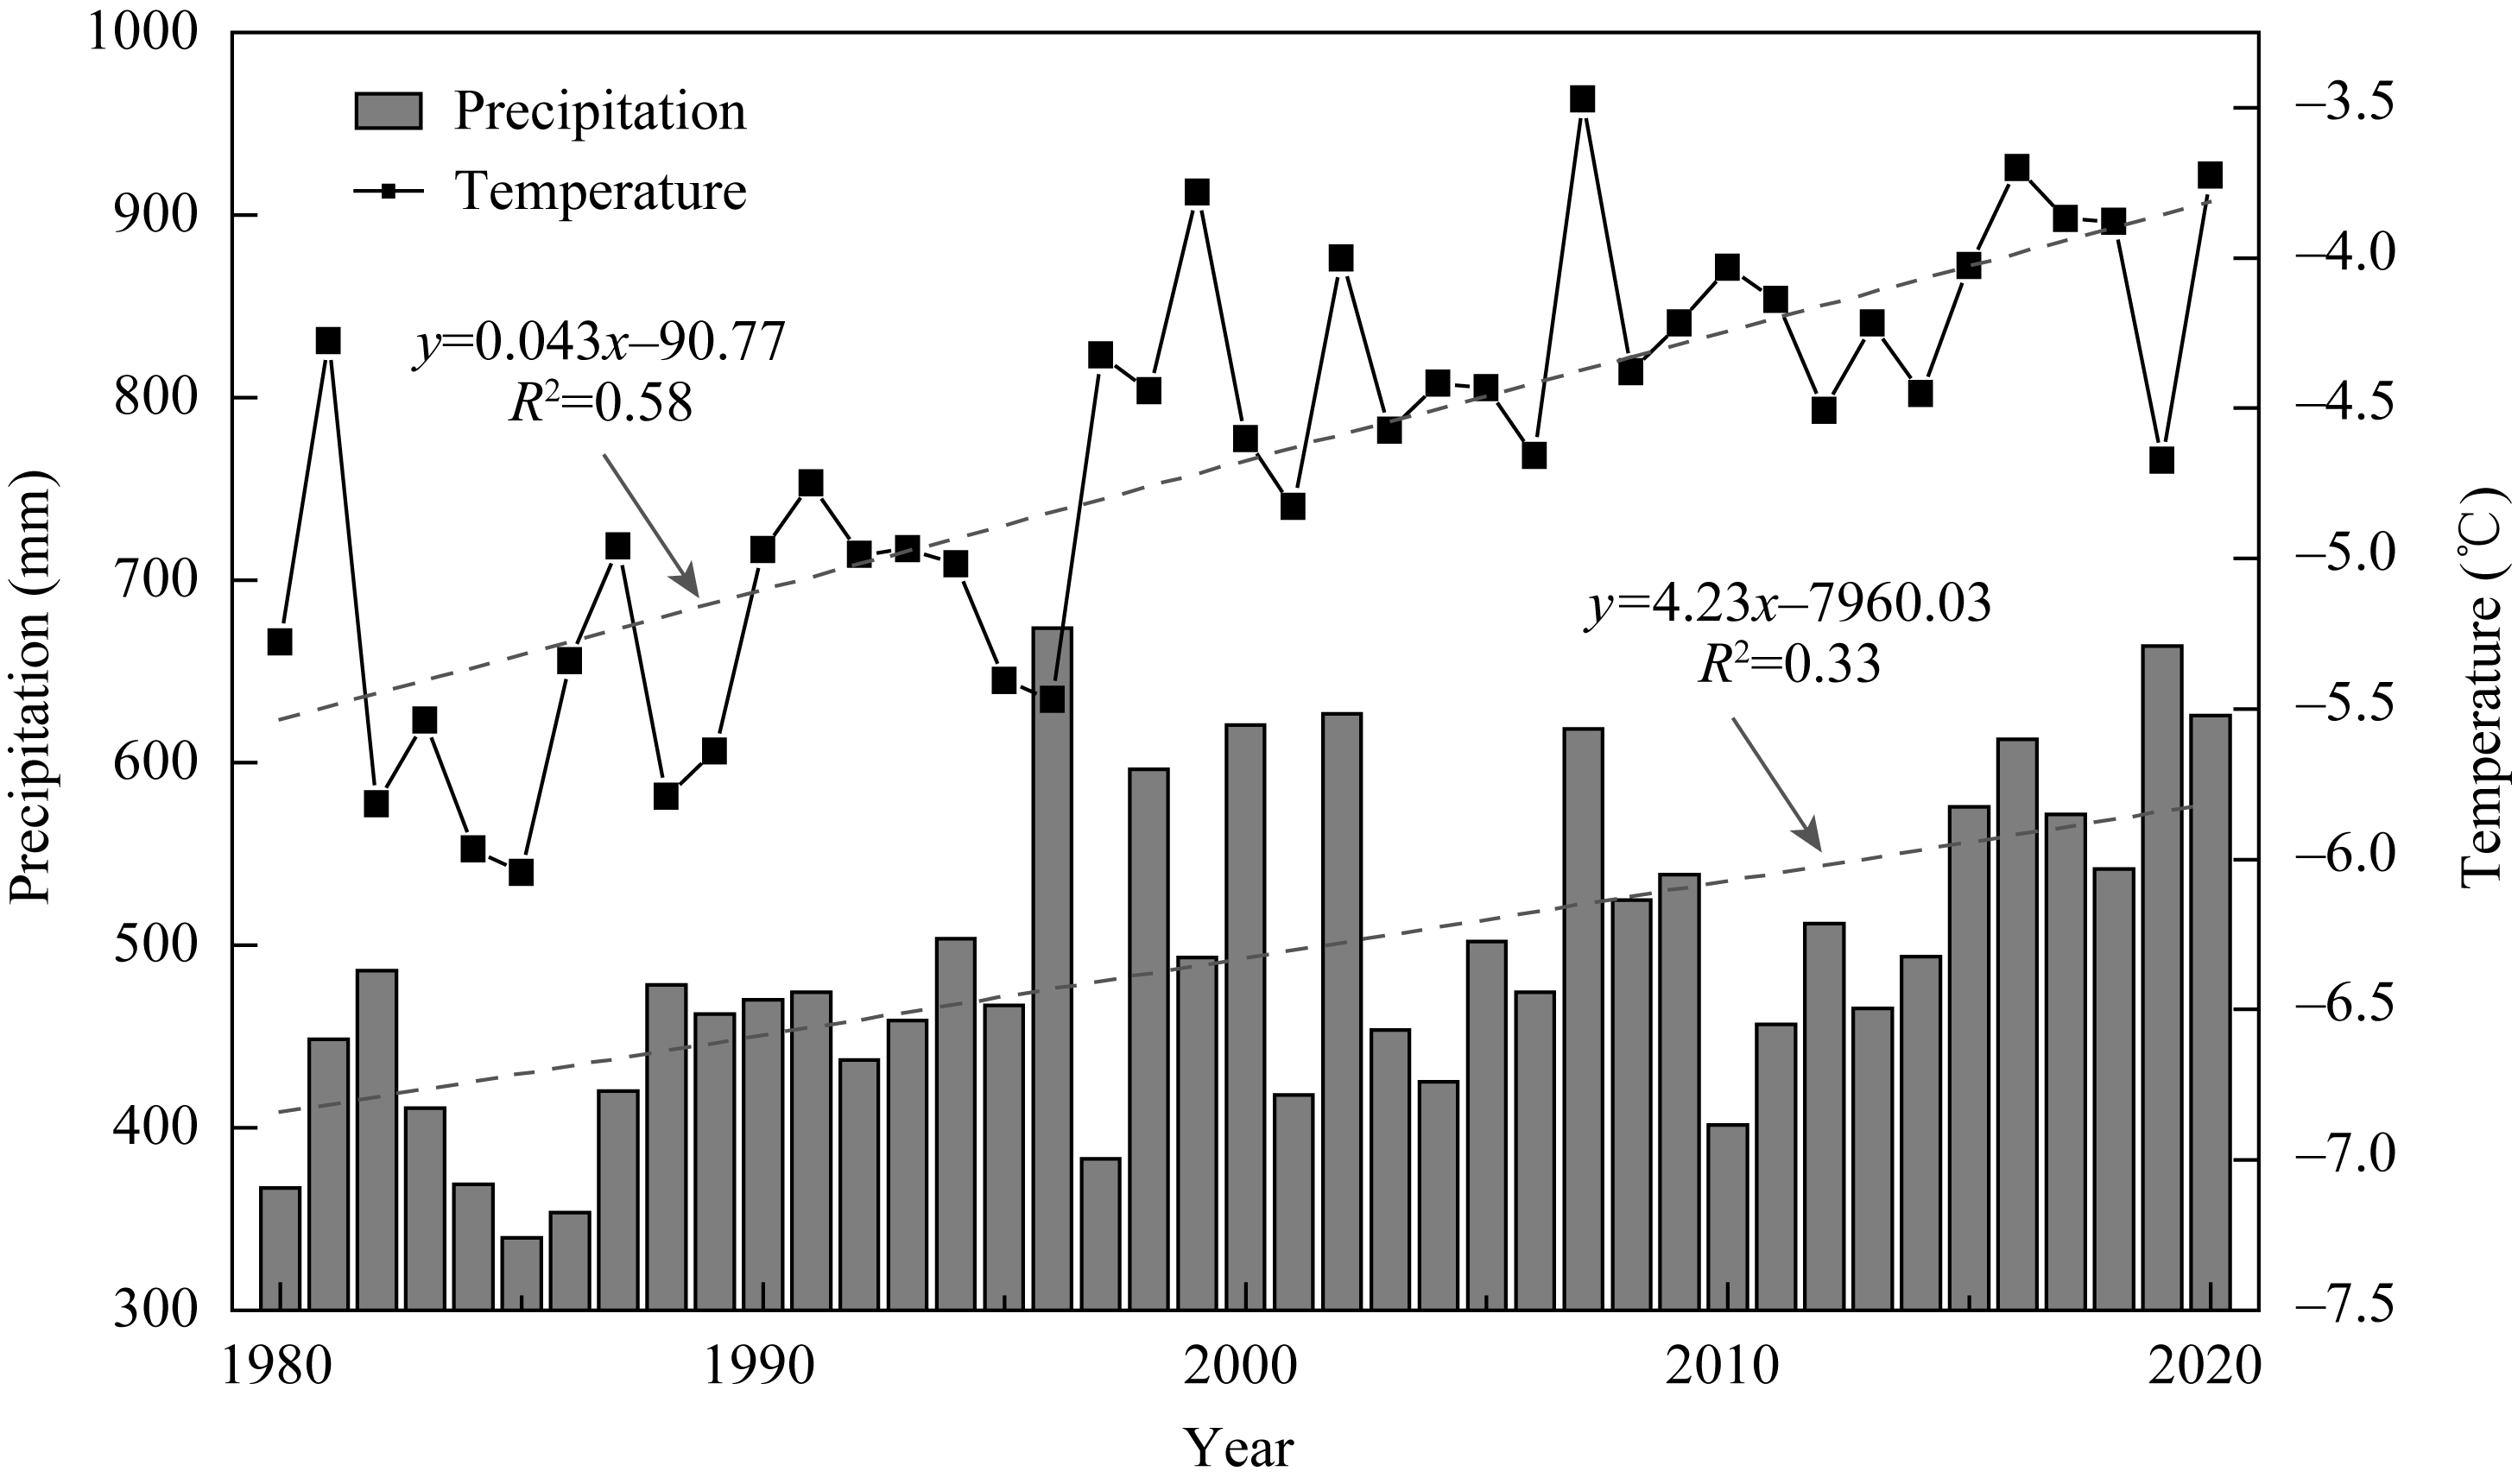
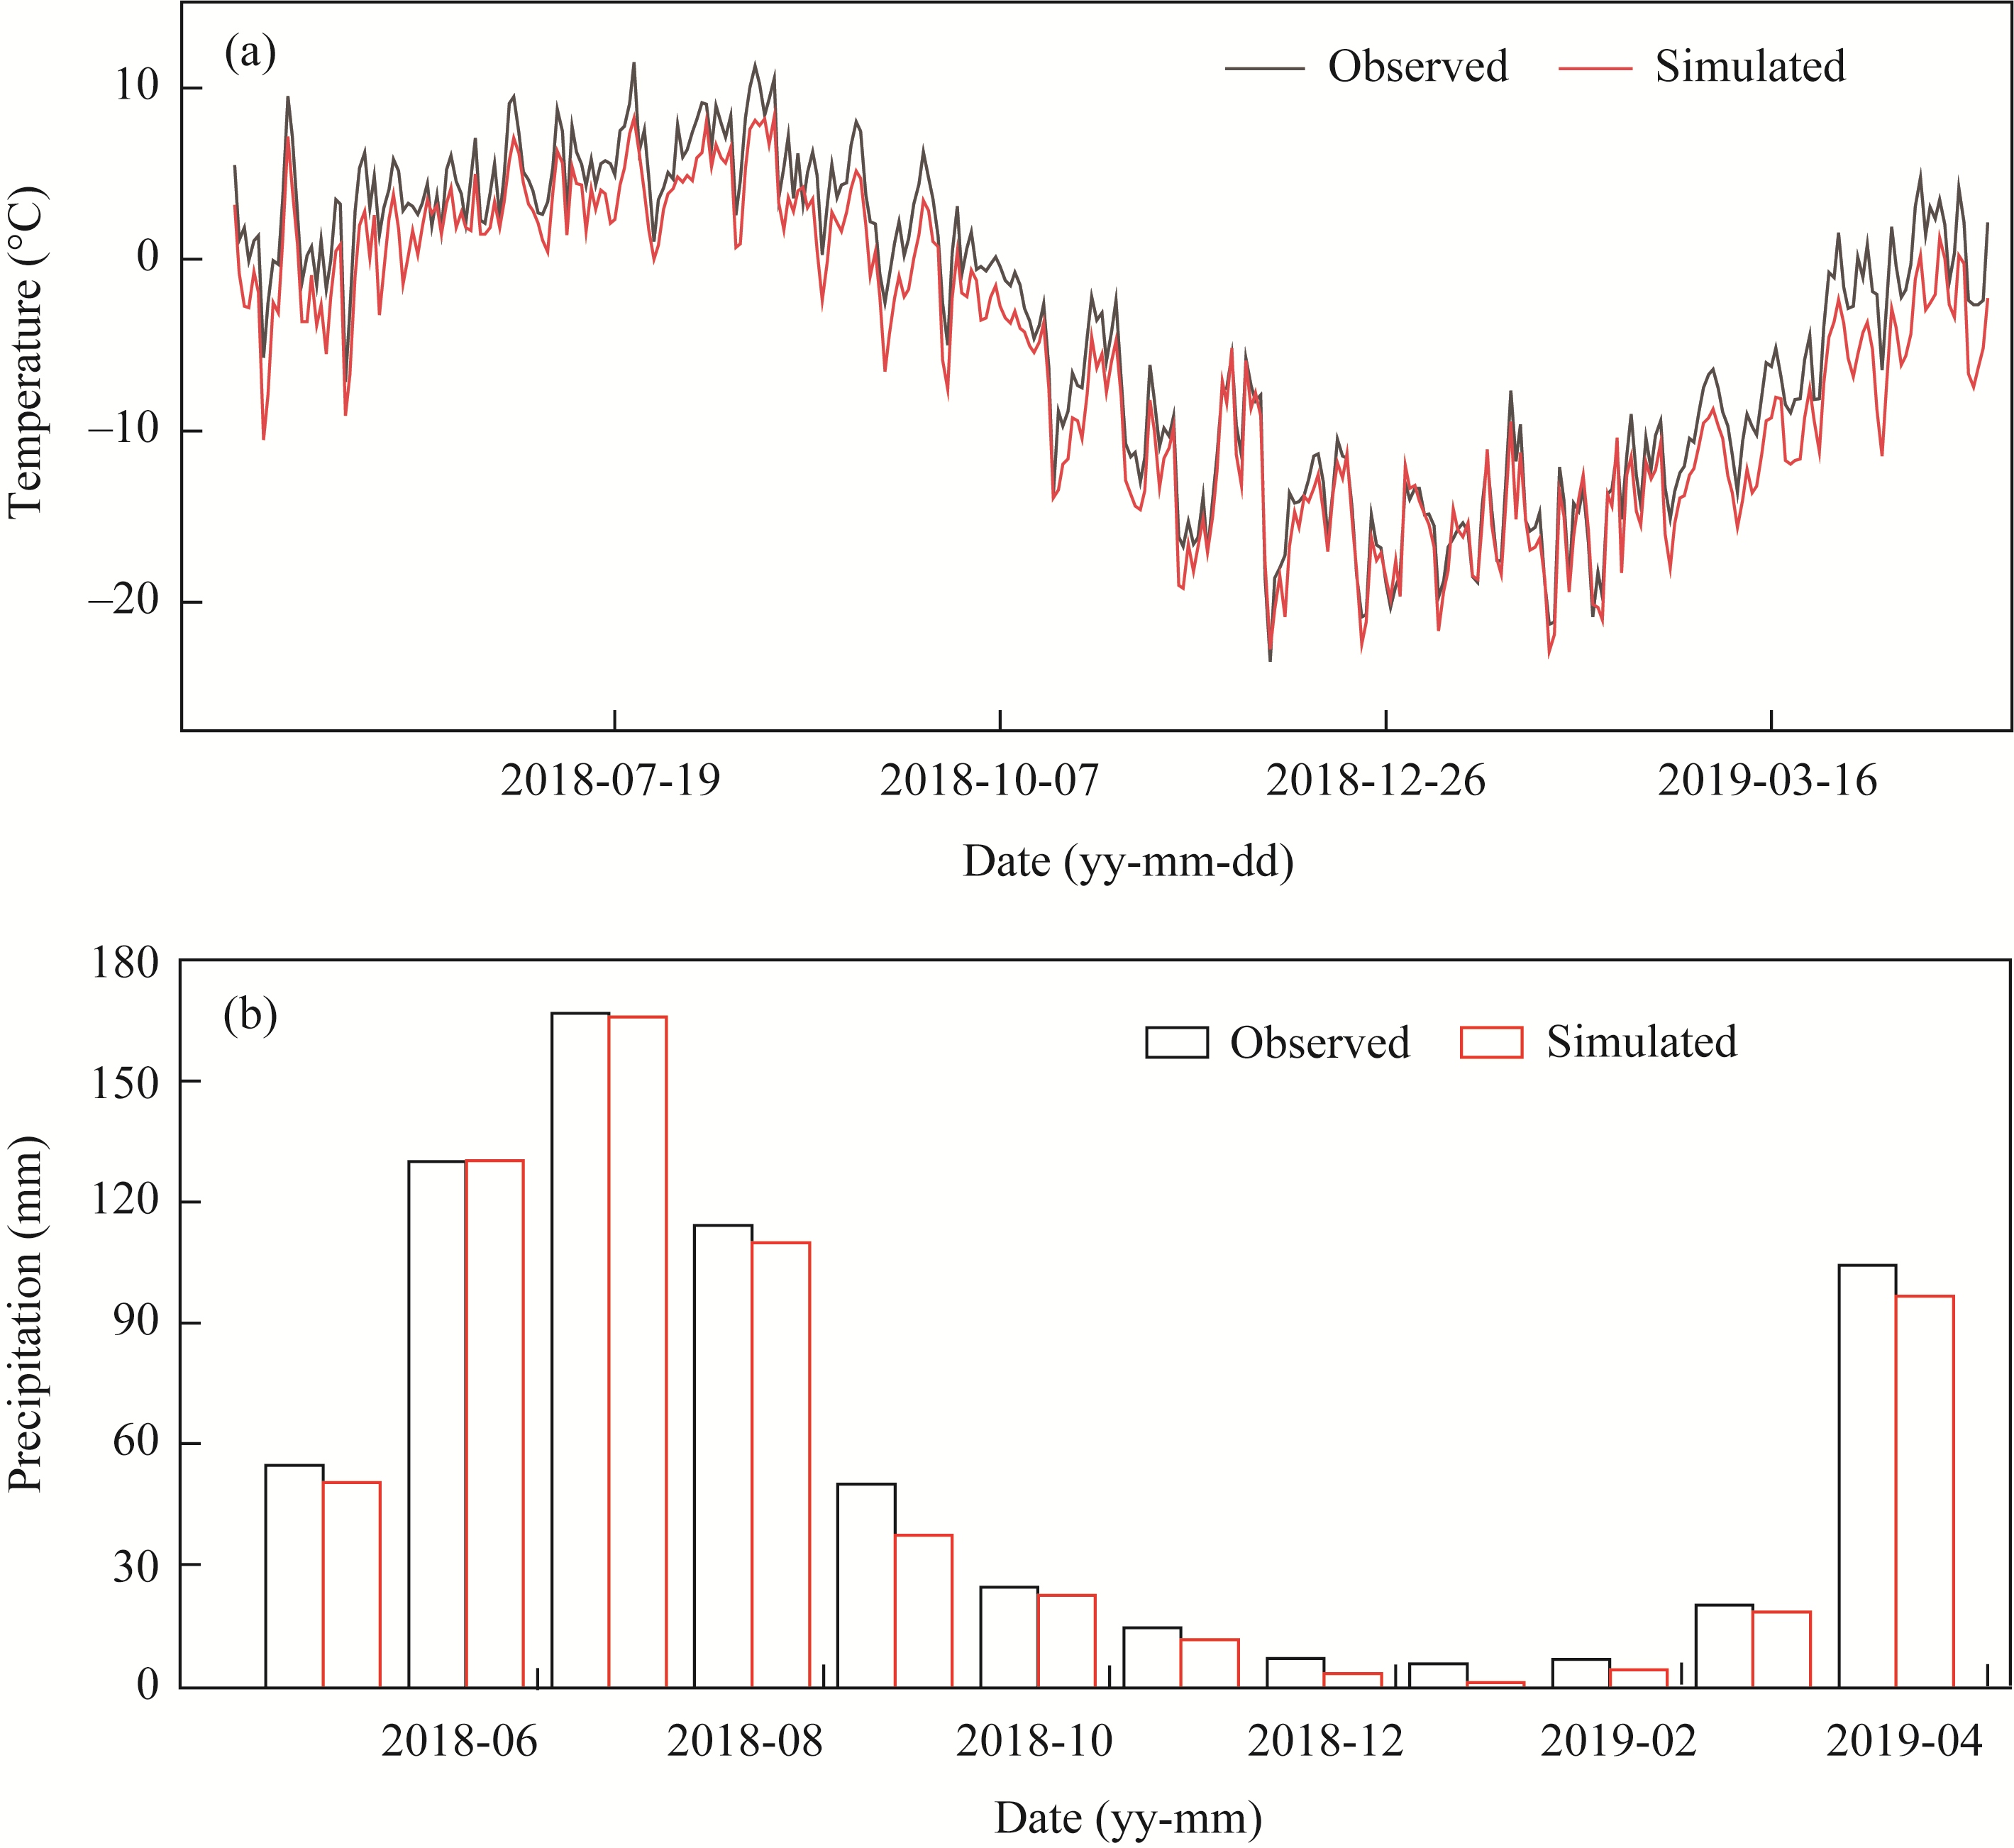
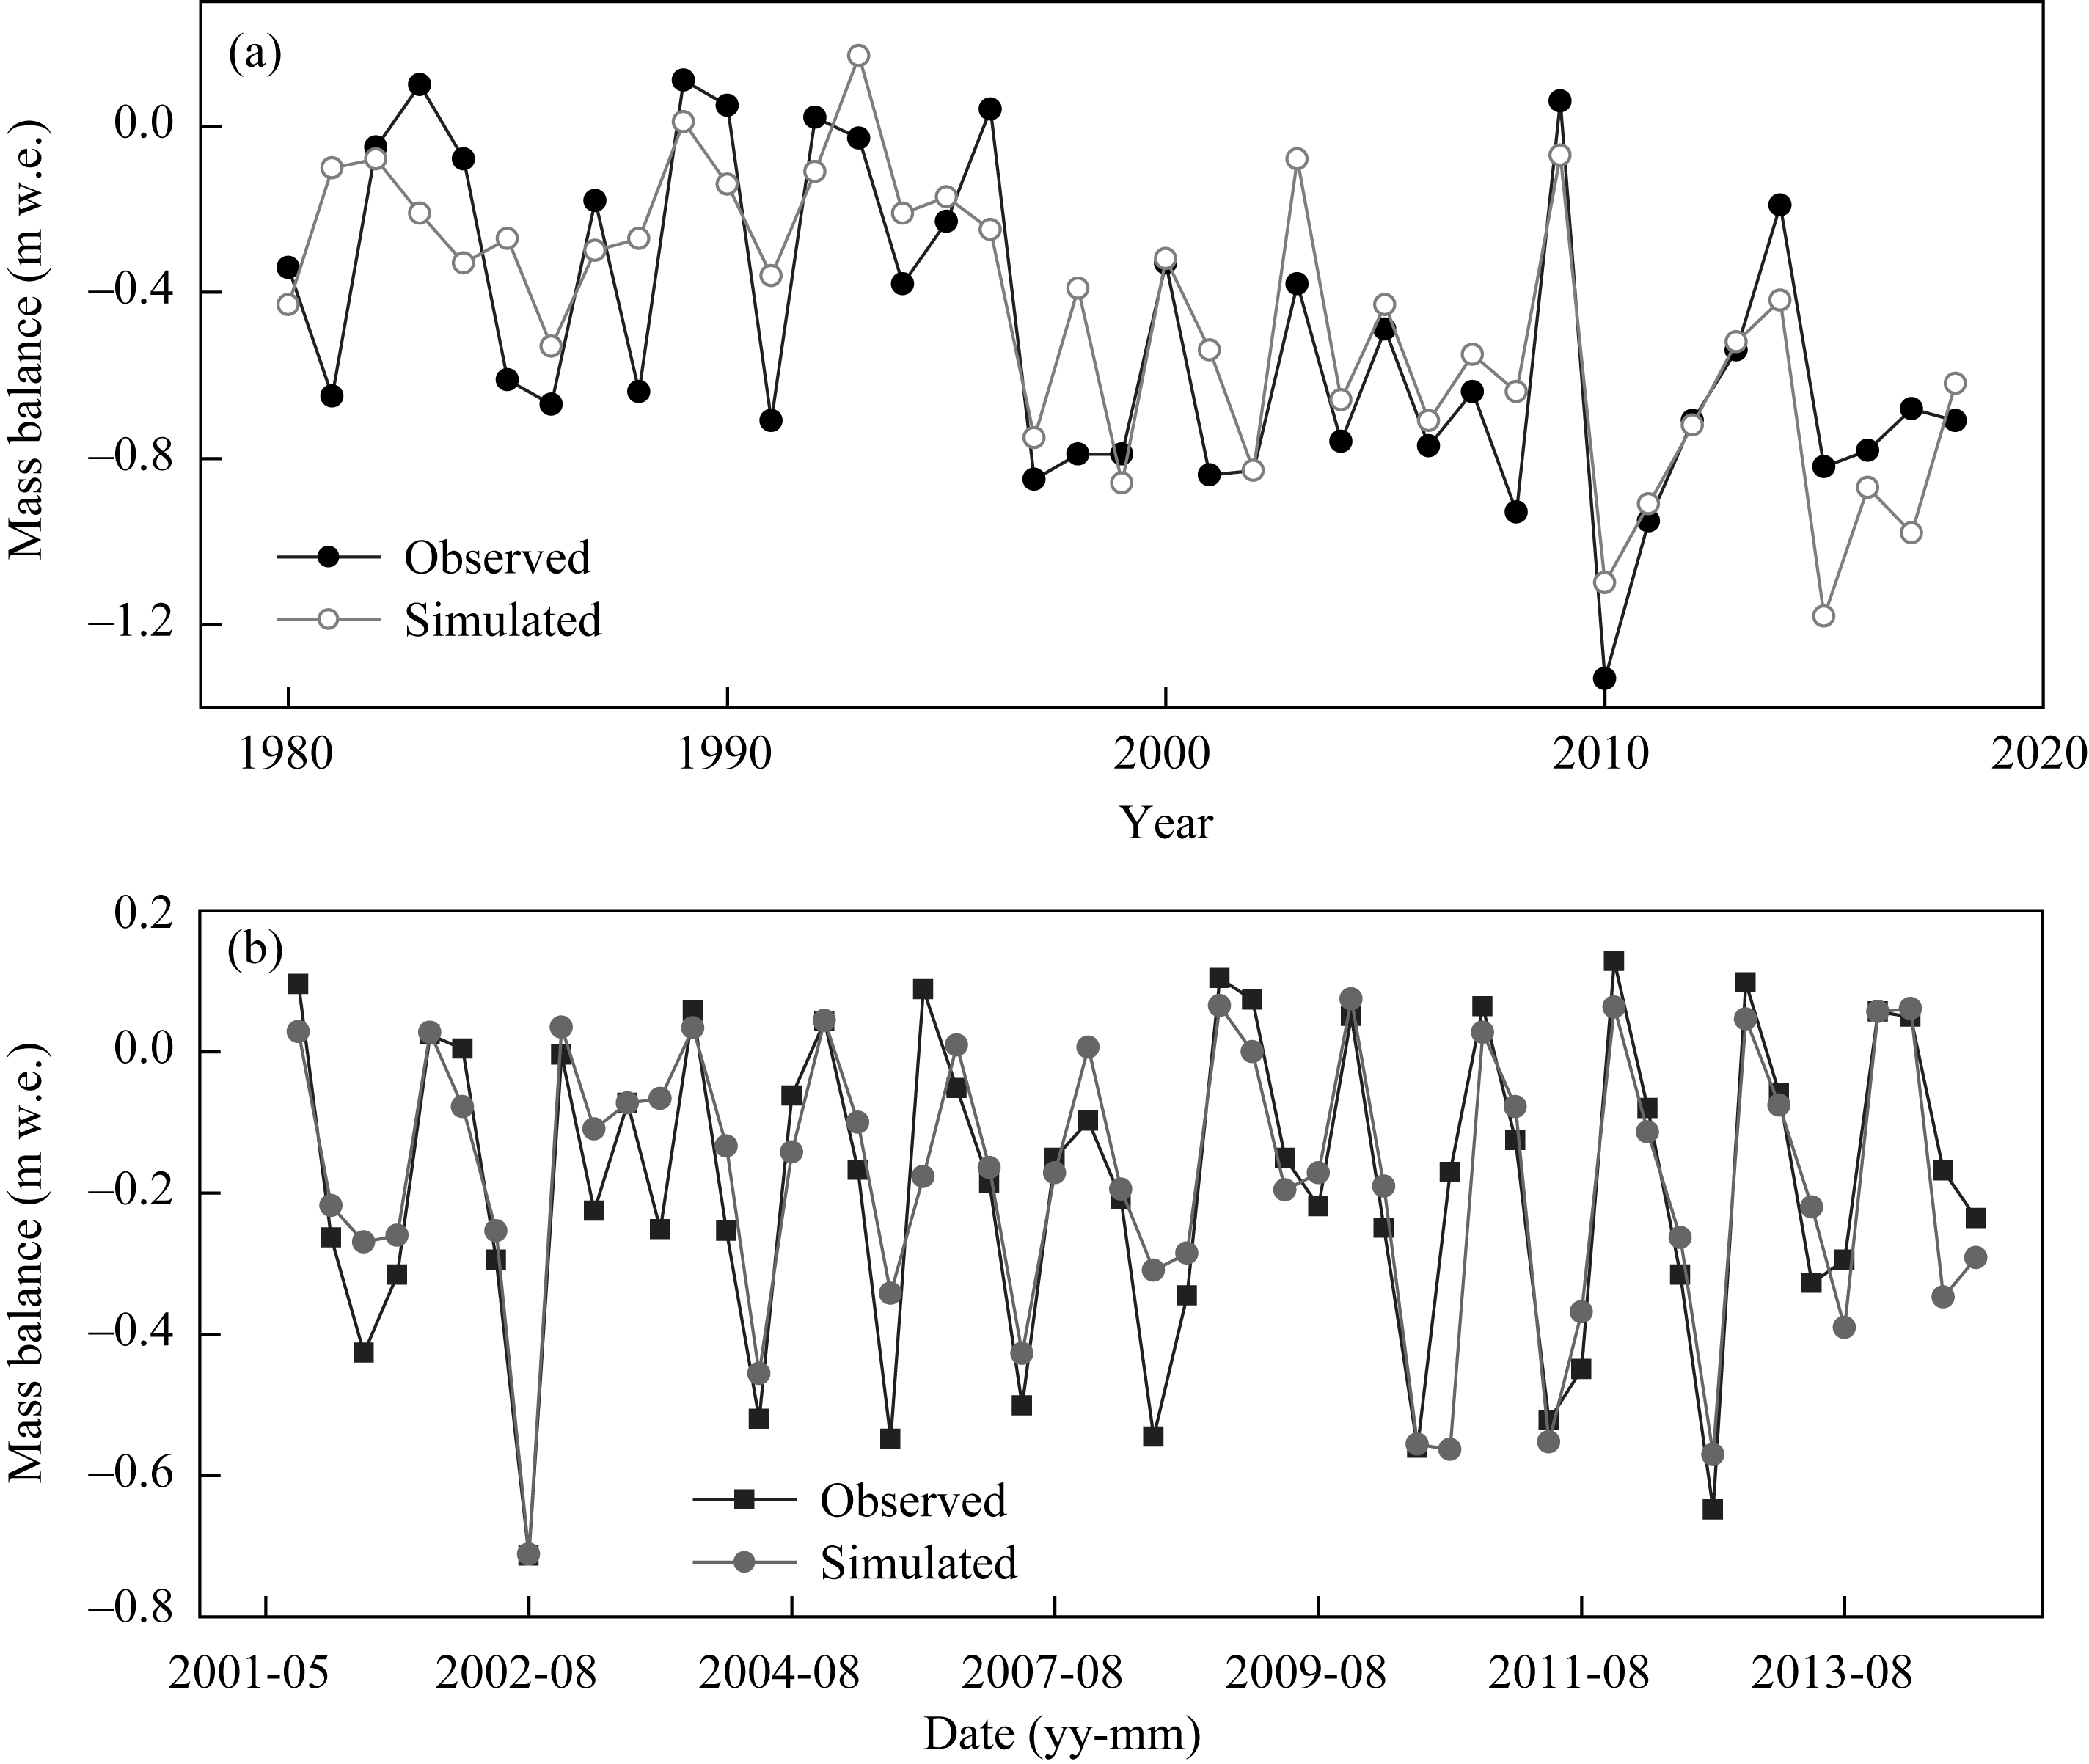
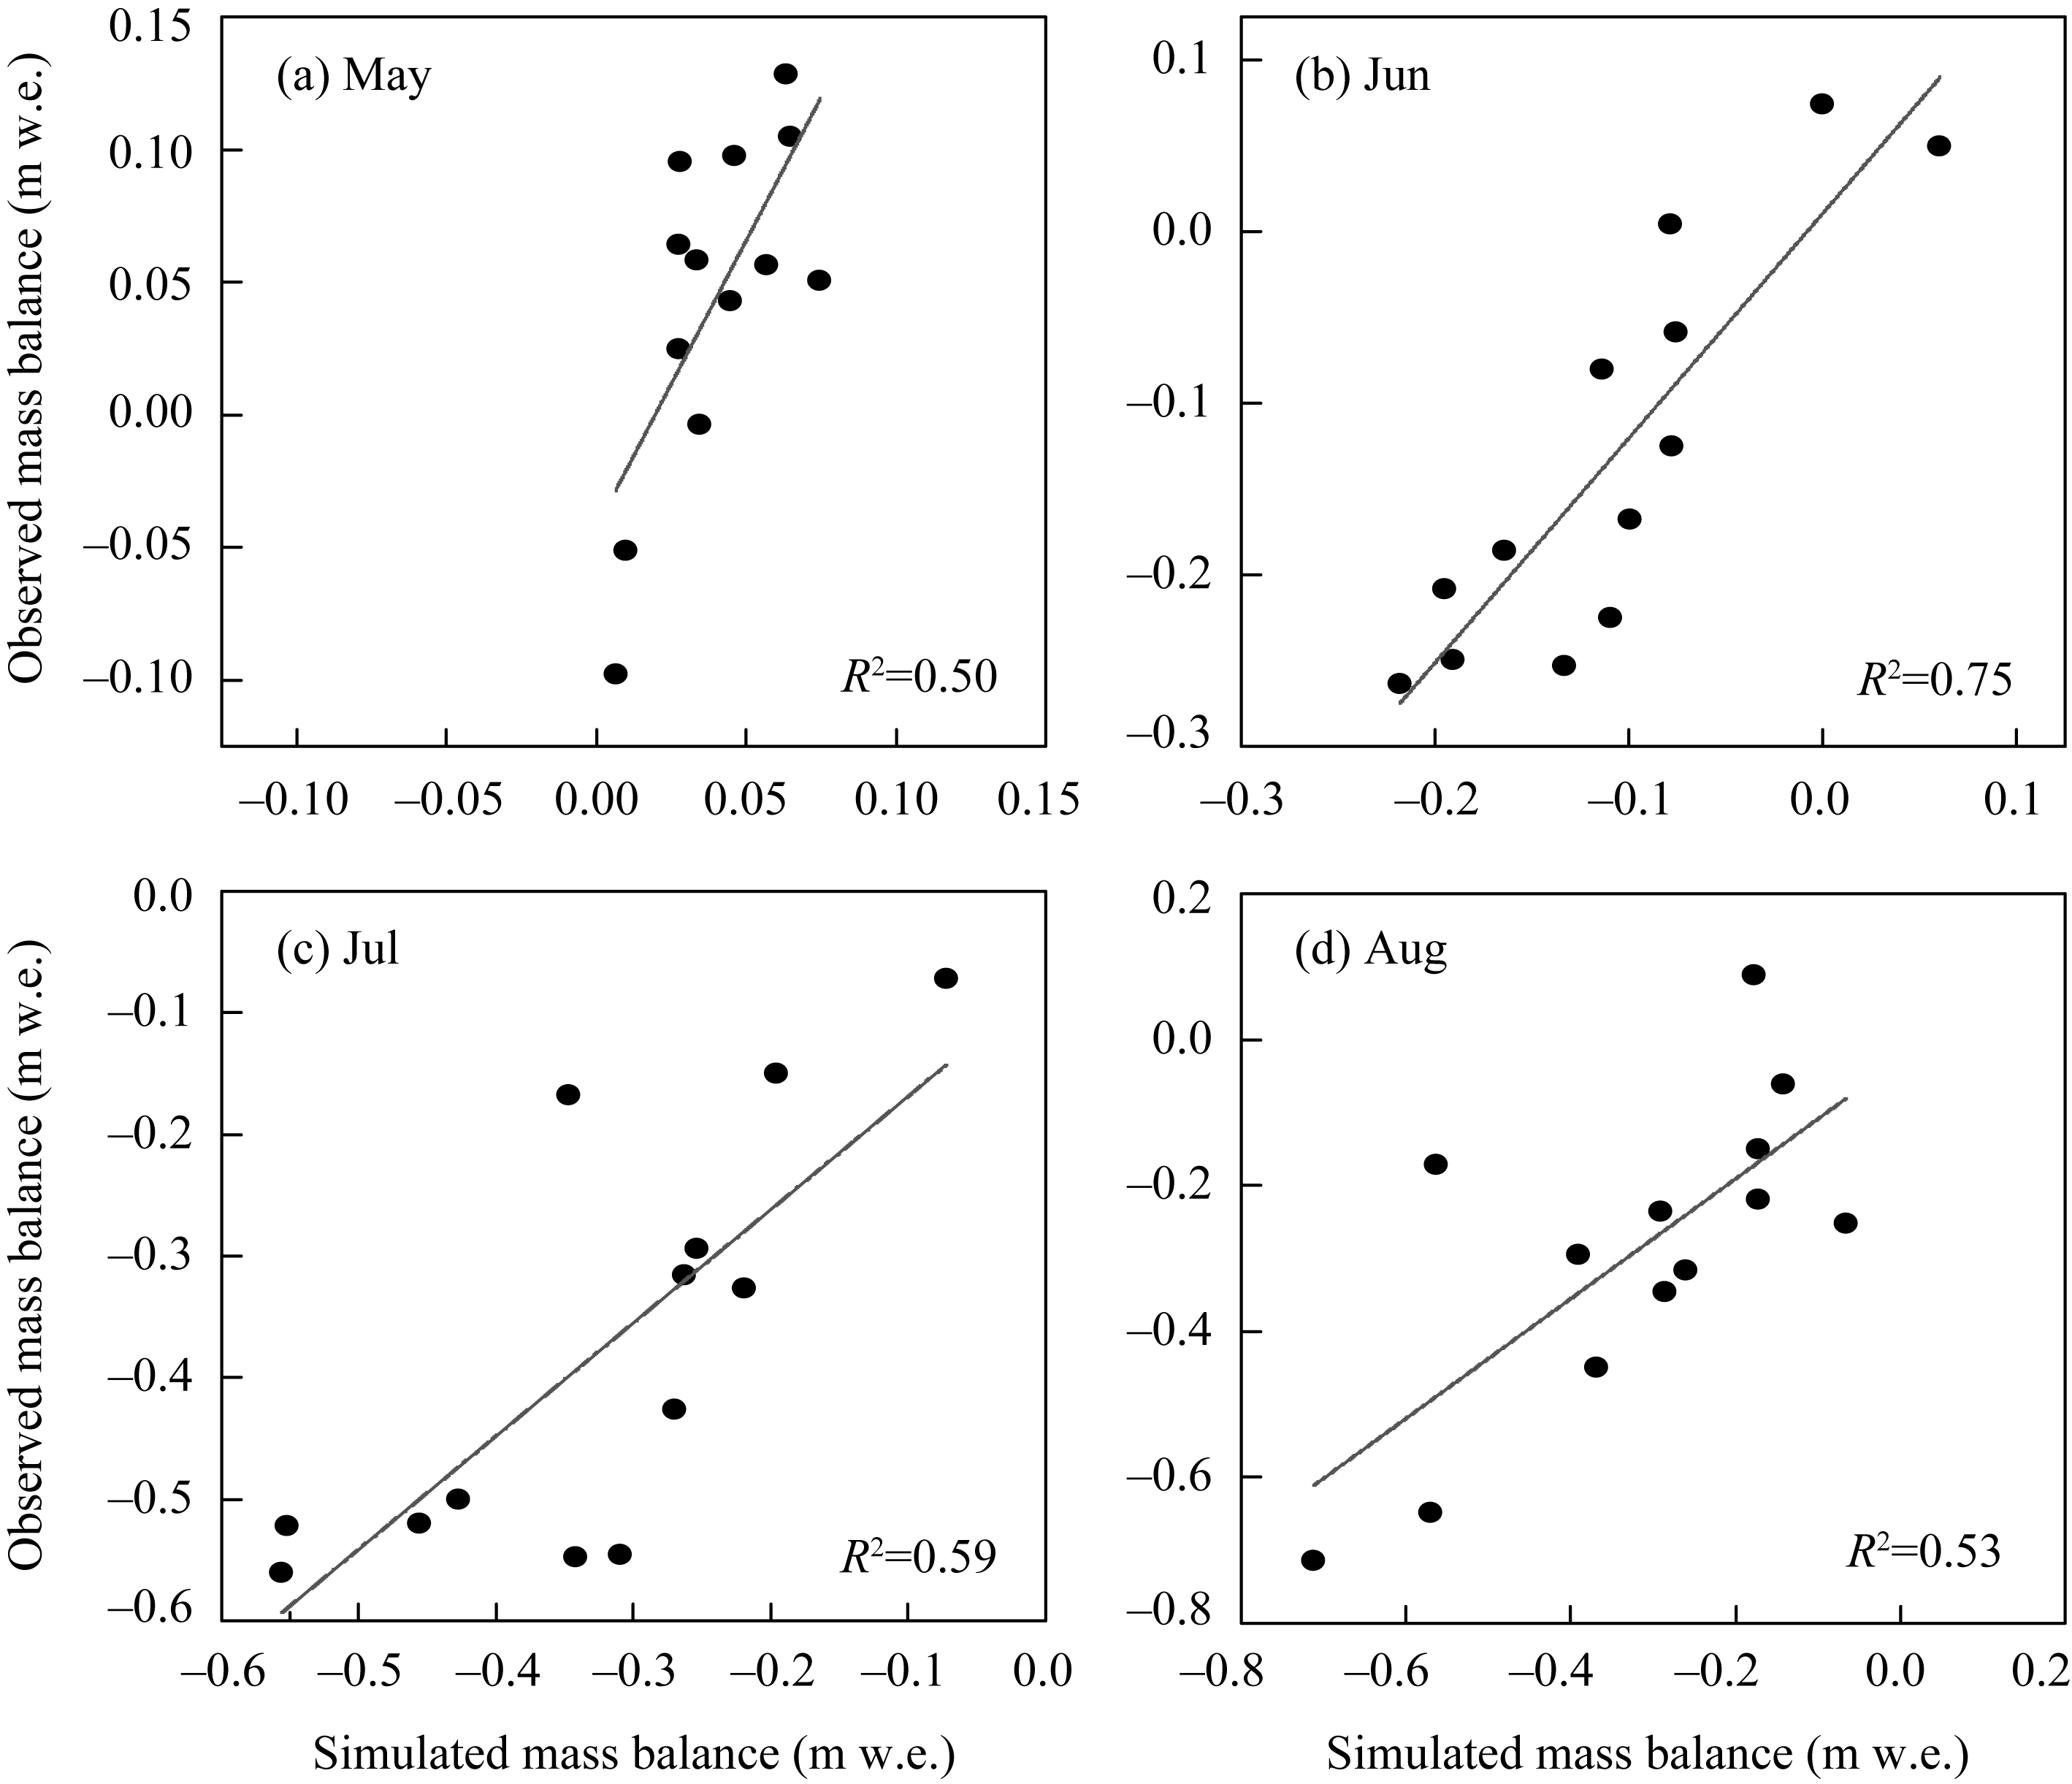
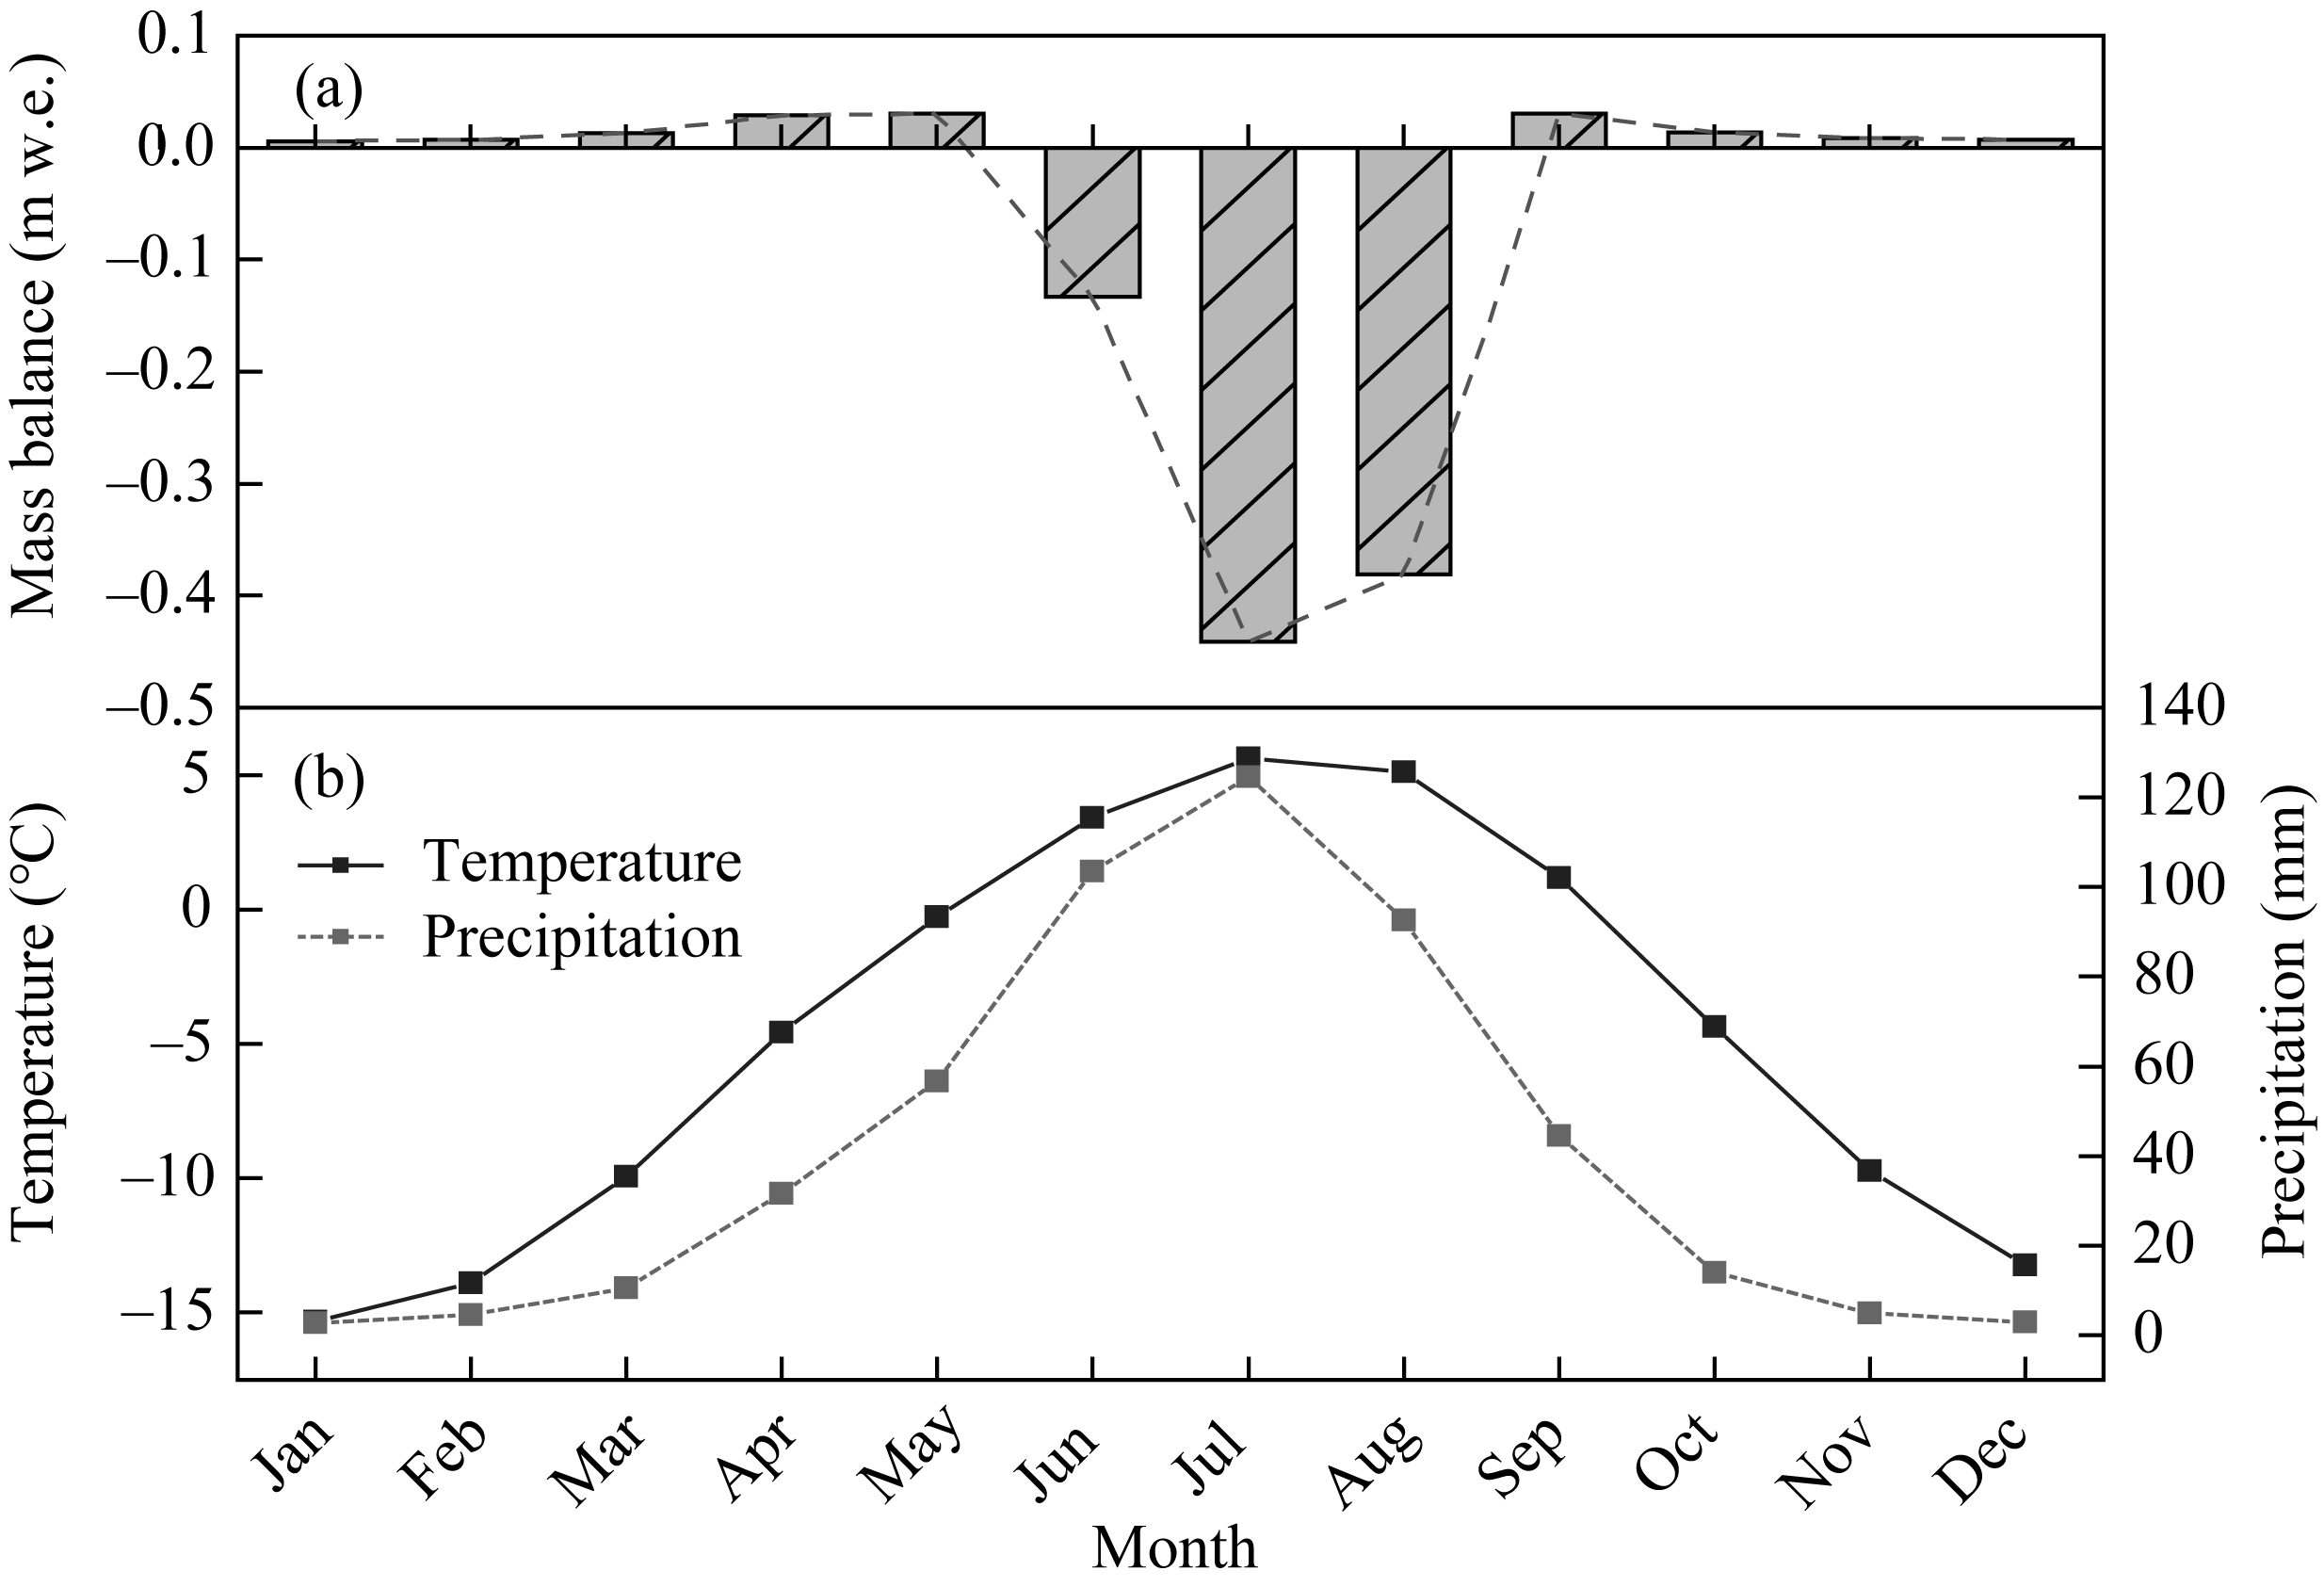
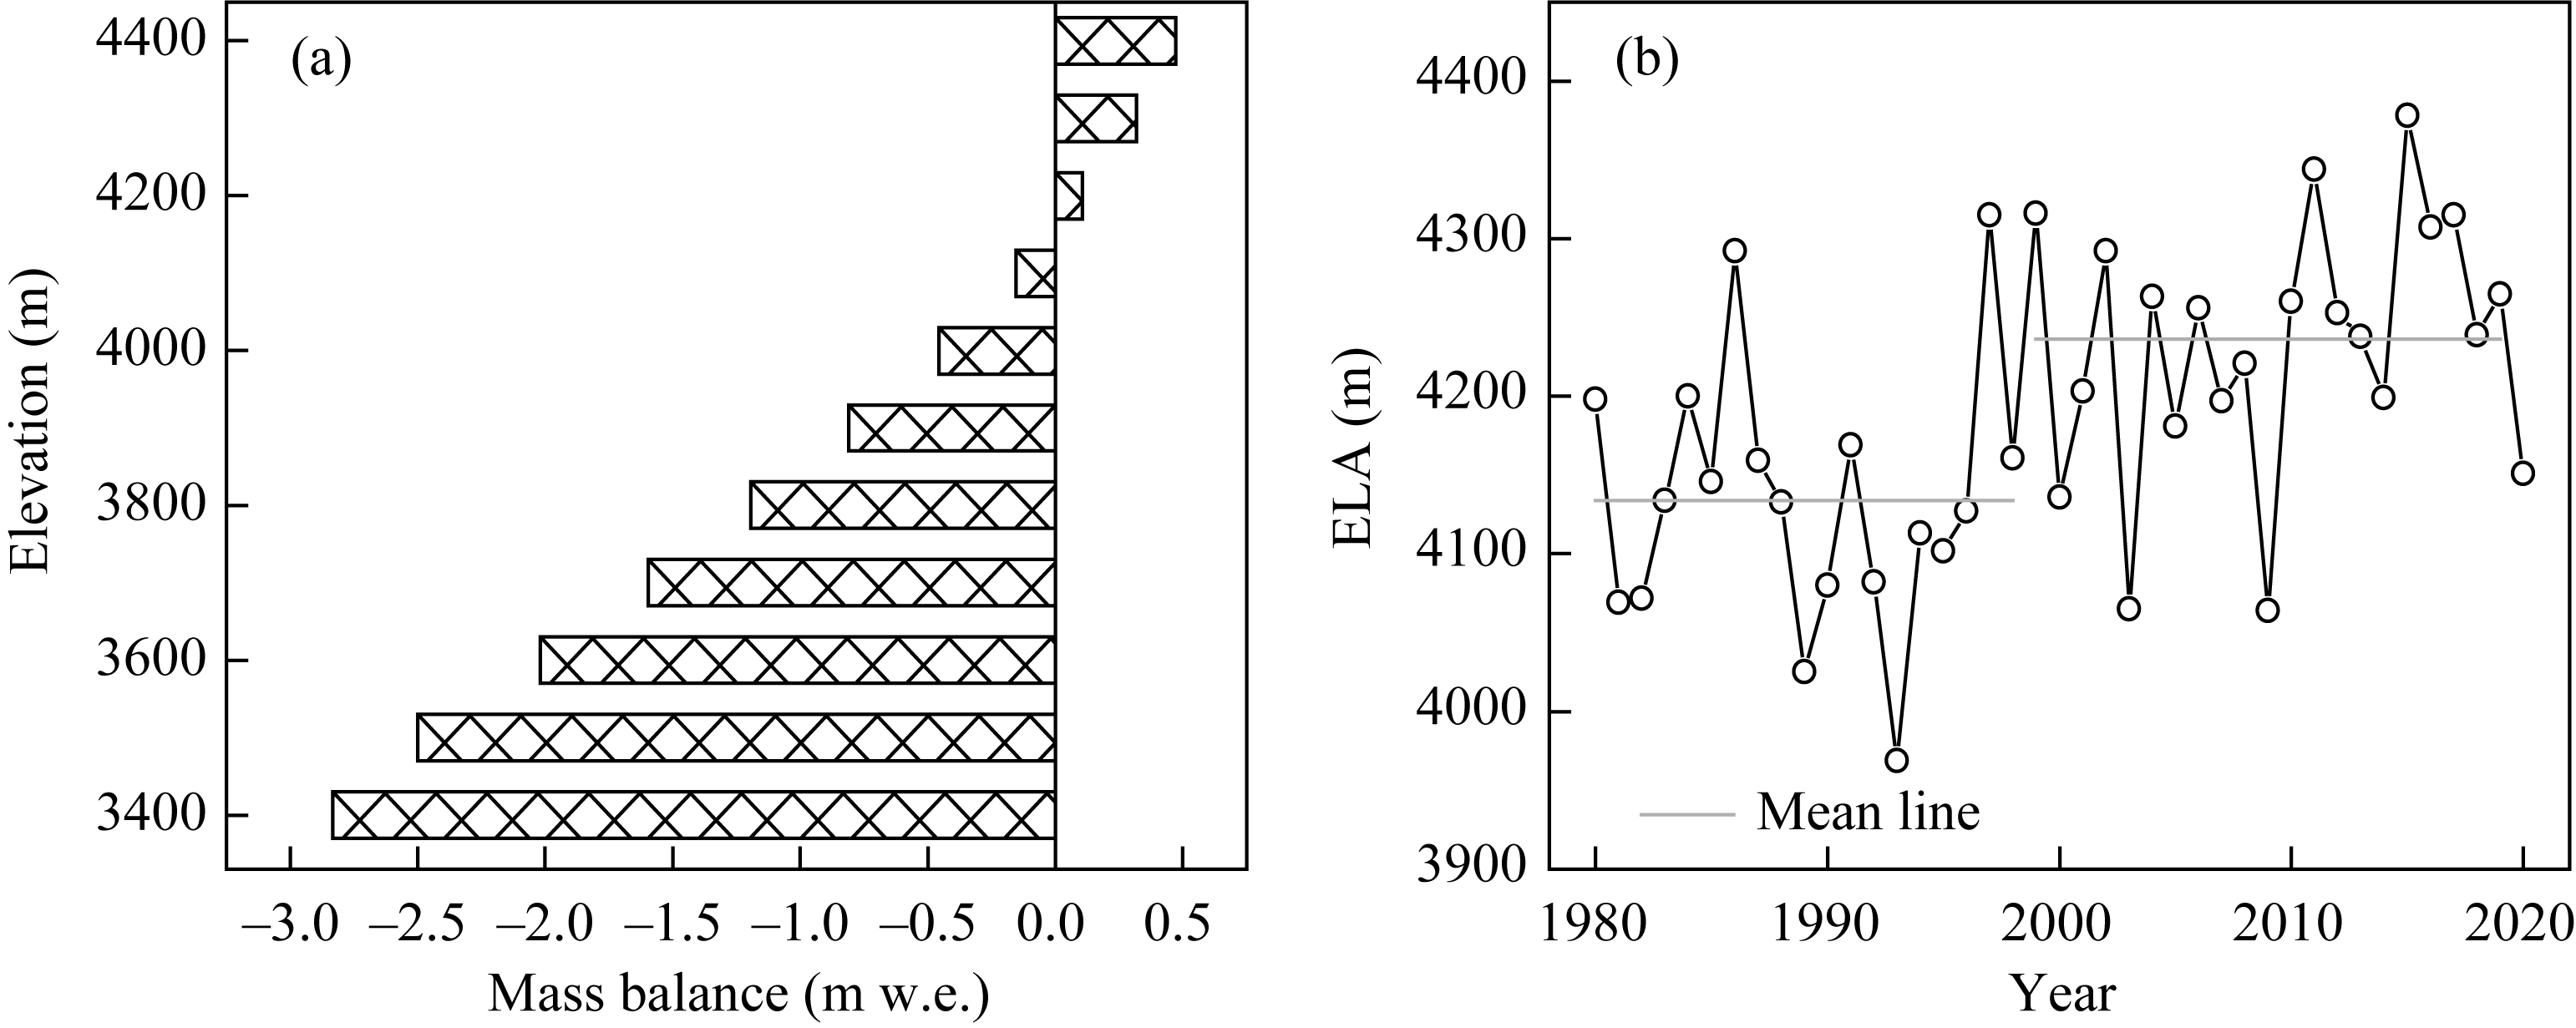
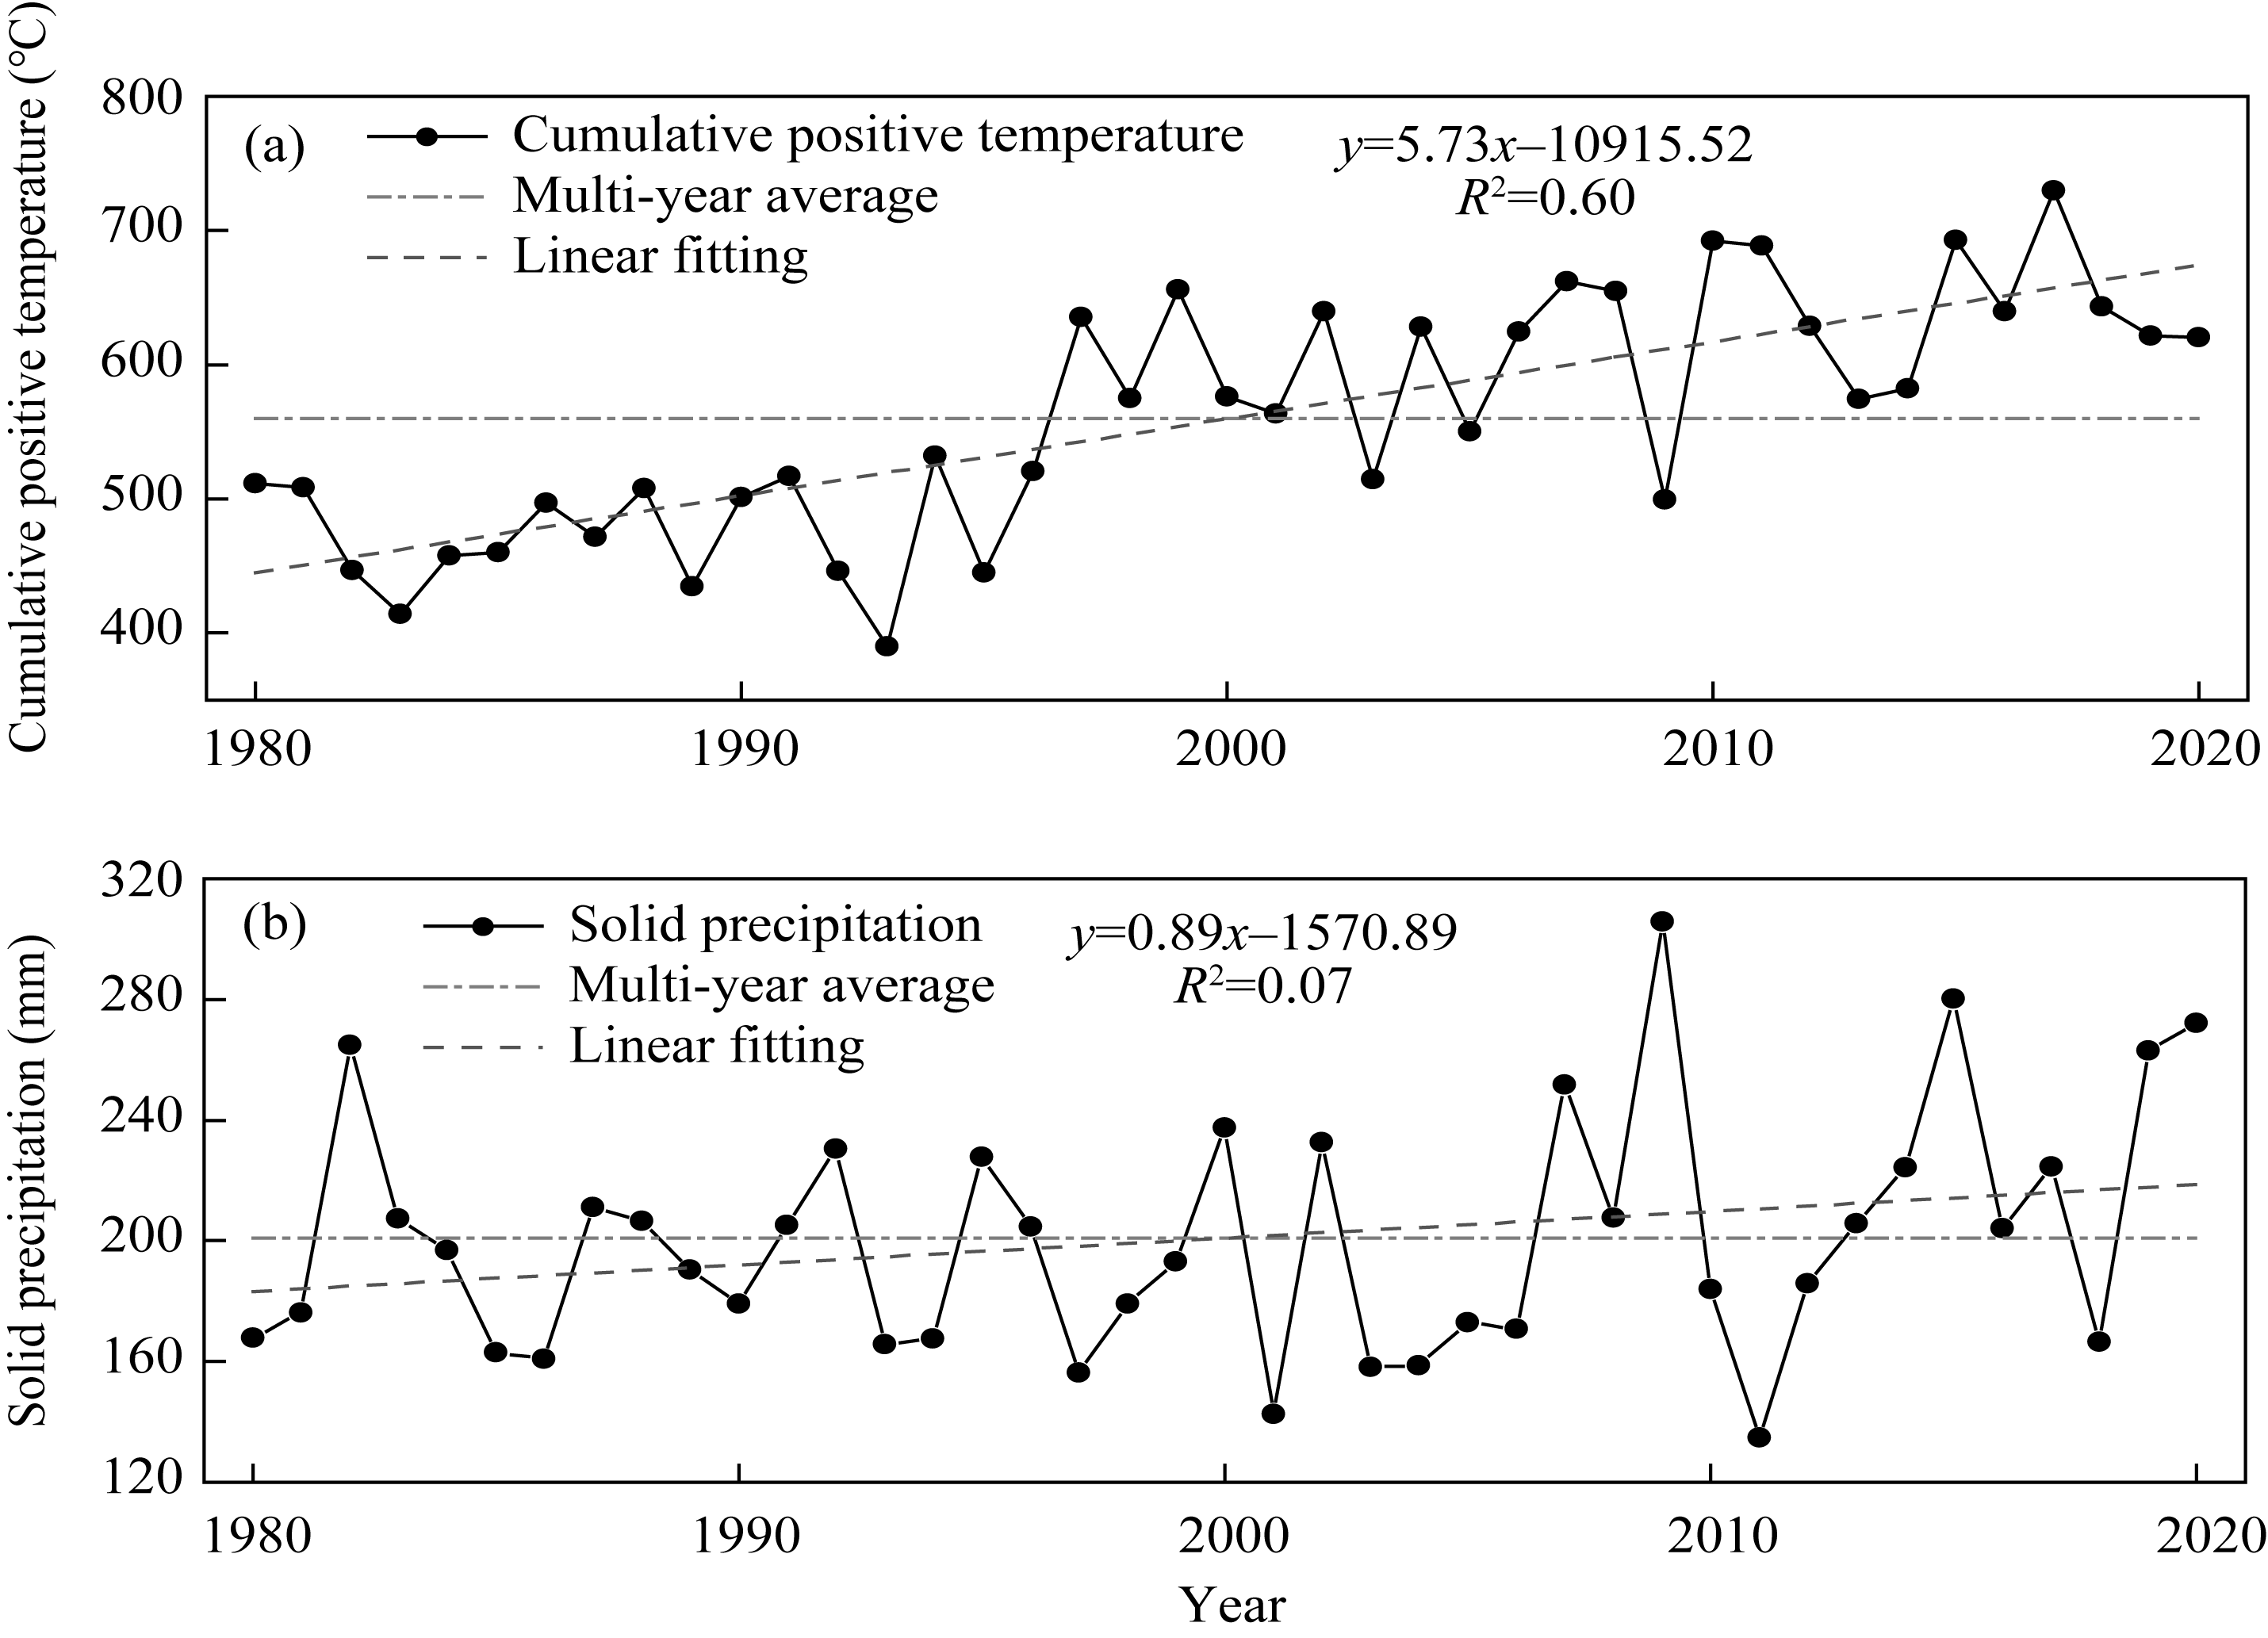
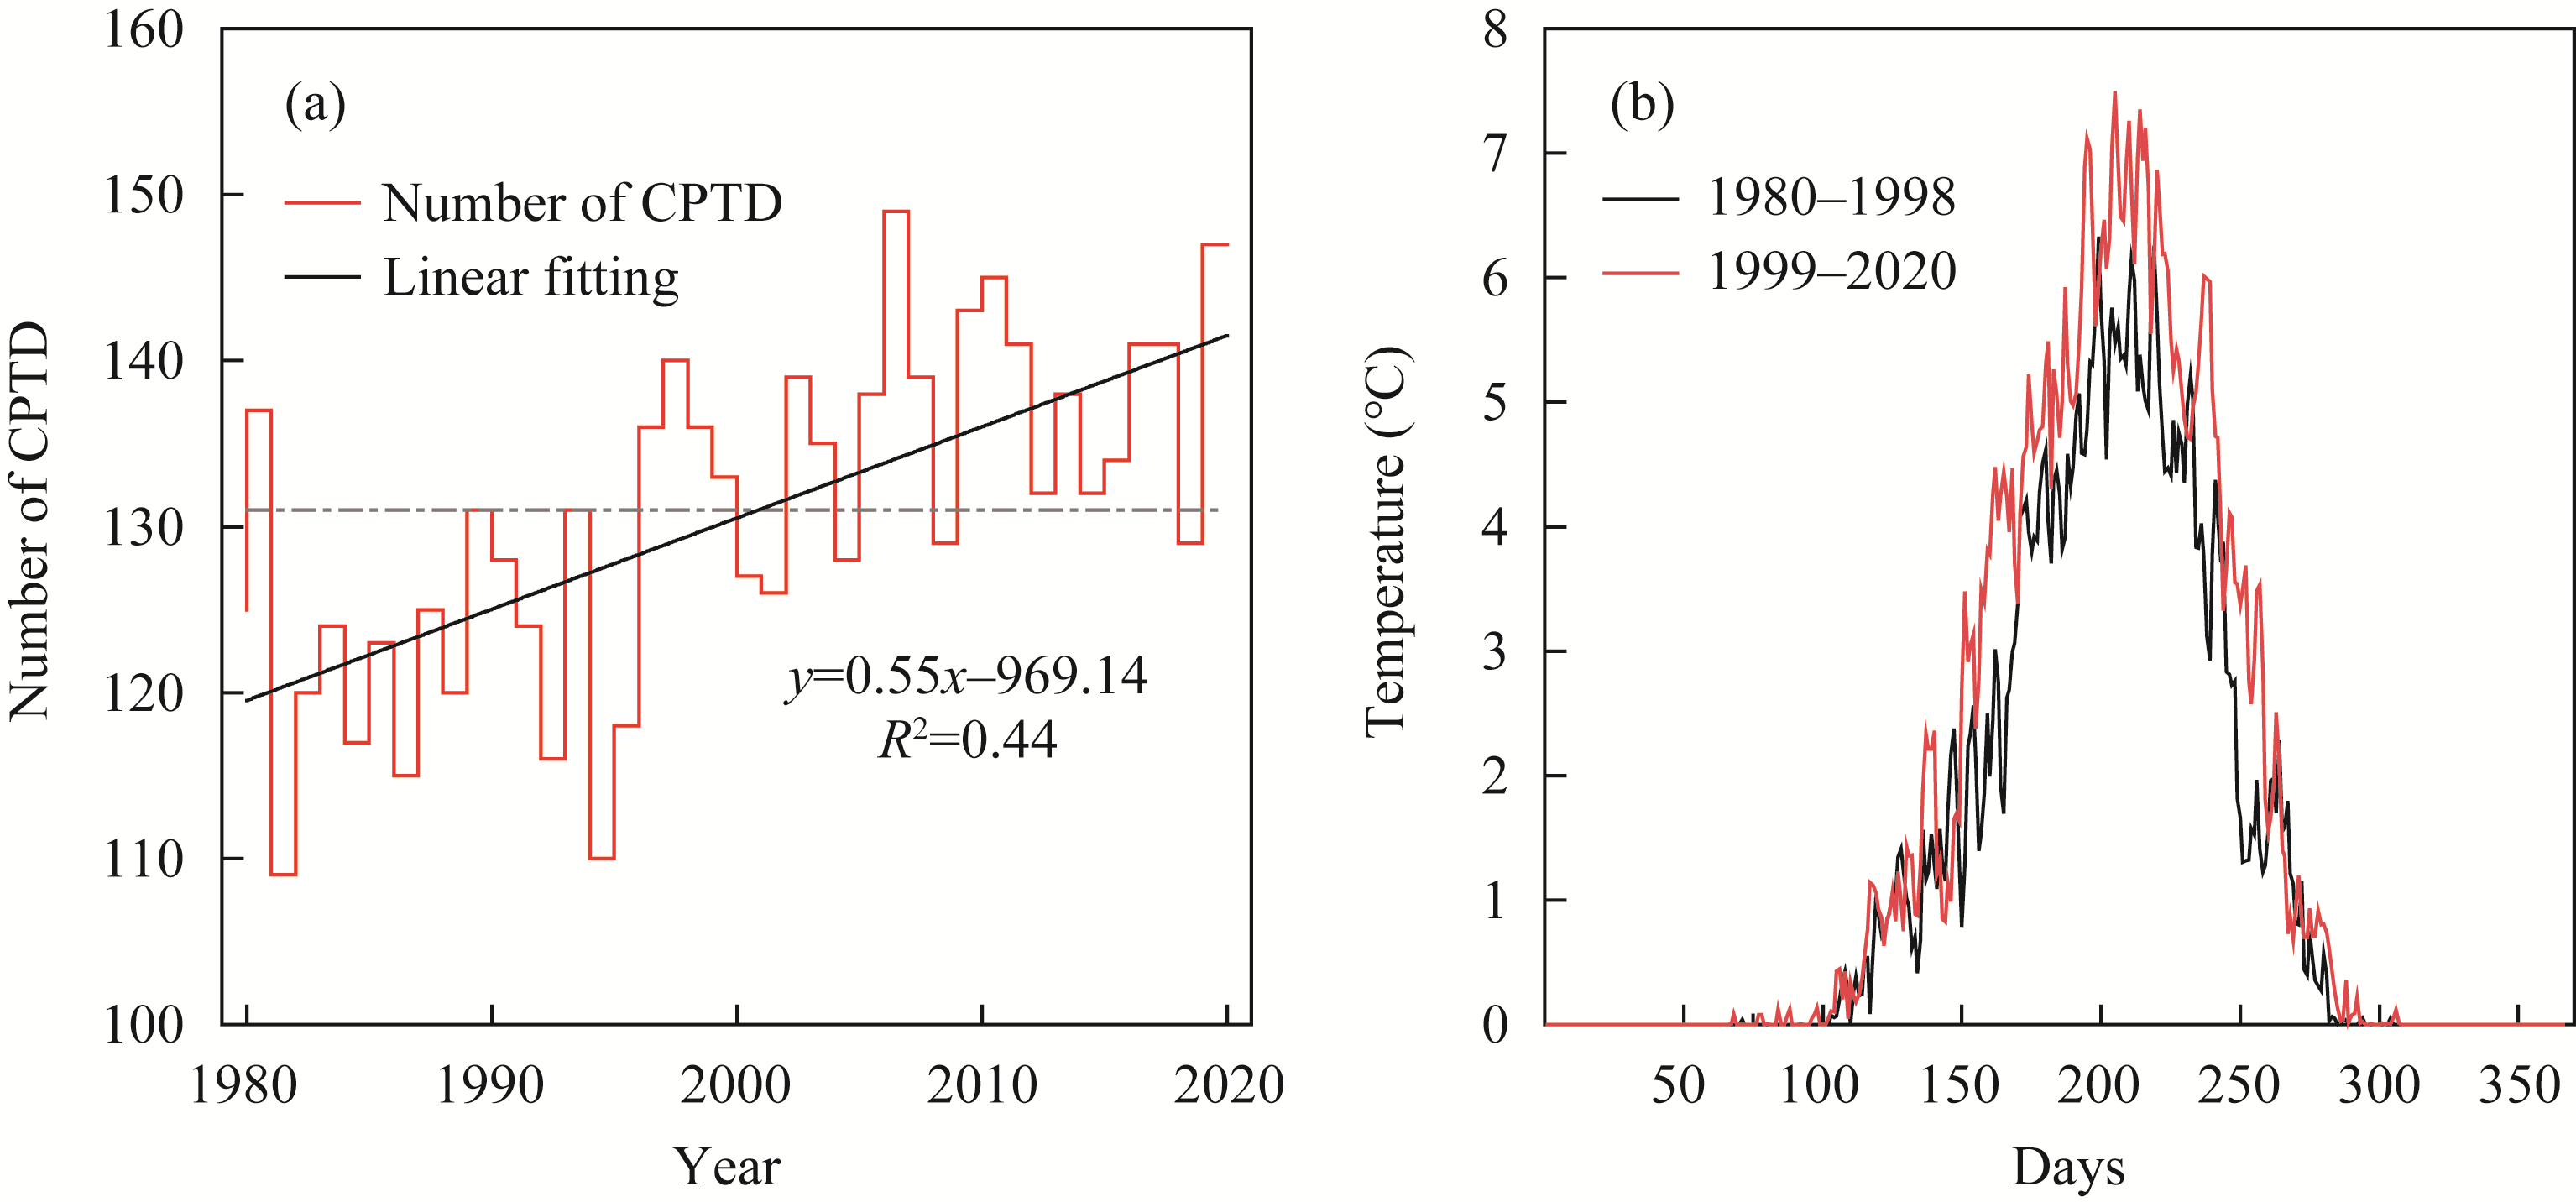
Abstract Glaciers are known as natural ''solid reservoirs'', and they play a dual role between the composition of water resources and the river runoff regulation in arid and semi-arid areas of China. In this study, we used in situ observation data from Urumqi Glacier No. 1, Xinjiang Uygur Autonomous Region, in combination with meteorological data from stations and a digital elevation model, to develop a distributed degree-day model for glaciers in the Urumqi River Basin to simulate glacier mass balance processes and quantify their effect on streamflow during 1980-2020. The results indicate that the mass loss and the equilibrium line altitude (ELA) of glaciers in the last 41 years had an increasing trend, with the average mass balance and ELA being -0.85 (±0.32) m w.e./a (meter water-equivalent per year) and 4188 m a.s.l., respectively. The glacier mass loss has increased significantly during 1999-2020, mostly due to the increase in temperature and the extension of ablation season. During 1980-2011, the average annual glacier meltwater runoff in the Urumqi River Basin was 0.48×10⁸ m3, accounting for 18.56% of the total streamflow. We found that the annual streamflow in different catchments in the Urumqi River Basin had a strong response to the changes in glacier mass balance, especially from July to August, and the glacier meltwater runoff increased significantly. In summary, it is quite possible that the results of this research can provide a reference for the study of glacier water resources in glacier-recharged basins in arid and semi-arid areas.
|
|
Received: 06 January 2022
Published: 30 April 2022
|
|
Corresponding Authors:
*LI Zhongqin (E-mail: lizq@lzb.ac.cn);XU Liping (E-mail: xlpalw@163.com)
|
|
|
| [1] |
Anant K, Negi H S, Kumar K, et al. 2018. Estimation of recent changes in thickness and mass balance of the Patsio glacier in the Great Himalayan region using geodetic technique and ancillary data. Geocarto International, 35(1): 47-63.
doi: 10.1080/10106049.2018.1506506
|
|
|
| [2] |
Azam M F, Wagnon P, Vincent C, et al. 2019. Snow and ice melt contributions in a highly glacierized catchment of Chhota Shigri Glacier (India) over the last five decades. Journal of Hydrology, 574: 760-773.
doi: 10.1016/j.jhydrol.2019.04.075
|
|
|
| [3] |
Azam M F, Srivastava S. 2020. Mass balance and runoff modelling of partially debris-covered Dokriani Glacier in monsoon-dominated Himalaya using ERA5 data since 1979. Journal of Hydrology, 590: 125432, doi: 10.1016/j.jhydrol. 2020.125432.
doi: 10.1016/j.jhydrol. 2020.125432
|
|
|
| [4] |
Bentley C R. 2012. Glossary of glacier mass balance and related terms. Arctic, Antarctic and Alpine Research, 44(2): 256-258.
|
|
|
| [5] |
Berghuijs W R, Woods R A, Hrachowitz M. 2014. A precipitation shift from snow towards rain leads to a decrease in streamflow. Nature Climate Change, 4(7): 583-586.
doi: 10.1038/nclimate2246
|
|
|
| [6] |
Bhattacharya A, Bolch T, Mukherjee K, et al. 2021. High Mountain Asian glacier response to climate revealed by multi-temporal satellite observations since the 1960s. Nature Communications, 12(1): 4133-4133.
doi: 10.1038/s41467-021-24180-y
pmid: 34226559
|
|
|
| [7] |
Bolch T, Kulkarni A V, Kb A, et al. 2012. The state and fate of Himalayan glaciers. Science, 336(6079): 310-314.
doi: 10.1126/science.1215828
pmid: 22517852
|
|
|
| [8] |
Braithwaite R J. 1995. Positive degree-day factors for ablation on the Greenland ice sheet studied by energy-balance modelling. Journal of Glaciology, 41(137): 153-160.
doi: 10.1017/S0022143000017846
|
|
|
| [9] |
Braithwaite R J, Zhang Y. 2000. Sensitivity of mass balance of five Swiss glaciers to temperature changes assessed by tuning a degree-day model. Journal of Glaciology, 46(152): 7-14.
doi: 10.3189/172756500781833511
|
|
|
| [10] |
Brun F, Berthier E, Wagnon P, et al. 2017. A spatially resolved estimate of High Mountain Asia glacier mass balances from 2000 to 2016. Nature Geoscience, 10(9): 668-673.
doi: 10.1038/ngeo2999
|
|
|
| [11] |
Cai X R, Li Z Q, Zhang H, et al. 2021. Vulnerability of glacier change in the Tianshan Mountains region of China. Journal of Geographical Sciences, 31(10): 1469-1489.
doi: 10.1007/s11442-021-1907-z
|
|
|
| [12] |
Deng H J, Chen Y N, Li Y. 2019. Glacier and snow variations and their impacts on regional water resources in mountains. Journal of Geographical Sciences, 29(1): 84-100.
doi: 10.1007/s11442-019-1585-2
|
|
|
| [13] |
Fujita K. 2008. Effect of precipitation seasonality on climatic sensitivity of glacier mass balance. Earth and Planetary Science Letters, 276(1-2): 14-19.
doi: 10.1016/j.epsl.2008.08.028
|
|
|
| [14] |
Geck J, Hock R, Loso M G, et al. 2021. Modeling the impacts of climate change on mass balance and discharge of Eklutna Glacier, Alaska, 1985-2019. Journal of Glaciology, 67(265): 909-920.
doi: 10.1017/jog.2021.41
|
|
|
| [15] |
Hantel M, Ehrendorfer M, Haslinger A. 2015. Climate sensitivity of snow cover duration in Austria. International Journal of Climatology, 20(6): 615-640.
doi: 10.1002/(SICI)1097-0088(200005)20:6<615::AID-JOC489>3.0.CO;2-0
|
|
|
| [16] |
Hock R. 2003. Temperature index melt modelling in mountain areas. Journal of Hydrology, 282(1): 104-115.
doi: 10.1016/S0022-1694(03)00257-9
|
|
|
| [17] |
Huai B J, Li Z Q, Wang S J, et al. 2014. RS analysis of glaciers change in the Heihe River Basin, Northwest China, during the recent decades. Journal of Geographical Sciences, 24(6): 993-1008.
doi: 10.1007/s11442-014-1133-z
|
|
|
| [18] |
Huai B J, Wang Y T, Li Z Q, et al. 2018. Glacier changes and its effect on water resources in Urumqi River Basin, Tianshan Mountains, China, from 1964 to 2014. Arabian Journal of Geosciences, 11(22): 716.
doi: 10.1007/s12517-018-4094-1
|
|
|
| [19] |
Huai B J, Sun W J, Wang J Y, et al. 2020. A long glacier mass balance record analysis in Chinese Urumqi Glacier No. 1 and the relationships with changes in large-scale circulations. Arabian Journal of Geosciences, 13(22): 1202.
doi: 10.1007/s12517-020-06224-7
|
|
|
| [20] |
Huintjes E, Li H L, Sauter T, et al. 2010. Degree-day modelling of the surface mass balance of Urumqi Glacier No. 1, Tian Shan, China. The Cryosphere Discussions, 4(1): 207.
|
|
|
| [21] |
Immerzeel W W, Lutz A F, Andrade M, et al. 2019. Importance and vulnerability of the world's water towers. Nature, 577: 364-369.
doi: 10.1038/s41586-019-1822-y
|
|
|
| [22] |
Jóhannesson T, Sigurdsson O, Laumann T, et al. 2017. Degree-day glacier mass-balance modelling with applications to glaciers in Iceland, Norway and Greenland. Journal of Glaciology, 41(138): 345-358.
doi: 10.1017/S0022143000016221
|
|
|
| [23] |
Jansson P, Hock R, Schneider T. 2003. The concept of glacier storage: a review. Journal of Hydrology, 282(1-4): 116-129.
doi: 10.1016/S0022-1694(03)00258-0
|
|
|
| [24] |
Li H L, Wang P Y, Li Z Q, et al. 2021. An application of three different field methods to monitor changes in Urumqi Glacier No. 1, Chinese Tien Shan, during 2012-2018. Journal of Glaciology, 68(627): 41-53.
doi: 10.1017/jog.2021.71
|
|
|
| [25] |
Li K M, Zhong X F, Jiang Y, et al. 2018. Study on vertical gradient change of air temperature and precipitation in Urumqi River basin during 1961-2016. Journal of Glaciology and Geocryology, 40(3): 607-615. (in Chinese)
|
|
|
| [26] |
Li Y, Li Z Q. 2020. Temporal and spatial characteristics of climate changes in the Urumqi River Basin of Tianshan Mountain over 50 years. Meteorological and Environmental Research, 1(12): 42-45.
|
|
|
| [27] |
Li Z Q, Li C J, Li Y F, et al. 2007. Preliminary results from measurements of selected trace metals in the snow-firn pack on Urumqi Glacier No. 1, eastern Tien Shan, China. Journal of Glaciology, 53(182): 368-373.
doi: 10.3189/002214307783258486
|
|
|
| [28] |
Li Z Q, Wang F T, Li H L, et al. 2018. Science and long-term monitoring of continental-type glaciers in arid region in China. Bulletin of the Chinese Academy of Sciences, 33(12): 1381-1390. (in Chinese)
|
|
|
| [29] |
Liu Y, Liu Y C, Jiao K Q, et al. 2019. Advances on water respurces research in upprt reaches of the Urumqi River since 1990. Journal of Glaciology and Geocryology, 41(4): 958-967. (in Chinese)
|
|
|
| [30] |
Liu S Y, Ding Y J, Wang N L, et al. 1998. Mass balance sensitivity to climate change of the glacier NO.1 at the Urumqi River head, Tianshan Mts. Journal of Glaciology and Geocryology, 20(1): 10-14. (in Chinese)
|
|
|
| [31] |
Org Z. 2015. World population and human capital in the twenty-first century. Canadian Sudies in Population, 42(3-4): 91.
|
|
|
| [32] |
Pritchard H D. 2017. Asia's glaciers are a regionally important buffer against drought. Nature, 545(7653): 169-174.
doi: 10.1038/nature22062
|
|
|
| [33] |
Saydi M, Ding J L, Sagan V, et al. 2019. Snowmelt modeling using two melt-rate models in the Urumqi River watershed, Xinjiang Uygur Autonomous Region, China. Journal of Mountain Science, 16(10): 2271-2284.
doi: 10.1007/s11629-018-5365-8
|
|
|
| [34] |
Shea J M, Immerzeel W W, Wagnon P, et al. 2015. Modelling glacier change in the Everest region, Nepal Himalaya. The Cryosphere, 9(3): 1105-1128.
doi: 10.5194/tc-9-1105-2015
|
|
|
| [35] |
Shi Y F, Liu S Y. 2000. Estimation on the response of glaciers in China to the global warming in the 21st century. Chinese Science Bulletin, 45(7): 668-672.
doi: 10.1007/BF02886048
|
|
|
| [36] |
Slangen A, Church J A, Agosta C, et al. 2016. Anthropogenic forcing dominates global mean sea-level rise since 1970. Nature Climate Change, 6(7): 701-705.
doi: 10.1038/NCLIMATE2991
|
|
|
| [37] |
Tong K, Su F, Xu B. 2016. Quantifying the contribution of glacier meltwater in the expansion of the largest lake in Tibet. Journal of Geophysical Research Atmospheres, 121(19): 11158-11173.
|
|
|
| [38] |
Tsai V C, Ruan X Z. 2018. A simple physics-based improvement to the positive degree day model. Journal of Glaciology, 64(246): 661-668.
doi: 10.1017/jog.2018.55
|
|
|
| [39] |
Wang P P, Li Z Q, Xu C H, et al. 2021. Region-wide glacier area and mass budgets for the Shaksgam River Basin, Karakoram Mountains, during 2000-2016. Journal of Arid Land, 13(2): 175-188.
doi: 10.1007/s40333-021-0095-z
|
|
|
| [40] |
Wang P Y, Li Z Q, Schneider C, et al. 2020. A test study of an energy and mass balance model application to a site on Urumqi Glacier No. 1, Chinese Tian Shan. Water, 12(10): 2865, doi: 10.3390/w12102865.
doi: 10.3390/w12102865
|
|
|
| [41] |
Wang S, Wang J, Pu J C. 2016. Application of a distributed degree-day model of glaciers in the upper reaches of the Beida River Basin. Environmental Earth Sciences, 75(6): 493.
doi: 10.1007/s12665-015-4973-7
|
|
|
| [42] |
Wu L H, Li H L, Wang L. 2011. Application of a degree-day model for determination of mass balance of Urumqi Glacier No. 1, eastern Tianshan, China. Journal of Earth Science, 22(4): 470-481.
doi: 10.1007/s12583-011-0201-x
|
|
|
| [43] |
Xing W C, Li Z Q, Zhang H, et al. 2018. Spatial-temporal variation of glacier resources in Chinese Tianshan Mountains since 1959. Acta Geographica Sinica, 72(9): 1594-1605. (in Chinese)
|
|
|
| [44] |
Xu C H, Li Z Q, Wang F T, et al. 2017. Using an ultra-long-range terrestrial laser scanner to monitor the net mass balance of Urumqi Glacier No. 1, eastern Tien Shan, China, at the monthly scale. Journal of Glaciology, 63(241): 1-11.
doi: 10.1017/jog.2016.103
|
|
|
| [45] |
Xu L P, Li P H, Li Z Q, et al. 2020. Advances in research on changes and effects of glaciers in Xinjiang Mountains. Advances in Water Science, 31(06): 946-959. (in Chinese)
|
|
|
| [46] |
Yang Z N. 1981. The basic characteristics of runoff in the modern glaciation areas of China. Scientia Sinica, 4: 468-476. (in Chinese)
|
|
|
| [47] |
Zhang H, Li Z Q, Zhou P. 2021. Mass balance reconstruction for Shiyi Glacier in the Qilian Mountains, northeastern Tibetan Plateau, and its climatic drivers. Climate Dynamics, 56(3): 969-984.
doi: 10.1007/s00382-020-05514-w
|
|
|
| [48] |
Zhang Y, Enomoto H, Ohata T, et al. 2017. Glacier mass balance and its potential impacts in the Altai Mountains over the period 1990-2011. Journal of Hydrology, 553: 662-677.
doi: 10.1016/j.jhydrol.2017.08.026
|
|
|
| [49] |
Zhu M L, Yao T D, Xie Y, et al. 2020. Mass balance of Muji Glacier, northeastern Pamir, and its controlling climate factors. Journal of Hydrology, 590(195): 125447, doi: 10.1016/j.jhydrol.2020.125447.
doi: 10.1016/j.jhydrol.2020.125447
|
|
|
|
Viewed |
|
|
|
Full text
|
|
|
|
|
Abstract
|
|
|
|
|
Cited |
|
|
|
|
| |
Shared |
|
|
|
|
| |
Discussed |
|
|
|
|