| Research article |
|

|
|
|
| Spatial and temporal gradients in the rate of dust deposition and aerosol optical thickness in southwestern Iran |
Mansour A FOROUSHANI*( ), Christian OPP, Michael GROLL ), Christian OPP, Michael GROLL |
| Department of Geography, Philipps-Universität Marburg, Marburg 35037, Germany |
|
|
|
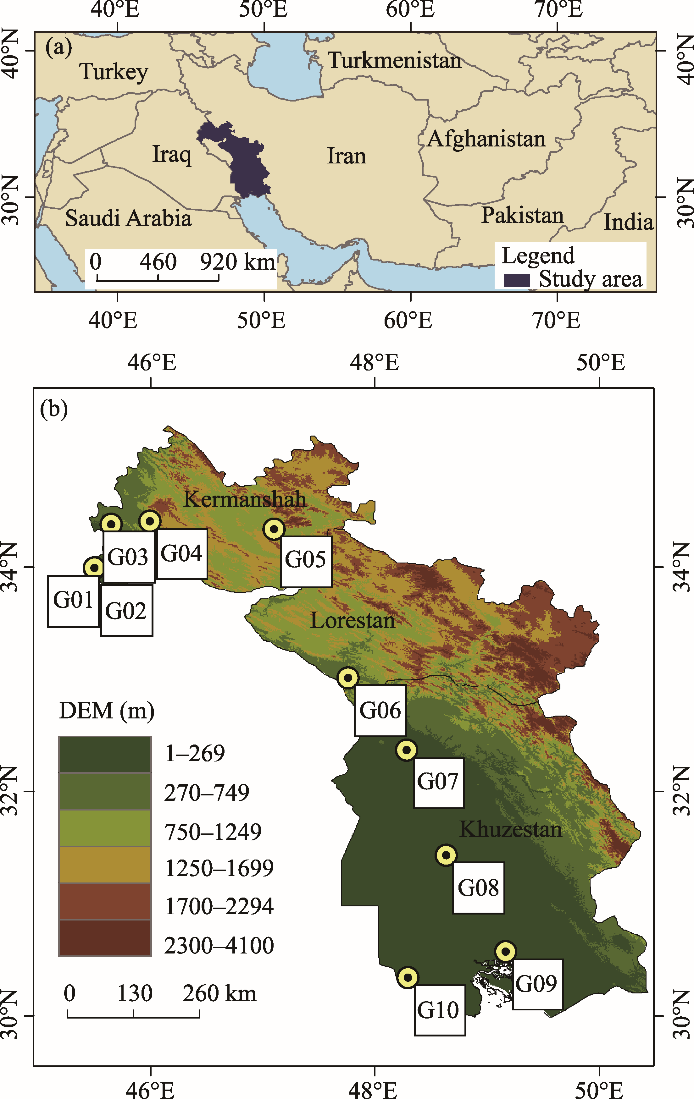
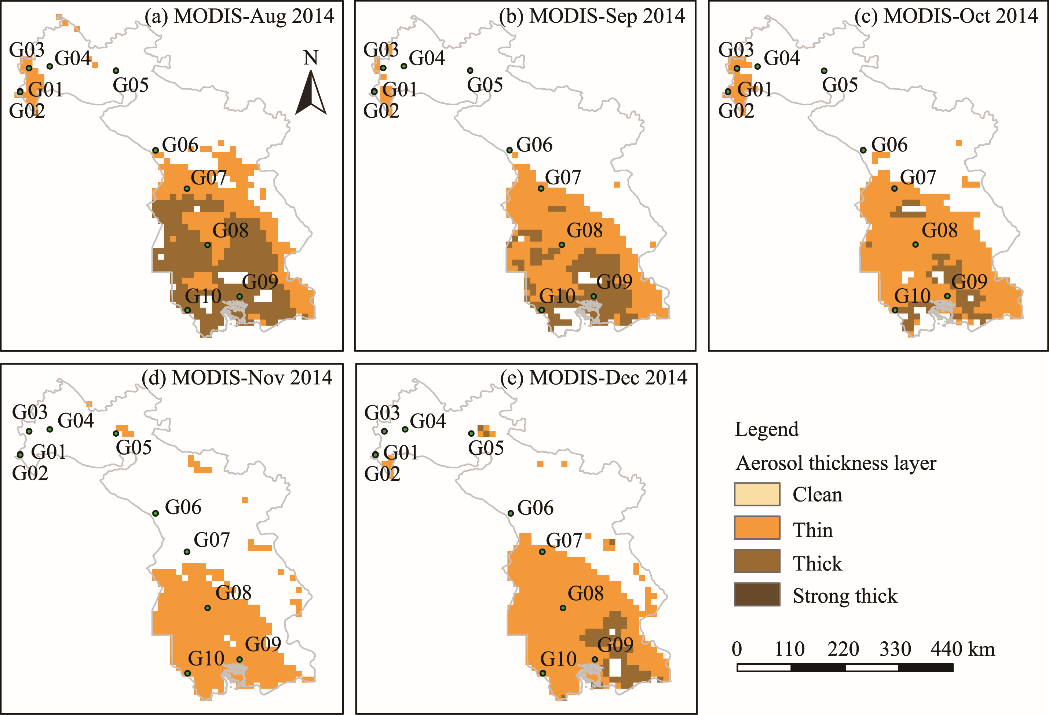
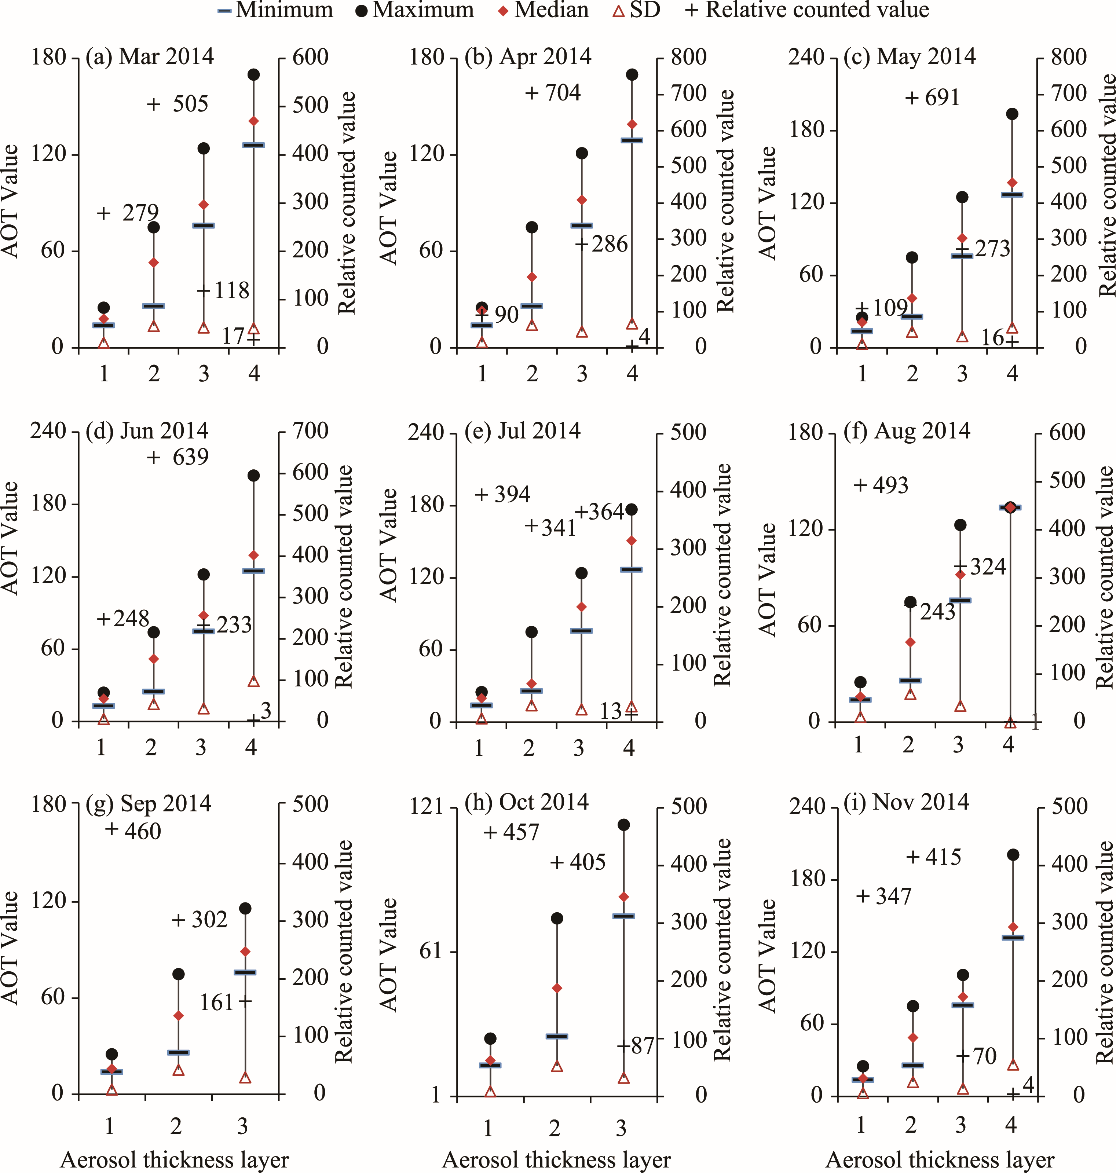
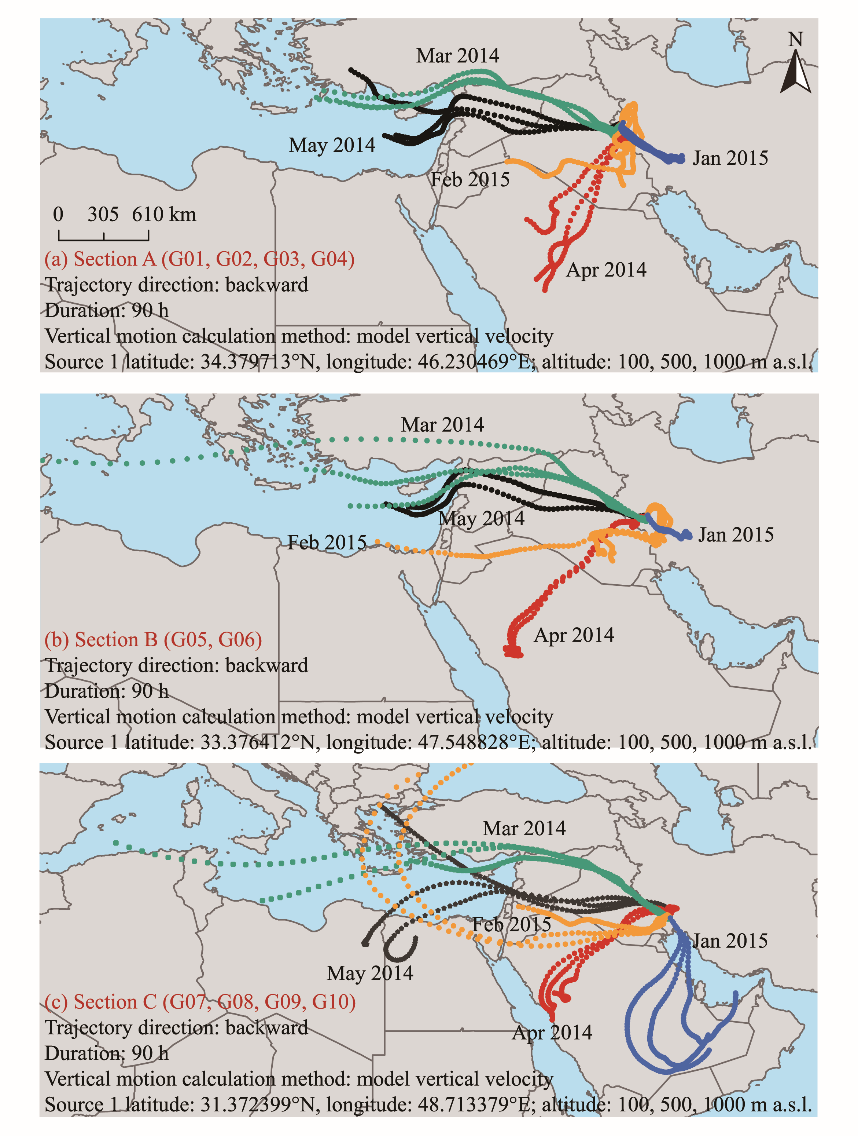
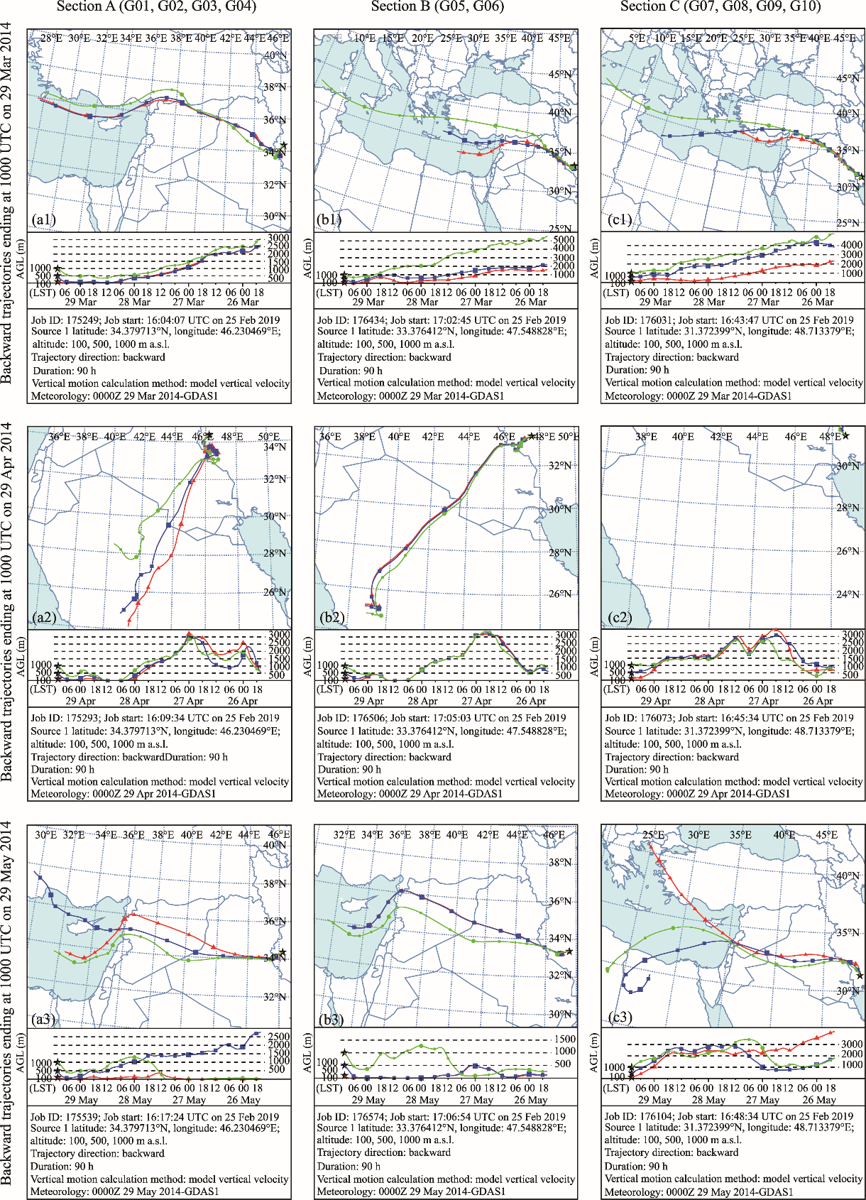
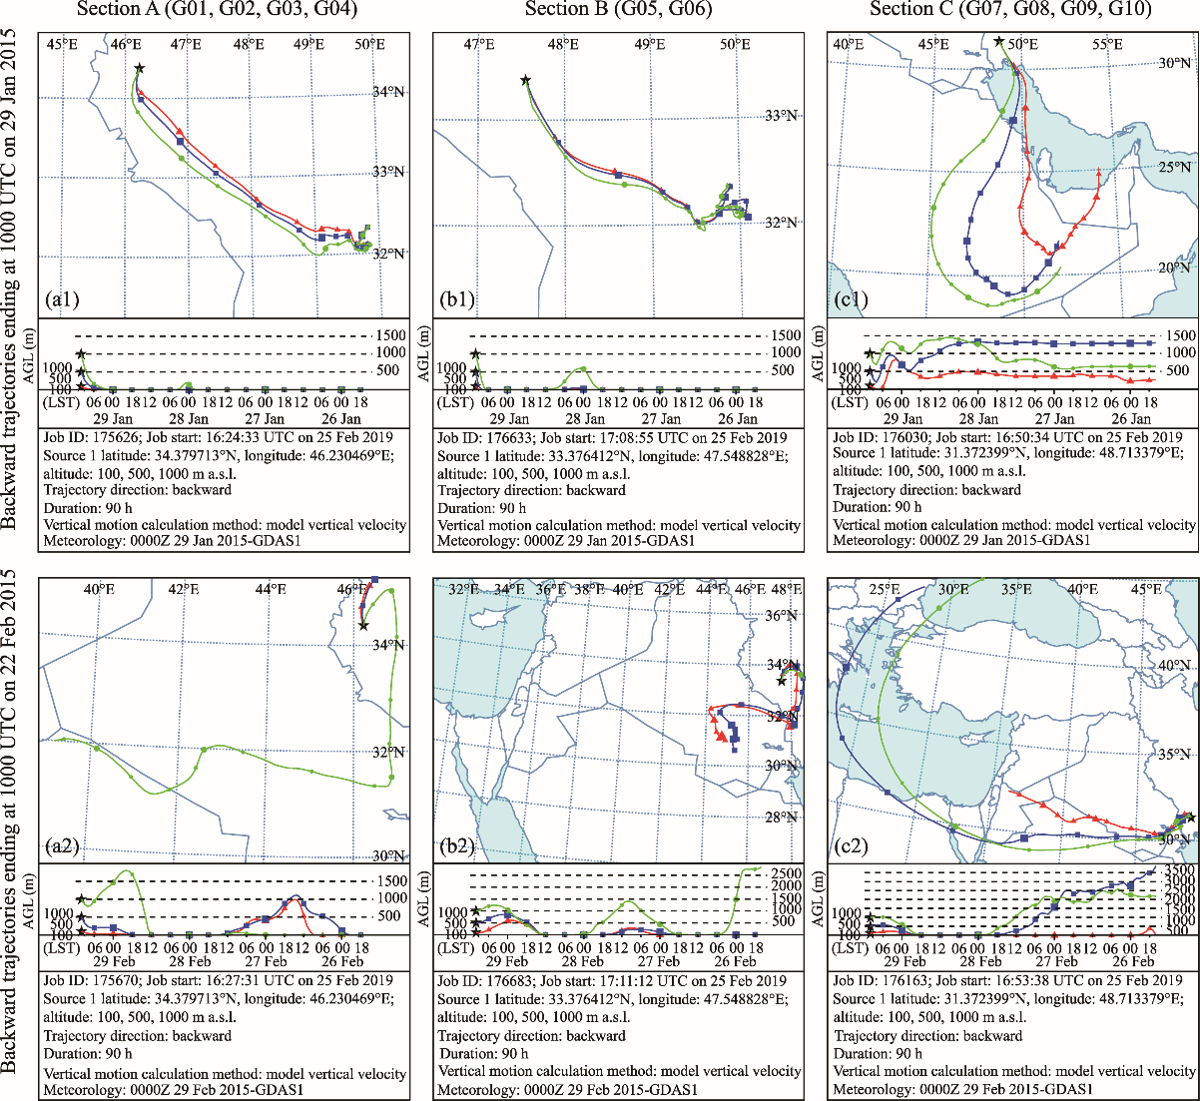
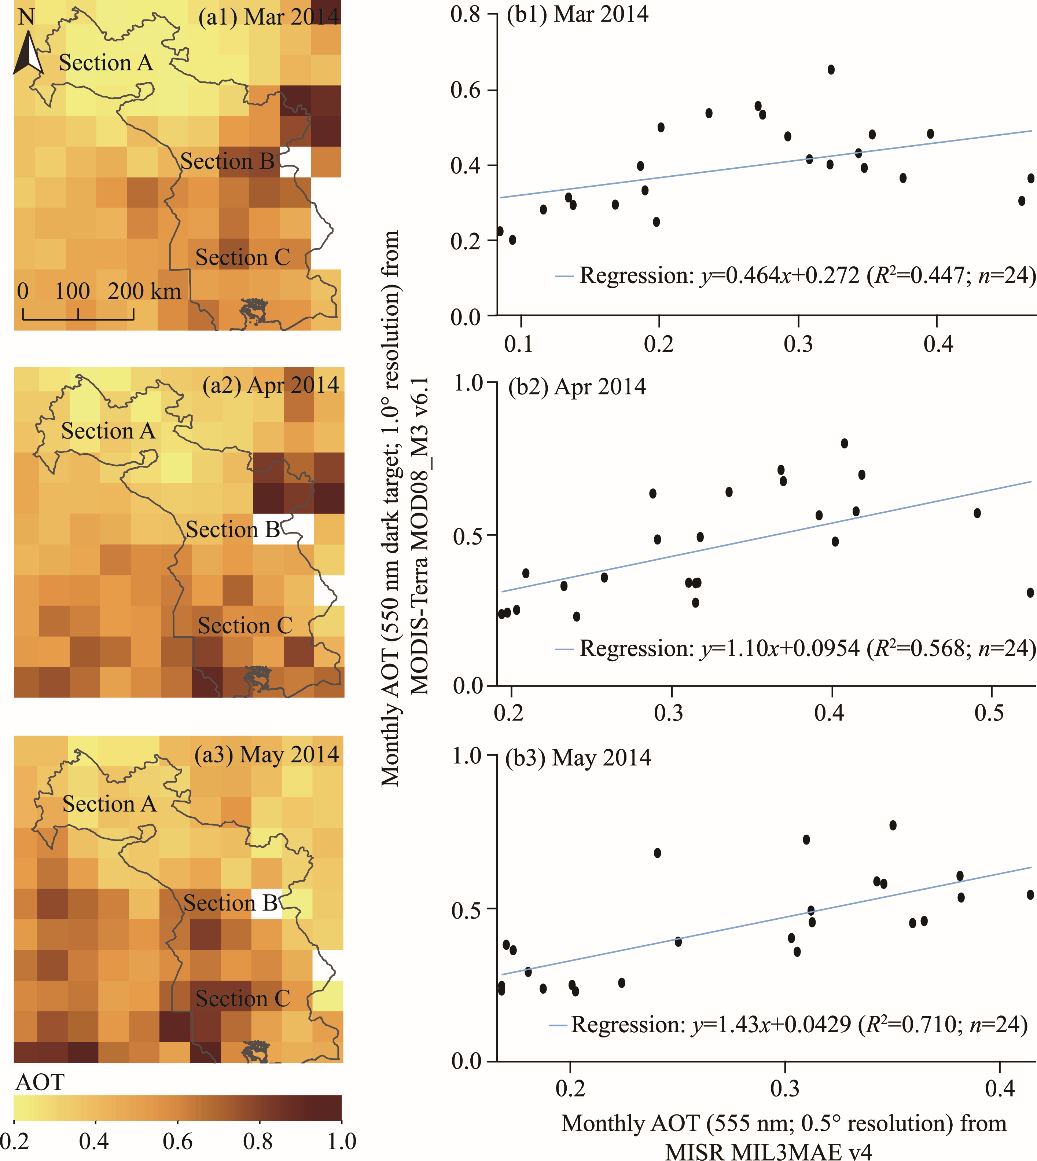
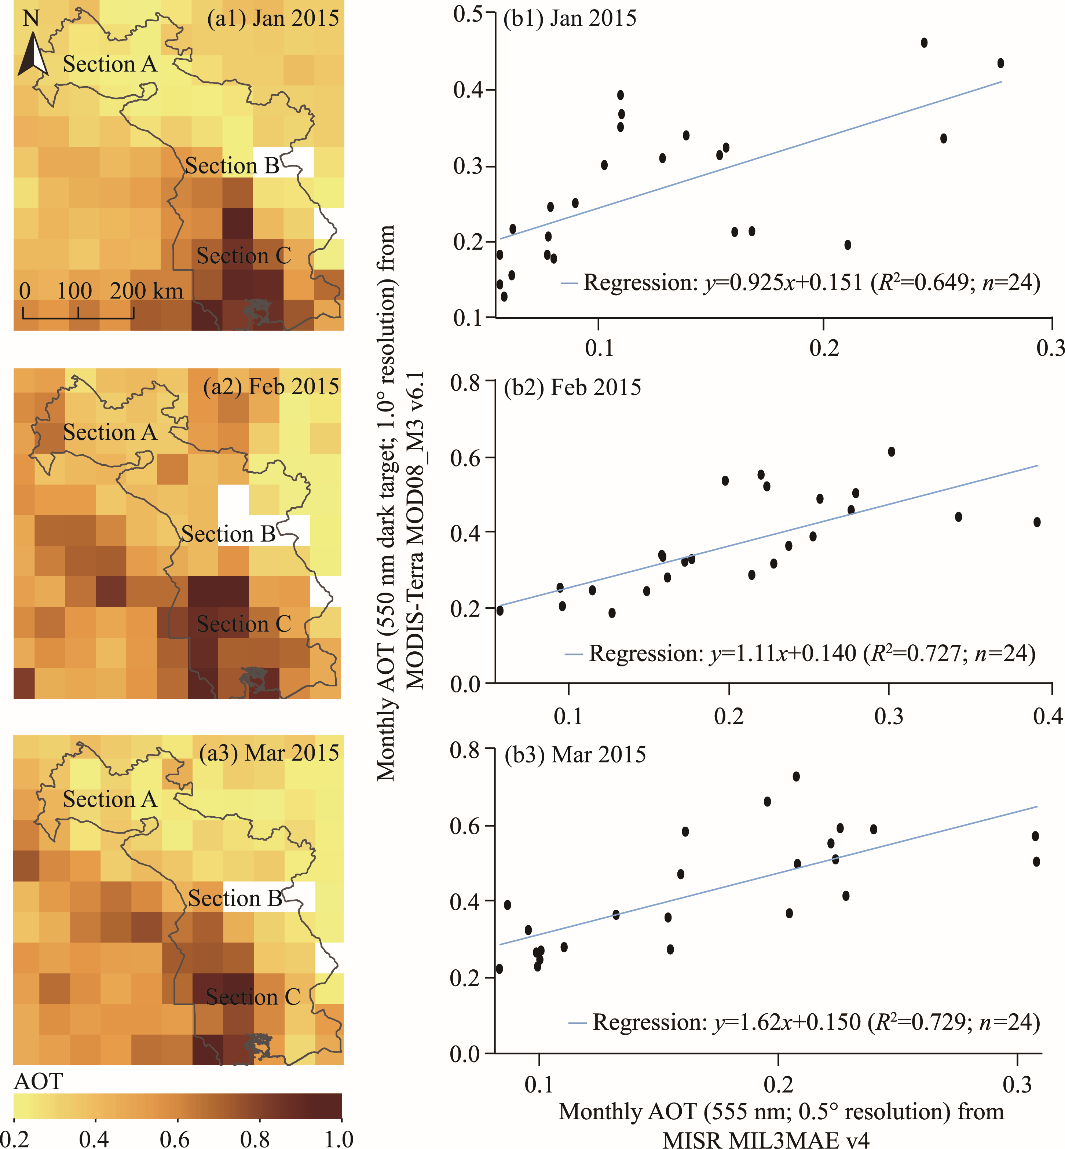
Abstract The southwestern Iran is one of the regions that are most prone to dust events. The objective of this study is the analysis of the spatial and temporal distributions of dust deposition rate as a key factor for finding the relative impact of the dust. First, the monthly mean aerosol optical thickness (AOT) from Moderate Resolution Imaging Spectroradiometer (MODIS) was analyzed and compared with the dust amount variations from ground deposition rate (GDR), and the results were further used to investigate the spatial and temporal distributions of dust events in southwestern Iran for the period between 2014 and 2015. Moving air mass trajectories, using the Hybrid Single-Particle Lagrangian Integrated Trajectory (HYSPLIT) model, were proven to be a discriminator of their local and regional origin. The results from GDR analysis produced a correlation coefficient between dust event history and deposition rates at dust magnitudes of >0.93 that is meaningful at the 95% confidence level. Furthermore, the deposition rates varied from 3 g/m2 per month in summer to 10 g/m2 per month in spring and gave insight into the transport direction of the dust. Within the same time series, AOT correspondences with MODIS on Terra in four aerosol thickness layers (clean, thin, thick, and strong thick) were shown in relation to each other. The deepest mixed layers were observed in spring and summer with a thickness of approximately 3500 m above ground level in the study area. Investigations of ground-based observations were correlated with the same variations for each aerosol thickness layer from MODIS images and they can be applied to discriminate layers of aeolian dust from layers of other aerosols. Together, dust distribution plots from AOT participated to enhance mass calculations and estimation deposition rates from the thick and strong thick aerosol thickness layers using the results from GDR. Despite all the advances of AOT, under certain circumstances, ground-based observations are better able to represent aerosol conditions over the study area, which were tested in southwestern Iran, even though the low number of observations is a commonly acknowledged drawback of GDR.
|
|
Received: 25 June 2019
Published: 10 January 2021
|
|
Corresponding Authors:
|
About author: *Mansour A FOROUSHANI (E-mail: mforoushani@gmail.com)
|
|
|
| [1] |
Abbasi H R, Opp C, Groll M, et al. 2018. Spatial and temporal variation of the aeolian sediment transport in the ephemeral Baringak Lake (Sistan Plain, Iran) using field measurements and geostatistical analyses. Zeitschrift Für Geomorphologie, 61(4): 315-326.
|
|
|
| [2] |
Abdou W A, Diner D J, Martonchik J V, et al. 2005. Comparison of coincident Multiangle Imaging Spectroradiometer and Moderate Resolution Imaging Spectroradiometer aerosol optical depths over land and ocean scenes containing Aerosol Robotic Network sites. Journal of Geophysical Research: Atmospheres, 110(D10): D10S07, doi: 10.1029/2004jd004693.
|
|
|
| [3] |
Alizadeh C O, Zawar-Reza P, Sturman A. 2013. Low level jet intensification by mineral dust aerosols. Annales Geophysicae, 31(4): 625-632.
|
|
|
| [4] |
Arimoto R, Ray B J, Lewis N F, et al. 1997. Mass-particle size distributions of atmospheric dust and the dry deposition of dust to the remote ocean. Journal of Geophysical Research: Atmospheres, 102(D13): 15867-15874.
|
|
|
| [5] |
Ashrafi K, Shafiepour-Motlagh M, Aslemand A, et al. 2014. Dust storm simulation over Iran using HYSPLIT. Journal of Environmental Health Science and Engineering, 12(1): 9, doi: 10.1186/2052-336x-12-9.
pmid: 24397928
|
|
|
| [6] |
ASTER Science Team. 2001. NASA EOSDIS Land Processes DAAC [Map]. NASA/METI/AIST/Japan Space Systems, and U.S./Japan. [2017-11-05]. https://lpdaac.usgs.gov/products/astgtmv002/.
|
|
|
| [7] |
Balakrishnaiah G, Kumar K R, Reddy B S K, et al. 2012. Spatio-temporal variations in aerosol optical and cloud parameters over southern India retrieved from MODIS satellite data. Atmospheric Environment, 47: 435-445.
|
|
|
| [8] |
Banks J R, Brindley H E, Stenchikov G, et al. 2017. Satellite retrievals of dust aerosol over the Red Sea and the Persian Gulf (2005-2015). Atmospheric Chemistry and Physics, 17(6): 3987-4003.
|
|
|
| [9] |
Bieringer P E, Young G S, Rodriguez L M, et al. 2017. Paradigms and commonalities in atmospheric source term estimation methods. Atmospheric Environment, 156: 102-112.
|
|
|
| [10] |
Binietoglou I, Basart S, Alados-Arboledas L, et al. 2015. A methodology for investigating dust model performance using synergistic EARLINET/AERONET dust concentration retrievals (Discussion paper). Atmospheric Measurement Techniques, 8: 3577-3600.
|
|
|
| [11] |
Breider T J, Mickley L J, Jacob D J, et al. 2014. Annual distributions and sources of Arctic aerosol components, aerosol optical depth, and aerosol absorption. Journal of Geophysical Research: Atmospheres, 119(7): 4107-4124.
|
|
|
| [12] |
Cazacu M M, Tudose O, Balanici D, et al. 2018. Research and development of commercial lidar systems in Romania: Critical review of the ESYRO lidar systems developed by scenviroscopy SRL (ESYRO). European Physical Journal Conferences, 176: 11005, doi: 10.1051/epjconf/201817611005.
|
|
|
| [13] |
Cesnulyte V, Lindfors A V, Pitkänen M R A, et al. 2014. Comparing ECMWF AOD with AERONET observations at visible and UV wavelengths. Atmospheric Chemistry and Physics, 14(2): 593-608.
doi: 10.5194/acp-14-593-2014
|
|
|
| [14] |
Chai T, Draxler R, Stein A. 2015. Source term estimation using air concentration measurements and a Lagrangian dispersion model: Experiments with pseudo and real cesium-137 observations from the Fukushima nuclear accident. Atmospheric Environment, 106: 241-251.
|
|
|
| [15] |
Chen B, Stein A F, Maldonado P G, et al. 2013. Size distribution and concentrations of heavy metals in atmospheric aerosols originating from industrial emissions as predicted by the HYSPLIT model. Atmospheric Environment, 71: 234-244.
|
|
|
| [16] |
Crosbie E, Youn J S, Balch B, et al. 2015. On the competition among aerosol number, size and composition in predicting CCN variability: A multi-annual field study in an urbanized desert. Atmospheric Chemistry and Physics, 15(12): 6943-6958.
|
|
|
| [17] |
de Longueville F, Ozer P, Doumbia S, et al. 2013. Desert dust impacts on human health: An alarming worldwide reality and a need for studies in West Africa. International Journal of Biometeorology, 57(1): 1-19.
doi: 10.1007/s00484-012-0541-y
pmid: 22552909
|
|
|
| [18] |
di Girolamo L, Bond T, Bramer D, et al. 2004. Analysis of Multi-angle Imaging SpectroRadiometer (MISR) aerosol optical depths over greater India during winter 2001-2004. Geophysical Research Letters, 31(23): 1-5.
|
|
|
| [19] |
Dindaroğlu T. 2014. The use of the GIS Kriging technique to determine the spatial changes of natural radionuclide concentrations in soil and forest cover. Journal of Environmental Health Science and Engineering, 12(1): 130-130.
doi: 10.1186/s40201-014-0130-6
pmid: 25379185
|
|
|
| [20] |
Diner D J, Beckert J C, Reilly T H, et al. 1998. Multi-angle Imaging SpectroRadiometer (MISR) instrument description and experiment overview. IEEE Transactions on Geoscience and Remote Sensing, 36(4): 1072-1087.
|
|
|
| [21] |
Diner D J, Abdou W A, Bruegge C J, et al. 2001. MISR aerosol optical depth retrievals over southern Africa during the SAFARI-2000 dry season campaign. Geophysical Research Letters, 28(16): 3127-3130.
doi: 10.1029/2001GL013188
|
|
|
| [22] |
Draxler R R, Hess G. 1998. An overview of the HYSPLIT_4 modelling system for trajectories, dispersion, and deposition. Australian Meteorological Magazine, 47(4): 295-308.
|
|
|
| [23] |
Dubovik O, Holben B, Eck T F, et al. 2002. Variability of absorption and optical properties of key aerosol types observed in worldwide locations. Journal of the Atmospheric Sciences, 59(3): 590-608.
doi: 10.1175/1520-0469(2002)059<0590:VOAAOP>2.0.CO;2
|
|
|
| [24] |
Fiedler S, Schepanski K, Knippertz P, et al. 2014. How important are atmospheric depressions and mobile cyclones for emitting mineral dust aerosol in North Africa? Atmospheric Chemistry and Physics, 14(17): 8983-9000.
|
|
|
| [25] |
Foroushani M A, Opp C, Groll M. 2019. Chemical characterization of aeolian dust deposition in southern and western Iran. Asian Journal of Geographical Research, 2(2): 1-22.
|
|
|
| [26] |
Franklin M, Kalashnikova O V, Garay M J, et al. 2018. Characterization of subgrid-scale variability in particulate matter with respect to satellite aerosol observations. Remote Sensing, 10(4): 623, doi: ARTN 623 10.3390/rs10040623.
|
|
|
| [27] |
Gao Q, Li L, Zhang Y, et al. 2000. Studies on the springtime dust storm of China. China Environmental Science, 20(6): 495-500. (in Chinese)
|
|
|
| [28] |
Geogdzhayev I V, Mishchenko M I, Liu L, et al. 2004. Global two-channel AVHRR aerosol climatology: Effects of stratospheric aerosols and preliminary comparisons with MODIS and MISR retrievals. Journal of Quantitative Spectroscopy and Radiative Transfer, 88(1-3): 47-59.
|
|
|
| [29] |
Gerivani H, Lashkaripour G R, Ghafoori M, et al. 2011. The source of dust storm in Iran: A case study based on geological information and rainfall data. Carpathian Journal of Earth and Environmental Sciences, 6(1): 297-308.
|
|
|
| [30] |
Golitsyn G, Gillette D A. 1993. Introduction: A joint soviet-American experiment for the study of Asian desert dust and its impact on local meteorological conditions and climate. Atmospheric Environment. Part A. General Topics, 27(16): 2467-2470.
|
|
|
| [31] |
Groll M, Opp C, Aslanov I. 2013. Spatial and temporal distribution of the dust deposition in Central Asia-results from a long term monitoring program. Aeolian Research, 9: 49-62.
|
|
|
| [32] |
Hu H. 1990. The distribution, regionalization and prospect of China's population. Acta Geographica Sinica, 57(2): 139-145.
|
|
|
| [33] |
Huang J, Minnis P, Yan H, et al. 2010. Dust aerosol effect on semi-arid climate over Northwest China detected from A-Train satellite measurements. Atmospheric Chemistry and Physics, 10(14): 6863-6872.
|
|
|
| [34] |
Huang J P, Minnis P, Yi Y H, et al. 2007. Summer dust aerosols detected from CALIPSO over the Tibetan Plateau. Geophysical Research Letters, 34(18), doi: 10.1029/2007gl029938.
|
|
|
| [35] |
Hutchinson M, Oh H, Chen W H. 2017. A review of source term estimation methods for atmospheric dispersion events using static or mobile sensors. Information Fusion, 36: 130-148.
|
|
|
| [36] |
IHS under License with ASTM. 2010. Standard Terminology Relating to Sampling and Analysis of Atmospheres. IHS under License with ASTM. [2014-12-25]. https://wenku.baidu.com/view/8324a4b765ce050876321358.
|
|
|
| [37] |
Iran Meteorological Organization. 2014. Precipitation Map.[2015-09-15]. http://www.irimo.ir/index.php?newlang=eng.
|
|
|
| [38] |
IRMO. 2016. I.R.OF IRAN Meteorological Organization. Dust National Center. [2015-09-15]. http://www.irimo.ir/far/index.php.
|
|
|
| [39] |
Jethva H, Satheesh S, Srinivasan J. 2007. Assessment of second-generation MODIS aerosol retrieval (Collection 005) at Kanpur, India. Geophysical Research Letters, 34(19), doi: 10.1029/2007GL029647.
|
|
|
| [40] |
Jiang X, Liu Y, Yu B, et al. 2007. Comparison of MISR aerosol optical thickness with AERONET measurements in Beijing metropolitan area. Remote Sensing of Environment, 107(1-2): 45-53.
|
|
|
| [41] |
Kaufman Y J, Koren I. 2006. Smoke and pollution aerosol effect on cloud cover. Science, 313(5787): 655-658.
doi: 10.1126/science.1126232
pmid: 16840661
|
|
|
| [42] |
Kharazmi R, Tavili A, Rahdari M R, et al. 2018. Monitoring and assessment of seasonal land cover changes using remote sensing: A 30-year (1987-2016) case study of Hamoun Wetland, Iran. Environmental Monitoring and Assessment, 190(6): 356, doi: 10.1007/s10661-018-6726-z.
doi: 10.1007/s10661-018-6726-z
pmid: 29796940
|
|
|
| [43] |
Kim H S, Chung Y S, Kim J T. 2014. Spatio-temporal variations of optical properties of aerosols in East Asia measured by MODIS and relation to the ground-based mass concentrations observed in central Korea during 2001-2010. Asia-Pacific Journal of Atmospheric Sciences, 50(2): 191-200.
|
|
|
| [44] |
Koren I, Kaufman Y J, Washington R, et al. 2006. The Bodélé depression: A single spot in the Sahara that provides most of the mineral dust to the Amazon forest. Environmental Research Letters, 1(1): 014005, doi: 10.1088/1748-9326/1/1/014005.
|
|
|
| [45] |
Lawrence C R, Neff J C. 2009. The contemporary physical and chemical flux of aeolian dust: A synthesis of direct measurements of dust deposition. Chemical Geology, 267(1-2): 46-63.
|
|
|
| [46] |
Levy R, Hsu C. 2015. MODIS Atmosphere L2 Aerosol Product. NASA MODIS Adaptive Processing System. Goddard Space Flight Center, USA.[2017-11-25]. http://dx.doi.org/10.5067/MODIS/MOD04_L2.006.
|
|
|
| [47] |
Levy R C, Mattoo S, Munchak L A, et al. 2013. The Collection 6 MODIS aerosol products over land and ocean. Atmospheric Measurement Techniques, 6(11): 2989-3034.
|
|
|
| [48] |
Liu L, Mishchenko M I. 2008. Toward unified satellite climatology of aerosol properties: Direct comparisons of advanced level 2 aerosol products. Journal of Quantitative Spectroscopy and Radiative Transfer, 109(14): 2376-2385.
|
|
|
| [49] |
Lolli S, Madonna F, Rosoldi M, et al. 2018. Impact of varying lidar measurement and data processing techniques in evaluating cirrus cloud and aerosol direct radiative effects. Atmospheric Measurement Techniques, 11(3): 1639-1651.
|
|
|
| [50] |
Maiti D, Prasad B. 2016. Revegetation of fly ash: A review with emphasis on grass-legume plantation and bioaccumulation of metals. Applied Ecology and Environmental Research, 14(2): 185-212.
doi: 10.15666/aeer
|
|
|
| [51] |
Martonchik J V, Diner D J, Kahn R, et al. 2004. Comparison of MISR and AERONET aerosol optical depths over desert sites. Geophysical Research Letters, 31(16), doi: 10.1029/2004gl019807.
|
|
|
| [52] |
Najafi M S, Khoshakhllagh F, Zamanzadeh S M, et al. 2014. Characteristics of TSP loads during the Middle East Springtime Dust Storm (MESDS) in western Iran. Arabian Journal of Geosciences, 7(12): 5367-5381.
|
|
|
| [53] |
Neff J C, Ballantyne A P, Farmer G L, et al. 2008. Increasing eolian dust deposition in the western United States linked to human activity. Nature Geoscience, 1(3): 189-195.
doi: 10.1038/ngeo133
|
|
|
| [54] |
Ngan F, Stein A, Draxler R. 2015. Inline coupling of WRF-HYSPLIT: Model development and evaluation using tracer experiments. Journal of Applied Meteorology and Climatology, 54(6): 1162-1176.
|
|
|
| [55] |
Offer Z Y, Goossens D. 1994. The use of topographic scale models in predicting eolian dust erosion in hilly areas: Field verification of a wind tunnel experiment. Catena, 22(4): 249-263.
|
|
|
| [56] |
Opp C, Groll M, Aslanov I, et al. 2017. Aeolian dust deposition in the southern Aral Sea region (Uzbekistan): Ground-based monitoring results from the LUCA project. Quaternary International, 429: 86-99.
|
|
|
| [57] |
Prasad A K, Singh R P. 2007. Comparison of MISR-MODIS aerosol optical depth over the Indo-Gangetic basin during the winter and summer seasons (2000-2005). Remote Sensing of Environment, 107(1-2): 109-119.
|
|
|
| [58] |
Prospero J M, Nees R T, Uematsu M. 1987. Deposition rate of particulate and dissolved aluminum derived from Saharan dust in precipitation at Miami, Florida. Journal of Geophysical Research: Atmospheres, 92(D12): 14723-14731.
doi: 10.1029/JD092iD12p14723
|
|
|
| [59] |
Qi Y L, Ge J M, Huang J P. 2013. Spatial and temporal distribution of MODIS and MISR aerosol optical depth over northern China and comparison with AERONET. Chinese Science Bulletin, 58(20): 2497-2506.
doi: 10.1007/s11434-013-5678-5
|
|
|
| [60] |
Quinn P K, Shaw G, Andrews E, et al. 2007. Arctic haze: Current trends and knowledge gaps. Tellus B, 59(1): 99-114.
doi: 10.1111/j.1600-0889.2006.00236.x
|
|
|
| [61] |
Reheis M C, Kihl R. 1995. Dust deposition in southern Nevada and California, 1984-1989: Relations to climate, source area, and source lithology. Journal of Geophysical Research: Atmospheres, 100(D5): 8893-8918.
doi: 10.1029/94JD03245
|
|
|
| [62] |
Remer L A, Tanré D, Kaufman Y J, et al. 2009. Algorithm for remote sensing of tropospheric aerosol from MODIS: Collection 005. National Aeronautics and Space Administration, 1490. http://citeseerx.ist.psu.edu/viewdoc/summary?doi=10.1.1.385.6530.
|
|
|
| [63] |
Rezaei M, Farajzadeh M, Mielonen T, et al. 2019. Analysis of spatio-temporal dust aerosol frequency over Iran based on satellite data. Atmospheric Pollution Research, 10(2): 508-519.
doi: 10.1016/j.apr.2018.10.002
|
|
|
| [64] |
Rolph G, Stein A, Stunder B. 2017. Real-time environmental applications and display system: READY. Environmental Modelling & Software, 95: 210-228.
|
|
|
| [65] |
Rubin J I, Reid J S, Hansen J A, et al. 2017. Assimilation of AERONET and MODIS AOT observations using variational and ensemble data assimilation methods and its impact on aerosol forecasting skill. Journal of Geophysical Research: Atmospheres, 122(9): 4967-4992.
doi: 10.1002/2016JD026067
|
|
|
| [66] |
Sabetghadam S, Khoshsima M, Alizadeh-Choobari O. 2018. Spatial and temporal variations of satellite-based aerosol optical depth over Iran in Southwest Asia: Identification of a regional aerosol hot spot. Atmospheric Pollution Research, 9(5): 849-856.
doi: 10.1016/j.apr.2018.01.013
|
|
|
| [67] |
Schaap M, Timmermans R M A, Koelemeijer R B A, et al. 2008. Evaluation of MODIS aerosol optical thickness over Europe using sun photometer observations. Atmospheric Environment, 42(9): 2187-2197.
doi: 10.1016/j.atmosenv.2007.11.044
|
|
|
| [68] |
Schaap M, Apituley A, Timmermans R, et al. 2009. Exploring the relation between aerosol optical depth and PM2.5 at Cabauw, the Netherlands. Atmospheric Chemistry and Physics, 9(3): 909-925.
doi: 10.5194/acp-9-909-2009
|
|
|
| [69] |
Schepanski K, Heinold B, Tegen I. 2017. Harmattan, Saharan heat low, and West African monsoon circulation: Modulations on the Saharan dust outflow towards the North Atlantic. Atmospheric Chemistry and Physics, 17(17): 10223-10243.
doi: 10.5194/acp-17-10223-2017
|
|
|
| [70] |
Sokolik I N, Winker D M, Bergametti G, et al. 2001. Introduction to special section: Outstanding problems in quantifying the radiative impacts of mineral dust. Journal of Geophysical Research: Atmospheres, 106(D16): 18015-18027.
doi: 10.1029/2000JD900498
|
|
|
| [71] |
Song C H, Park M E, Lee K H, et al. 2008. An investigation into seasonal and regional aerosol characteristics in East Asia using model-predicted and remotely-sensed aerosol properties. Atmospheric Chemistry and Physics, 8(22): 6627-6654.
doi: 10.5194/acp-8-6627-2008
|
|
|
| [72] |
Sorooshian S, AghaKouchak A, Arkin P, et al. 2011. Advanced concepts on remote sensing of precipitation at multiple scales. Bulletin of the American Meteorological Society, 92(10): 1353-1357.
doi: 10.1175/2011BAMS3158.1
|
|
|
| [73] |
Stein A, Draxler R R, Rolph G D, et al. 2015. NOAA's HYSPLIT atmospheric transport and dispersion modeling system. Bulletin of the American Meteorological Society, 96(12): 2059-2077.
doi: 10.1175/BAMS-D-14-00110.1
|
|
|
| [74] |
Stockli R, Jentoft M. 2013. Monthly Aerosol Optical Thickness (Aqua/MODIS). National Aeronautics and Space Administration, 30394. [2017-11-25]. https://svs.gsfc.nasa.gov/30394.
|
|
|
| [75] |
Stohl A. 2006. Characteristics of atmospheric transport into the Arctic troposphere. Journal of Geophysical Research: Atmospheres, 111(D11), doi: 10.1029/2005jd006888.
|
|
|
| [76] |
Taheri S H, Karimi K, Habibi N M, et al. 2015. Monitoring of dust storm and estimation of aerosol concentration in the Middle East using remotely sensed images. Arabian Journal of Geosciences, 8(4): 2095-2110.
doi: 10.1007/s12517-013-1252-3
|
|
|
| [77] |
Tegen I, Lacis A A. 1996. Modeling of particle size distribution and its influence on the radiative properties of mineral dust aerosol. Journal of Geophysical Research: Atmospheres, 101(D14): 19237-19244.
doi: 10.1029/95JD03610
|
|
|
| [78] |
Wang H, Zhang L, Liu R, et al. 2011. Comparison and assessment of the MODIS C005 and C004 aerosol products over the China. Plateau Meteorology, 30(3): 772-783. (in Chinese)
|
|
|
| [79] |
Washington R, Todd M, Middleton N J, et al. 2003. Dust-storm source areas determined by the total ozone monitoring spectrometer and surface observations. Annals of the Association of American Geographers, 93(2): 297-313.
doi: 10.1111/1467-8306.9302003
|
|
|
| [80] |
Wesely M L, Hicks B B. 2000. A review of the current status of knowledge on dry deposition. Atmospheric Environment, 34(12-14): 2261-2282.
|
|
|
| [81] |
Wu D L, Ackerman S A, Davies R, et al. 2009. Vertical distributions and relationships of cloud occurrence frequency as observed by MISR, AIRS, MODIS, OMI, CALIPSO, and CloudSat. Geophysical Research Letters, 36(9), doi: 10.1029/2009gl037464.
|
|
|
| [82] |
Xiao N C, Shi T, Calder C A, et al. 2009. Spatial characteristics of the difference between MISR and MODIS aerosol optical depth retrievals over mainland Southeast Asia. Remote Sensing of Environment, 113(1): 1-9.
|
|
|
| [83] |
Yan H, Jiao M, Bi B, et al. 2006. Observation on sand-dust aerosol in center of Taklimakan Desert. Journal Desert Resesrch, 26(3): 389-393. (in Chinese)
|
|
|
| [84] |
Yasui M, Zhou J X, Liu L C, et al. 2005. Vertical profiles of aeolian dust in a desert atmosphere observed using lidar in Shapotou, China. Journal of the Meteorological Society of Japan, 83: 149-171.
|
|
|
| [85] |
Yu H, Dickinson R E, Chin M, et al. 2003. Annual cycle of global distributions of aerosol optical depth from integration of MODIS retrievals and GOCART model simulations. Journal of Geophysical Research: Atmospheres, 108(D3), doi: 10.1029/2002JD002717.
|
|
|
| [86] |
Yu X, Lü R, Kumar K R, et al. 2016. Dust aerosol properties and radiative forcing observed in spring during 2001-2014 over urban Beijing, China. Environmental Science and Pollution Research, 23(15): 15432-15442.
doi: 10.1007/s11356-016-6727-9
pmid: 27117151
|
|
|
| [87] |
Zhang X, Gong S, Shen Z, et al. 2003. Characterization of soil dust aerosol in China and its transport and distribution during 2001 ACE-Asia: 1. Network observations. Journal of Geophysical Research: Atmospheres, 108(D9): 4261, doi: 10.1029/2002JD002632.
|
|
|
| [88] |
Ziyaee A, Karimi A, Hirmas D R, et al. 2018. Spatial and temporal variations of airborne dust fallout in Khorasan Razavi Province, northeastern Iran. Geoderma, 326: 42-55.
|
|
|
|
Viewed |
|
|
|
Full text
|
|
|
|
|
Abstract
|
|
|
|
|
Cited |
|
|
|
|
| |
Shared |
|
|
|
|
| |
Discussed |
|
|
|
|