| Research article |
|


|
|
|
| Quantifying major sources of uncertainty in projecting the impact of climate change on wheat grain yield in dryland environments |
Reza DEIHIMFARD1, Sajjad RAHIMI-MOGHADDAM2,*( ), Farshid JAVANSHIR1, Alireza PAZOKI3 ), Farshid JAVANSHIR1, Alireza PAZOKI3 |
1Department of Agroecology, Environmental Sciences Research Institute, Shahid Beheshti University, Tehran 19839-69411, Iran
2Department of Production Engineering and Plant Genetics, Faculty of Agriculture and Natural Resources, Lorestan University, Khorramabad 68151-44316, Iran
3Department of Agrotechnology, Yadegar-e-Imam Khomeini (RAH) Shahre Rey Branch, Islamic Azad University, Tehran 18151-63111, Iran |
|
|
|
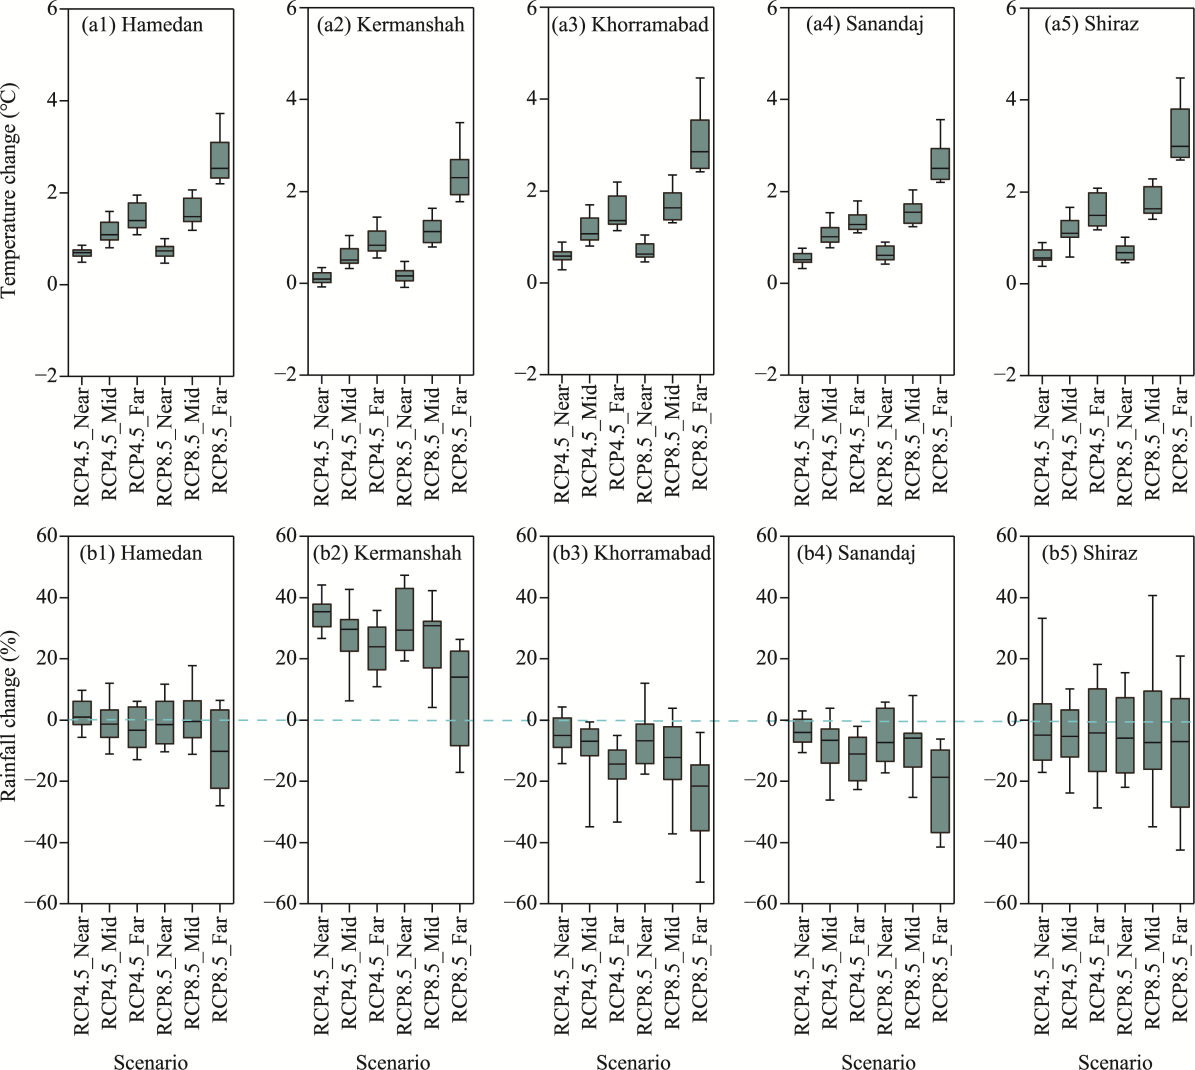
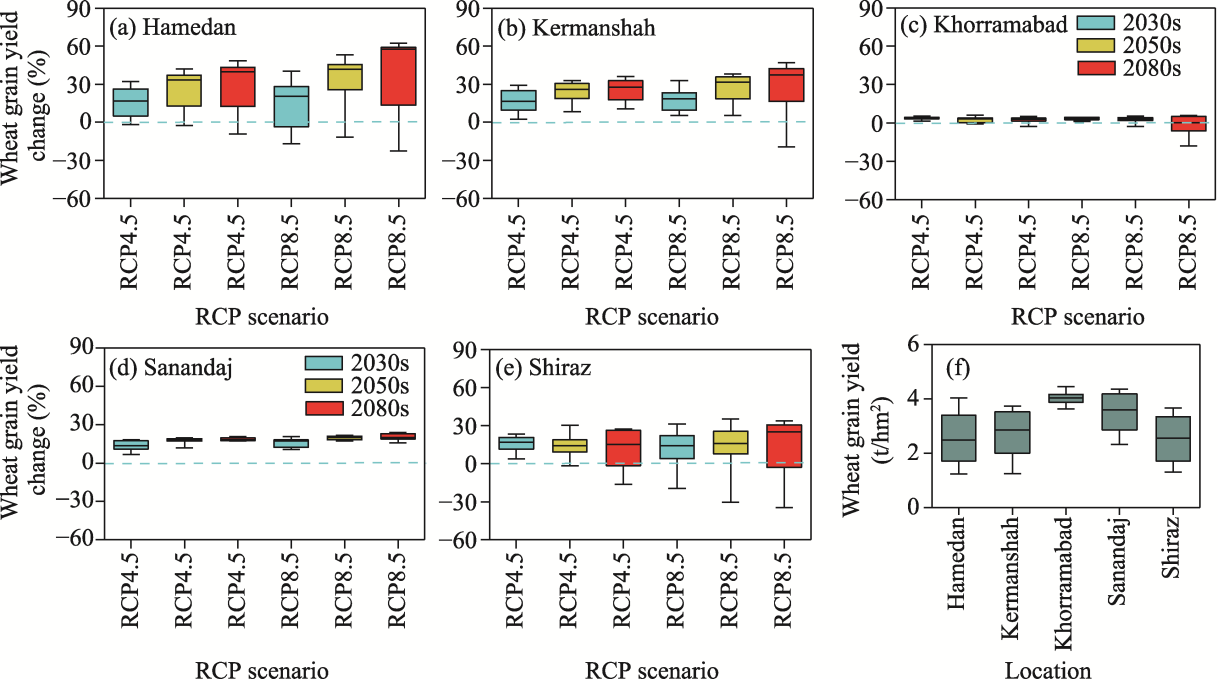
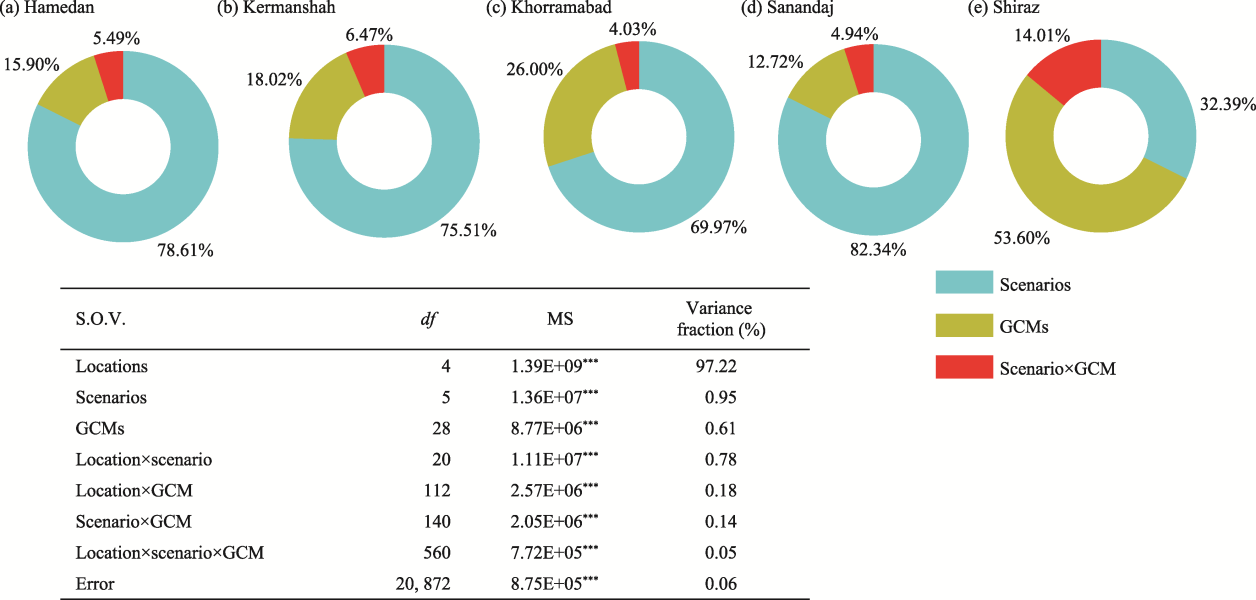
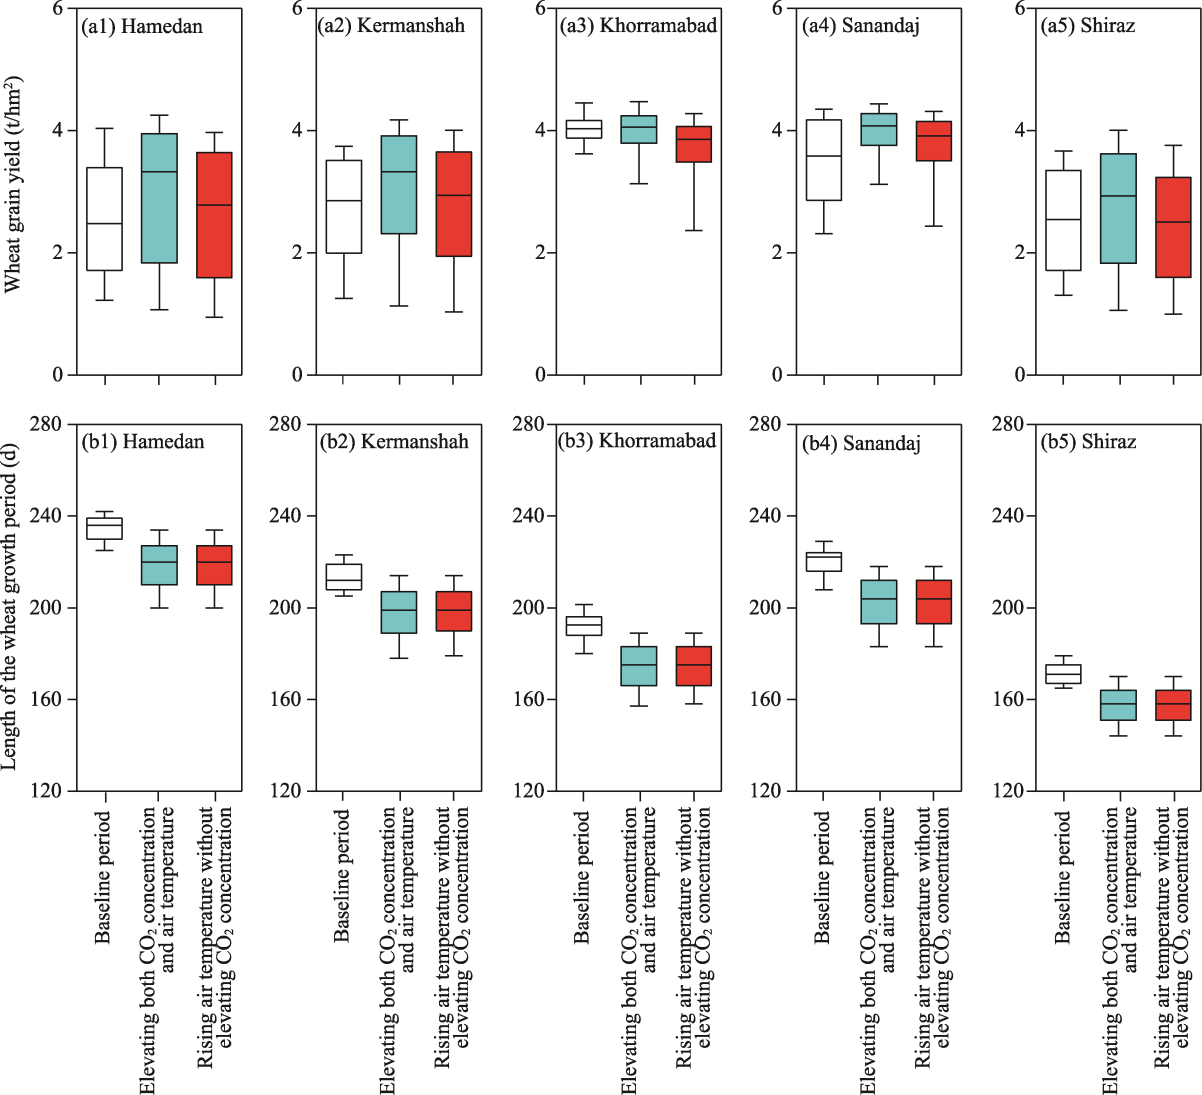
Abstract Modelling the impact of climate change on cropping systems is crucial to support policy-making for farmers and stakeholders. Nevertheless, there exists inherent uncertainty in such cases. General Circulation Models (GCMs) and future climate change scenarios (different Representative Concentration Pathways (RCPs) in different future time periods) are among the major sources of uncertainty in projecting the impact of climate change on crop grain yield. This study quantified the different sources of uncertainty associated with future climate change impact on wheat grain yield in dryland environments (Shiraz, Hamedan, Sanandaj, Kermanshah and Khorramabad) in eastern and southern Iran. These five representative locations can be categorized into three climate classes: arid cold (Shiraz), semi-arid cold (Hamedan and Sanandaj) and semi-arid cool (Kermanshah and Khorramabad). Accordingly, the downscaled daily outputs of 29 GCMs under two RCPs (RCP4.5 and RCP8.5) in the near future (2030s), middle future (2050s) and far future (2080s) were used as inputs for the Agricultural Production Systems sIMulator (APSIM)-wheat model. Analysis of variance (ANOVA) was employed to quantify the sources of uncertainty in projecting the impact of climate change on wheat grain yield. Years from 1980 to 2009 were regarded as the baseline period. The projection results indicated that wheat grain yield was expected to increase by 12.30%, 17.10%, and 17.70% in the near future (2030s), middle future (2050s) and far future (2080s), respectively. The increases differed under different RCPs in different future time periods, ranging from 11.70% (under RCP4.5 in the 2030s) to 20.20% (under RCP8.5 in the 2080s) by averaging all GCMs and locations, implying that future wheat grain yield depended largely upon the rising CO2 concentrations. ANOVA results revealed that more than 97.22% of the variance in future wheat grain yield was explained by locations, followed by scenarios, GCMs, and their interactions. Specifically, at the semi-arid climate locations (Hamedan, Sanandaj, Kermanshah and Khorramabad), most of the variations arose from the scenarios (77.25%), while at the arid climate location (Shiraz), GCMs (54.00%) accounted for the greatest variation. Overall, the ensemble use of a wide range of GCMs should be given priority to narrow the uncertainty when projecting wheat grain yield under changing climate conditions, particularly in dryland environments characterized by large fluctuations in rainfall and temperature. Moreover, the current research suggested some GCMs (e.g., the IPSL-CM5B-LR, CCSM4, and BNU-ESM) that made moderate effects in projecting the impact of climate change on wheat grain yield to be used to project future climate conditions in similar environments worldwide.
|
|
Received: 19 August 2022
Published: 31 May 2023
|
|
Corresponding Authors:
*Sajjad RAHIMI-MOGHADDAM (E-mail: rahimi.s@lu.ac.ir)
|
|
|
| [1] |
AgMIP. 2013. Guide for running AgMIP climate scenario generation tools with R in Windows Version 2.3. [2022-04-18]. https://raw.githubusercontent.com/agmip/Climate-Scenarios-Generator/master/Guide-for-Running-AgMIP-Climate-Scenario-Generation-with-R-v2.0.pdf
|
|
|
| [2] |
Ahmad I, Ahmad B, Boote K, et al. 2020. Adaptation strategies for maize production under climate change for semi-arid environments. European Journal of Agronomy, 115: 126040, doi: 10.1016/j.eja.2020.126040.
doi: 10.1016/j.eja.2020.126040
|
|
|
| [3] |
Ahmad Q U A, Biemans H, Moors E, et al. 2020. The impacts of climate variability on crop yields and irrigation water demand in South Asia. Water, 13(1): 50, doi: 10.3390/w13010050.
doi: 10.3390/w13010050
|
|
|
| [4] |
Amiri S, Eyni-Nargeseh H, Rahimi-Moghaddam S, et al. 2021. Water use efficiency of chickpea agro-ecosystems will be boosted by positive effects of CO2 and using suitable genotype×environment×management under climate change conditions. Agricultural Water Management, 252: 106928, doi: 10.1016/j.agwat.2021.106928.
doi: 10.1016/j.agwat.2021.106928
|
|
|
| [5] |
Amiri S R, Deihimfard R, Soltani A. 2016. A single supplementary irrigation can boost chickpea grain yield and water use efficiency in arid and semiarid conditions: a modeling study. Agronomy Journal, 108(6): 2406-2416.
doi: 10.2134/agronj2016.02.0087
|
|
|
| [6] |
Araya A, Hoogenboom G, Luedeling E, et al. 2015. Assessment of maize growth and yield using crop models under present and future climate in southwestern Ethiopia. Agricultural and Forest Meteorology, 214: 252-265.
|
|
|
| [7] |
Asseng S, Foster I, Turner N C. 2011. The impact of temperature variability on wheat yields. Global Change Biology, 17(2): 997-1012.
doi: 10.1111/gcb.2010.17.issue-2
|
|
|
| [8] |
Asseng S, Ewert F, Rosenzweig C, et al. 2013. Uncertainty in simulating wheat yields under climate change. Nature Climate Change, 3(9): 827-832.
doi: 10.1038/nclimate1916
|
|
|
| [9] |
Asseng S, Ewert F, Martre P, et al. 2014. Rising temperatures reduce global wheat production. Nature Climate Change, 5: 143-147.
doi: 10.1038/nclimate2470
|
|
|
| [10] |
Boughton W C. 1989. A review of the USDA SCS curve number method. Soil Research, 27(3): 511-523.
doi: 10.1071/SR9890511
|
|
|
| [11] |
Chapagain R, Remenyi T A, Harris R M, et al. 2022. Decomposing crop model uncertainty: A systematic review. Field Crops Research, 279: 108448, doi: 10.1016/j.fcr.2022.108448.
doi: 10.1016/j.fcr.2022.108448
|
|
|
| [12] |
Cheng L, Phillips T J, AghaKouchak A. 2015. Non-stationary return levels of CMIP 5 multi-model temperature extremes. Climate Dynamics, 44(11): 2947-2963.
doi: 10.1007/s00382-015-2625-y
|
|
|
| [13] |
Collins B, Najeeb U, Luo Q, et al. 2022. Contribution of climate models and APSIM phenological parameters to uncertainties in spring wheat simulations: Application of SUFI-2 algorithm in northeast Australia. Journal of Agronomy and Crop Science, 208(2): 225-242.
doi: 10.1111/jac.v208.2
|
|
|
| [14] |
De Pauw E, Ghasemi Dehkordi V R, Ghaffari A. 2018. Agroecological zones. In: Roozitalab M, Siadat H, Farshad A. The Soils of Iran. Enschede: Springer, Cham, 163-173.
|
|
|
| [15] |
Ding Z L, Ali E F, Elmahdy A M, et al. 2021. Modeling the combined impacts of deficit irrigation, rising temperature and compost application on wheat yield and water productivity. Agricultural Water Management, 244: 106626, doi: 10.1016/j.agwat.2020.106626.
doi: 10.1016/j.agwat.2020.106626
|
|
|
| [16] |
Edenhofer O. 2014. Climate Change 2014: Mitigation of Climate Change: Working Group III Contribution to the IPCC Fifth Assessment Report. New York: Cambridge University Press, 1-1435.
|
|
|
| [17] |
Eghdamirad S, Johnson F, Sharma A. 2017. Using second-order approximation to incorporate GCM uncertainty in climate change impact assessments. Climate Change, 142(1-2): 37-52.
doi: 10.1007/s10584-017-1944-x
|
|
|
| [18] |
Engebretsen A, Vogt R D, Bechmann M. 2019. SWAT model uncertainties and cumulative probability for decreased phosphorus loading by agricultural Best Management Practices. CATENA, 175: 154-166.
doi: 10.1016/j.catena.2018.12.004
|
|
|
| [19] |
FAO (Food and Agriculture organization of the United Nations). 2020. FAOSTAT Data. [2022-04-18]. http://www.fao.org/faostat/en/#data/QC.
|
|
|
| [20] |
Freychet N, Hegerl G, Mitchell D, et al. 2021. Future changes in the frequency of temperature extremes may be underestimated in tropical and subtropical regions. Communications Earth & Environment, 2(1): 1-8.
|
|
|
| [21] |
Gupta R, Mishra A. 2019. Climate change induced impact and uncertainty of rice yield of agro-ecological zones of India. Agricultural Systems, 173: 1-11.
doi: 10.1016/j.agsy.2019.01.009
|
|
|
| [22] |
Hao S R, Ryu D, Western A, et al. 2021. Sensitivity analysis of APSIM wheat yield predictions. American Geophysical Union, New Orleans (USA). 2021-12-12-2021-12-17. New Orleans, USA.
|
|
|
| [23] |
Hawkins E, Smith R S, Gregory J M, et al. 2016. Irreducible uncertainty in near-term climate projections. Climate Dynamics, 46(11): 3807-3819.
doi: 10.1007/s00382-015-2806-8
|
|
|
| [24] |
Hawkins R H, Ward T J, Woodward D, et al. 2008. Curve Number Hydrology: State of Practice. Reston: American Society of Civil Engineers, 1-104.
|
|
|
| [25] |
Holzworth D P, Huth N I, deVoil P G, et al. 2014. APSIM-evolution towards a new generation of agricultural systems simulation. Environmental Modelling & Software, 62: 327-350.
|
|
|
| [26] |
Hosseinzadehtalaei P, Tabari H, Willems P. 2017. Uncertainty assessment for climate change impact on intense precipitation: how many model runs do we need? International Journal of Climatology, 37(S1): 1105-1117.
doi: 10.1002/joc.2017.37.issue-S1
|
|
|
| [27] |
Kamali B, Lorite I J, Webber H A, et al. 2022. Uncertainty in climate change impact studies for irrigated maize cropping systems in southern Spain. Scientific Reports, 12: 4049, doi: 10.1038/s41598-022-08056-9.
doi: 10.1038/s41598-022-08056-9
pmid: 35260727
|
|
|
| [28] |
Kassie B T, Asseng S, Rotter R P, et al. 2015. Exploring climate change impacts and adaptation options for maize production in the Central Rift Valley of Ethiopia using different climate change scenarios and crop models. Climatic Change, 129(1): 145-158.
doi: 10.1007/s10584-014-1322-x
|
|
|
| [29] |
Khan M S, Coulibaly P, Dibike Y. 2006. Uncertainty analysis of statistical downscaling methods. Journal of Hydrology, 319(1-4): 357-382.
doi: 10.1016/j.jhydrol.2005.06.035
|
|
|
| [30] |
Kidanemariam S, Goitom H, Desta Y. 2021. Coupled application of R and WetSpa models for assessment of climate change impact on streamflow of Werie Catchment, Tigray, Ethiopia. Journal of Water and Climate Change, 12(3): 916-936.
doi: 10.2166/wcc.2020.238
|
|
|
| [31] |
Liu W H, Ye T, Jägermeyr J, et al. 2021. Future climate change significantly alters interannual wheat yield variability over half of harvested areas. Environmental Research Letters, 16(9): 094045, doi: 10.1088/1748-9326/ac1fbb.
doi: 10.1088/1748-9326/ac1fbb
|
|
|
| [32] |
Lobell D B, Hammer G L, Chenu K, et al. 2015. The shifting influence of drought and heat stress for crops in northeast Australia. Global Change Biology, 21(11): 4115-4127.
doi: 10.1111/gcb.13022
pmid: 26152643
|
|
|
| [33] |
Lv Z F, Liu X J, Cao W X, et al. 2013. Climate change impacts on regional winter wheat production in main wheat production regions of China. Agricultural and Forest Meteorology, 171-172: 234-248.
|
|
|
| [34] |
Masutomi Y, Takahashi K, Harasawa H, et al. 2009. Impact assessment of climate change on rice production in Asia in comprehensive consideration of process/parameter uncertainty in general circulation models. Agriculture, Ecosystems & Environment, 131(3-4): 281-291.
doi: 10.1016/j.agee.2009.02.004
|
|
|
| [35] |
Obembe O S, Hendricks N P, Tack J. 2021. Decreased wheat production in the USA from climate change driven by yield losses rather than crop abandonment. PLOS ONE, 16(6): e0252067, doi: 10.1371/journal.pone.0252067.
doi: 10.1371/journal.pone.0252067
|
|
|
| [36] |
Ojeda J J, Rezaei E E, Kamali B, et al. 2021. Impact of crop management and environment on the spatio-temporal variance of potato yield at regional scale. Field Crops Research, 270: 108213, doi: 10.1016/j.fcr.2021.108213.
doi: 10.1016/j.fcr.2021.108213
|
|
|
| [37] |
Olesen J E, Carter T R, Diaz-Ambrona C H, et al. 2007. Uncertainties in projected impacts of climate change on European agriculture and terrestrial ecosystems based on scenarios from regional climate models. Climatic Change, 81(1): 123-143.
doi: 10.1007/s10584-006-9216-1
|
|
|
| [38] |
Osborne T, Rose G, Wheeler T. 2013. Variation in the global-scale impacts of climate change on crop productivity due to climate model uncertainty and adaptation. Agricultural and Forest Meteorology, 170: 183-194.
doi: 10.1016/j.agrformet.2012.07.006
|
|
|
| [39] |
Ponce V M, Hawkins R H. 1996. Runoff curve number: Has it reached maturity? Journal of Hydrologic Engineering, 1(1): 11-19.
doi: 10.1061/(ASCE)1084-0699(1996)1:1(11)
|
|
|
| [40] |
R Core Team. 2017. R: A Language and Environment for Statistical Computing. Online: R Foundation for Statistical Computing, Vienna, Austria. [2022-04-18]. http://www.R-project.orgs.
|
|
|
| [41] |
Rahimi-Moghaddam S, Kambouzia J, Deihimfard R. 2019. Optimal genotype×environment×management as a strategy to increase grain maize productivity and water use efficiency in water-limited environments and rising temperature. Ecological Indicators, 107: 105570, doi: 10.1016/j.ecolind.2019.105570.
doi: 10.1016/j.ecolind.2019.105570
|
|
|
| [42] |
Rahimi-Moghaddam S, Deihimfard R, Azizi K, et al. 2021. Characterizing spatial and temporal trends in drought patterns of rainfed wheat (Triticum aestivum L.) across various climatic conditions: A modelling approach. European Journal of Agronomy, 129: 126333, doi: 10.1016/j.eja.2021.126333.
doi: 10.1016/j.eja.2021.126333
|
|
|
| [43] |
Rahman M H, Ahmad A, Wang X C, et al. 2018. Multi-model projections of future climate and climate change impacts uncertainty assessment for cotton production in Pakistan. Agricultural and Forest Meteorology, 253-254: 94-113.
|
|
|
| [44] |
Rettie F M, Gayler S, Weber T K D, et al. 2022. Climate change impact on wheat and maize growth in Ethiopia: A multi-model uncertainty analysis. PLOS ONE, 17(1): e0262951, doi: 10.1371/journal.pone.0262951.
doi: 10.1371/journal.pone.0262951
|
|
|
| [45] |
Reyenga P J, Howden S M, Meinke H, et al. 1999. Modelling global change impacts on wheat cropping in south-east Queensland, Australia. Environmental Modelling & Software, 14(4): 297-306.
|
|
|
| [46] |
Ruane A C, Cecil L D, Horton R M, et al. 2013. Climate change impact uncertainties for maize in Panama: Farm information, climate projections, and yield sensitivities. Agricultural and Forest Meteorology, 170: 132-145.
doi: 10.1016/j.agrformet.2011.10.015
|
|
|
| [47] |
Ruane A C, McDermid S P. 2017. Selection of a representative subset of global climate models that captures the profile of regional changes for integrated climate impacts assessment. Earth Perspectives, 4(1): 1-20.
doi: 10.1186/s40322-017-0036-4
|
|
|
| [48] |
Ruiz-Ramos M, Rodríguez A, Dosio A, et al. 2016. Comparing correction methods of RCM outputs for improving crop impact projections in the Iberian Peninsula for 21st century. Climatic Change, 134(1-2): 283-297.
doi: 10.1007/s10584-015-1518-8
|
|
|
| [49] |
Saddique Q, Liu D L, Wang B, et al. 2020. Modelling future climate change impacts on winter wheat yield and water use: A case study in Guanzhong Plain, northwestern China. European Journal of Agronomy, 119: 126113, doi: 10.1016/j.eja.2020. 126113.
doi: 10.1016/j.eja.2020. 126113
|
|
|
| [50] |
Saxton K E, Willey P H. 2005. The SPAW model for agricultural field and pond hydrologic simulation. In: Singh V P, Frevert D K. Watershed Models. Boca Raton: CRC Press, 400-435.
|
|
|
| [51] |
Schierhorn F, Hofmann M, Adrian I, et al. 2020. Spatially varying impacts of climate change on wheat and barley yields in Kazakhstan. Journal of Arid Environments, 178: 104164, doi: 10.1016/j.jaridenv.2020.104164.
doi: 10.1016/j.jaridenv.2020.104164
|
|
|
| [52] |
Shi L J, Feng P Y, Wang B, et al. 2020. Quantifying future drought change and associated uncertainty in southeastern Australia with multiple potential evapotranspiration models. Journal of Hydrology, 590: 125394, doi: 10.1016/j.jhydrol.2020.125394.
doi: 10.1016/j.jhydrol.2020.125394
|
|
|
| [53] |
Tao F L, Rötter R P, Palosuo T, et al. 2018. Contribution of crop model structure, parameters and climate projections to uncertainty in climate change impact assessments. Global Change Biology, 24(3): 1291-1307.
doi: 10.1111/gcb.14019
pmid: 29245185
|
|
|
| [54] |
UNEP (United Nations Environment Programme). 1992. World Atlas of Desertification. [2022-04-18]. https://wedocs.unep.org/20.500.11822/42137.
|
|
|
| [55] |
UNESCO (United Nations Educational, Scientific and Cultural Organization). 1979. Map of the World Distribution of Arid Regions: Explanatory Note. Paris: UNESCO, 1-54.
|
|
|
| [56] |
Vogeler I, Sharp J, Cichota R, et al. 2022. Sensitivity analysis of soil parameters in the Agricultural Production Systems sIMulator (APSIM). Soil Research, 61(2): 176-186.
doi: 10.1071/SR22110
|
|
|
| [57] |
Wang B, Liu D L, Waters C, et al. 2018. Quantifying sources of uncertainty in projected wheat yield changes under climate change in eastern Australia. Climatic Change, 151(2): 259-273.
doi: 10.1007/s10584-018-2306-z
|
|
|
| [58] |
Zhang Y, Zhao Y X, Feng L P. 2019. Higher contributions of uncertainty from global climate models than crop models in maize-yield simulations under climate change. Meteorological Applications, 26(1): 74-82.
doi: 10.1002/met.1738
|
|
|
| [59] |
Zhao G, Bryan B A, Song X D. 2014. Sensitivity and uncertainty analysis of the APSIM-wheat model: Interactions between cultivar, environmental, and management parameters. Ecological Modelling, 279: 1-11.
doi: 10.1016/j.ecolmodel.2014.02.003
|
|
|
|
Viewed |
|
|
|
Full text
|
|
|
|
|
Abstract
|
|
|
|
|
Cited |
|
|
|
|
| |
Shared |
|
|
|
|
| |
Discussed |
|
|
|
|