| Research article |
|


|
|
|
| Runoff change in the Yellow River Basin of China from 1960 to 2020 and its driving factors |
WANG Baoliang1, WANG Hongxiang1, JIAO Xuyang1, HUANG Lintong1, CHEN Hao1, GUO Wenxian2,*( ) ) |
1School of Water Conservancy, North China University of Water Resources and Electric Power, Zhengzhou 450046, China
2College of Water Resources, North China University of Water Resources and Electric Power, Zhengzhou 450046, China |
|
|
|
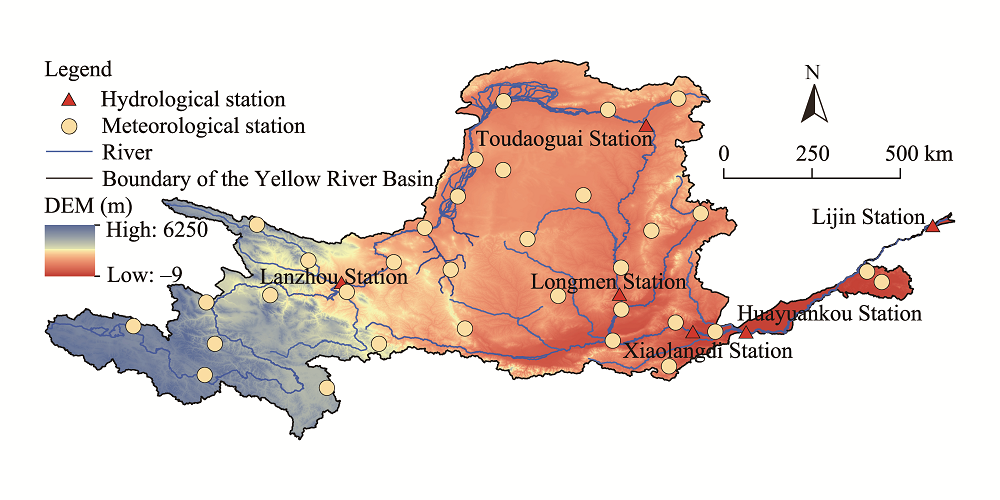
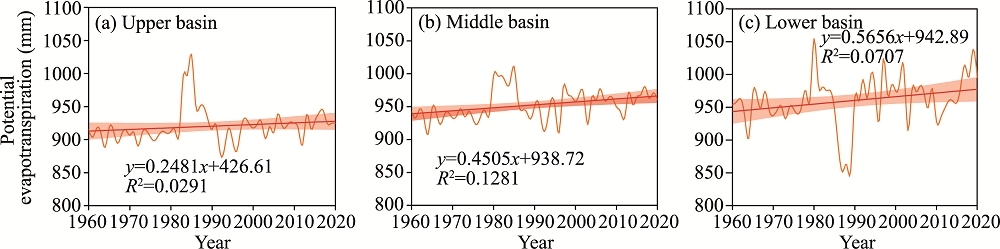
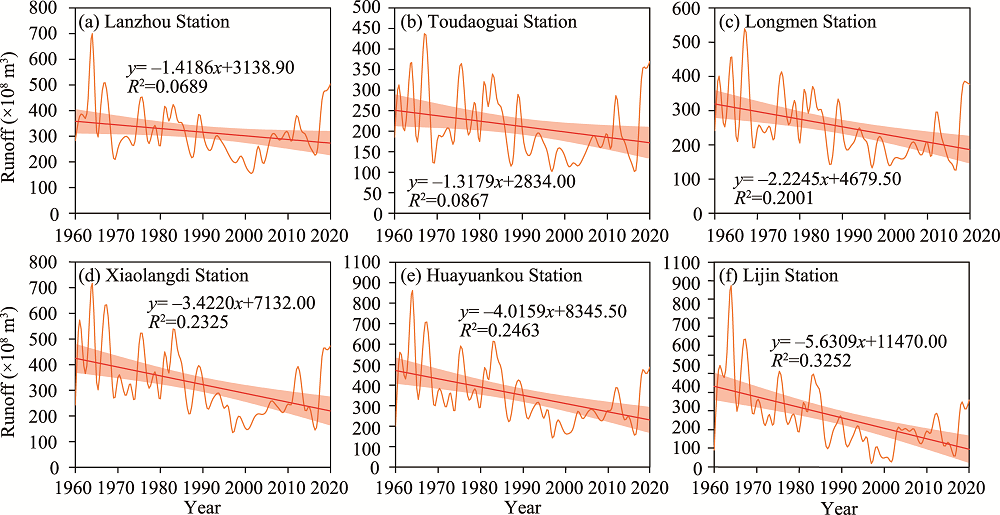
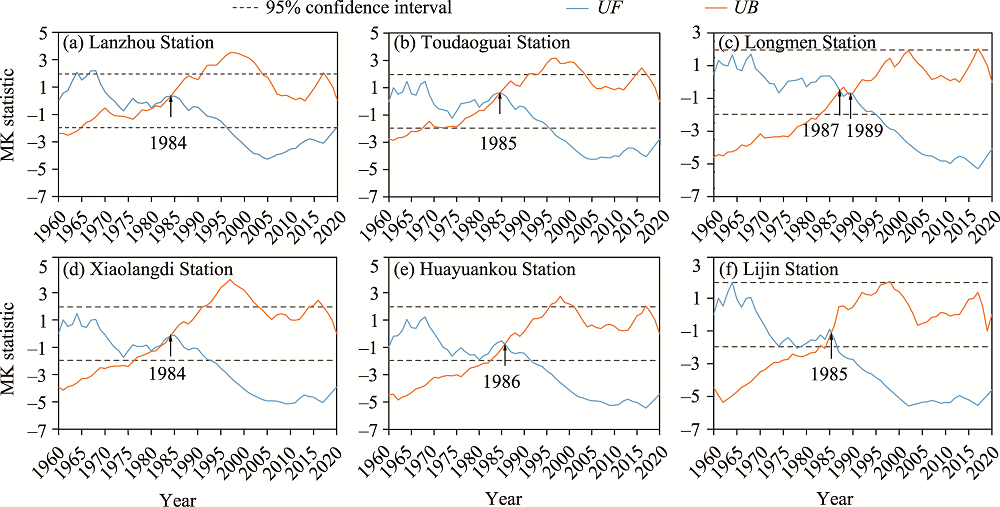
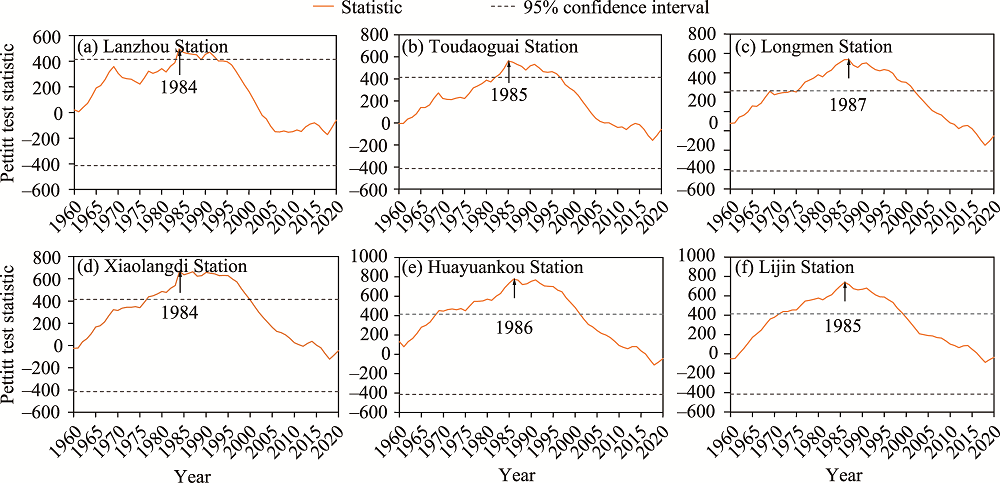
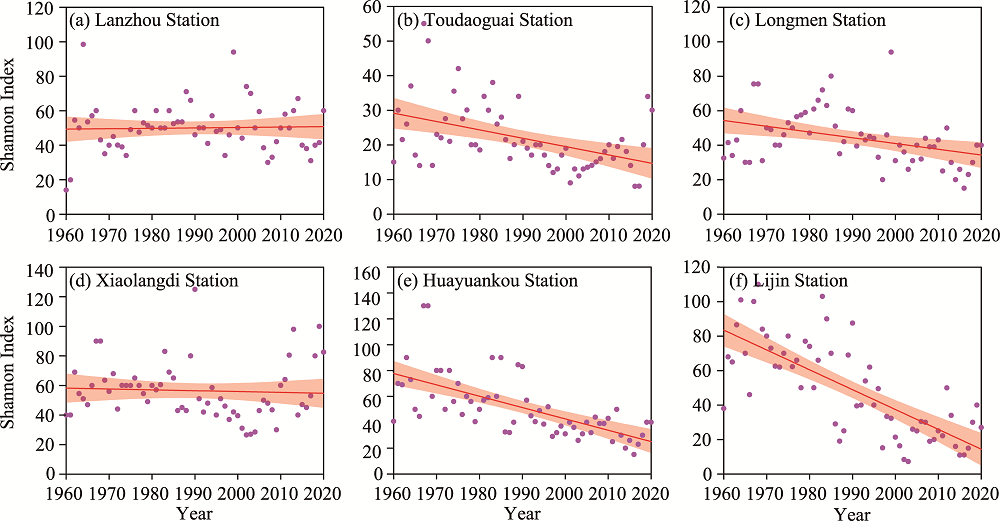
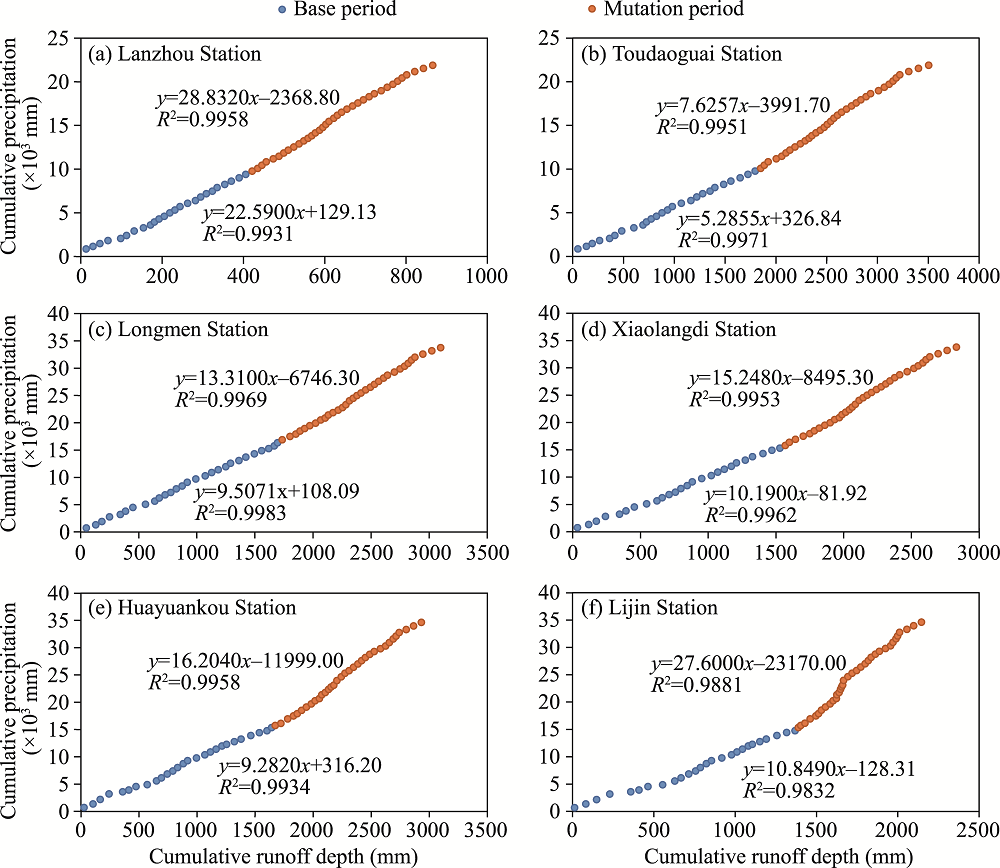
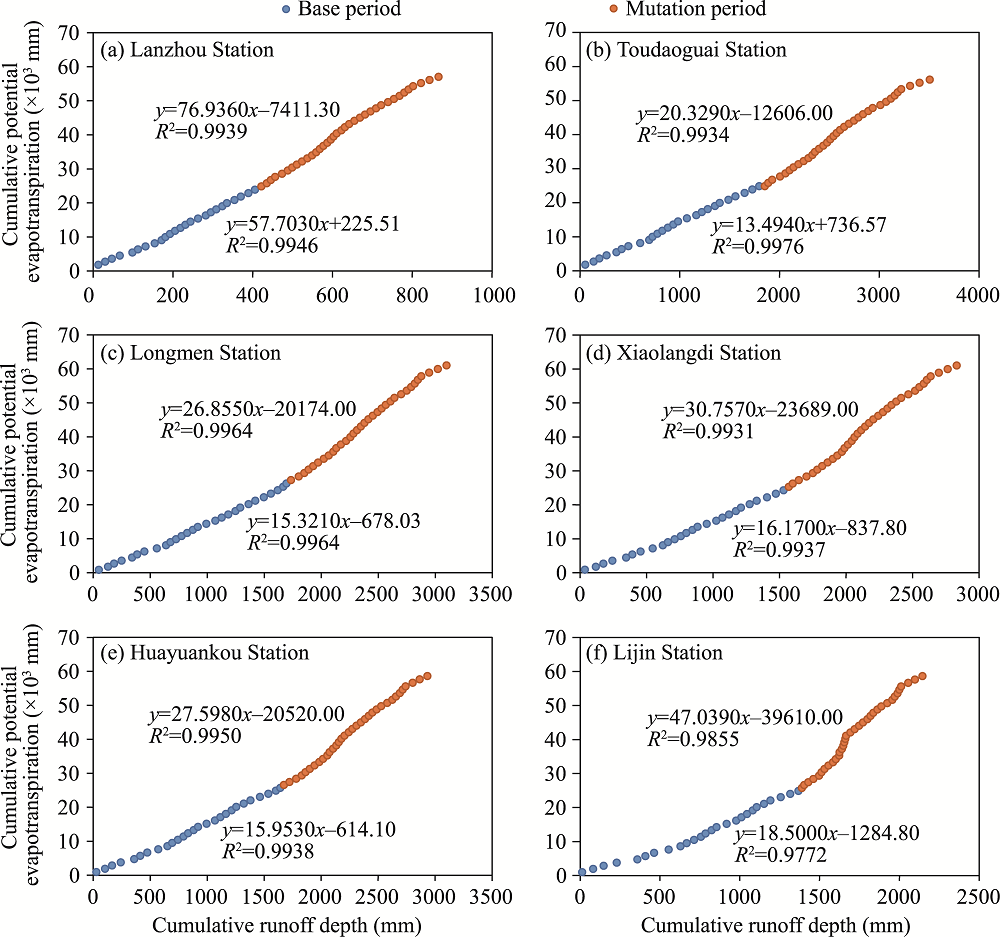
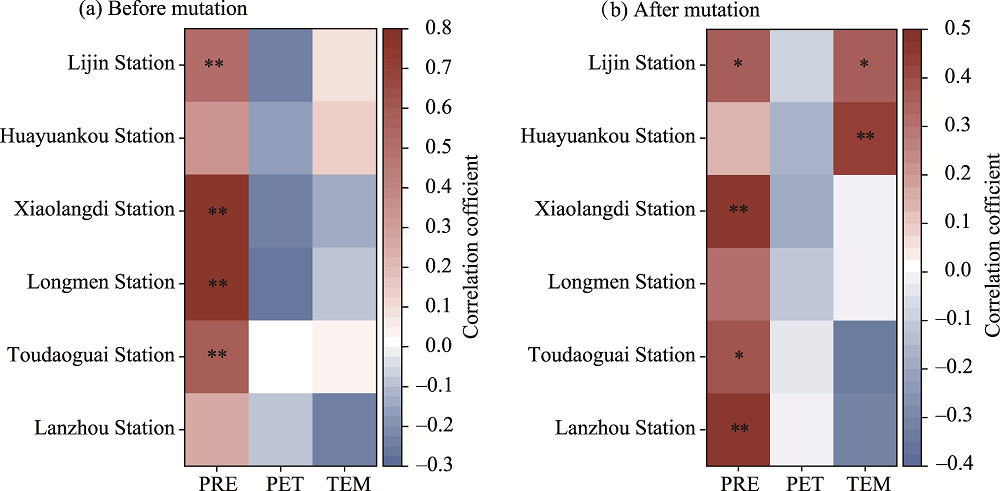
Abstract Analysing runoff changes and how these are affected by climate change and human activities is deemed crucial to elucidate the ecological and hydrological response mechanisms of rivers. The Indicators of Hydrologic Alteration and the Range of Variability Approach (IHA-RVA) method, as well as the ecological indicator method, were employed to quantitatively assess the degree of hydrologic change and ecological response processes in the Yellow River Basin from 1960 to 2020. Using Budyko's water heat coupling balance theory, the relative contributions of various driving factors (such as precipitation, potential evapotranspiration, and underlying surface) to runoff changes in the Yellow River Basin were quantitatively evaluated. The results show that the annual average runoff and precipitation in the Yellow River Basin had a downwards trend, whereas the potential evapotranspiration exhibited an upwards trend from 1960 to 2020. In approximately 1985, it was reported that the hydrological regime of the main stream underwent an abrupt change. The degree of hydrological change was observed to gradually increase from upstream to downstream, with a range of 34.00%-54.00%, all of which are moderate changes. However, significant differences have been noted among different ecological indicators, with a fluctuation index of 90.00% at the outlet of downstream hydrological stations, reaching a high level of change. After the mutation, the biodiversity index of flow in the middle and lower reaches of the Yellow River was generally lower than that in the base period. The research results also indicate that the driving factor for runoff changes in the upper reach of the Yellow River Basin is mainly precipitation, with a contribution rate of 39.31%-54.70%. Moreover, the driving factor for runoff changes in the middle and lower reaches is mainly human activities, having a contribution rate of 63.70%-84.37%. These results can serve as a basis to strengthen the protection and restoration efforts in the Yellow River Basin and further promote the rational development and use of water resources in the Yellow River.
|
|
Received: 31 July 2023
Published: 29 February 2024
|
|
Corresponding Authors:
*GUO Wenxian (E-mail: z20211010124@stu.ncwu.edu.cn)
|
|
|
| [1] |
Blain G C. 2015. The influence of nonlinear trends on the power of the trend-free pre-whitening approach. Acta Scientiarum Agronomy, 37(1): 21-28.
doi: 10.4025/actasciagron.v37i1.18199
|
|
|
| [2] |
Blöschl G, Ardoin-Bardin S, Bonell M, et al. 2007. At what scales do climate variability and land cover change impact on flooding and low flows? Hydrological Processes, 21(9): 1241-1247.
doi: 10.1002/hyp.v21:9
|
|
|
| [3] |
Chen Y Q, Niu J, Sun Y Q, et al. 2020. Study on streamflow response to land use change over the upper reaches of Zhanghe Reservoir in the Yangtze River basin. Geoscience Letters, 7(1): 6, doi: 10.1186/s40562-020-00155-7.
|
|
|
| [4] |
Cheng J X, Xu L G, Fan H X, et al. 2019. Changes in the flow regimes associated with climate change and human activities in the Yangtze River. River Research and Applications, 35(9): 1415-1427.
doi: 10.1002/rra.v35.9
|
|
|
| [5] |
Choudhury B. 1999. Evaluation of an empirical equation for annual evaporation using field observations and results from a biophysical model. Journal of Hydrology, 216(1-2): 99-110.
doi: 10.1016/S0022-1694(98)00293-5
|
|
|
| [6] |
Conte L C, Bayer D M, Bayer F M. 2019. Bootstrap Pettitt test for detecting change points in hydroclimatological data: case study of Itaipu Hydroelectric Plant, Brazil. Hydrological Sciences Journal, 64(11): 1312-1326.
|
|
|
| [7] |
Cui T, Tian F Q, Yang T, et al. 2020. Development of a comprehensive framework for assessing the impacts of climate change and dam construction on flow regimes. Journal of Hydrology, 590: 125358, doi: 10.1016/j.jhydrol.2020.125358.
|
|
|
| [8] |
Cuo L, Zhang Y X, Gao Y H, et al. 2013. The impacts of climate change and land cover/use transition on the hydrology in the upper Yellow River Basin, China. Journal of Hydrology, 502: 37-52.
doi: 10.1016/j.jhydrol.2013.08.003
|
|
|
| [9] |
Dai Y Y, Lu F, Ruan B Q, et al. 2023. Decomposition of contribution to runoff changes and spatial differences of major tributaries in the middle reaches of the Yellow River based on the Budyko framework. Hydrology Research, 54(4): 435-450.
doi: 10.2166/nh.2023.061
|
|
|
| [10] |
Desa N H M, Jemain A A. 2013. Eliminating the influence of serial correlation on statistical process control charts using trend free pre-whitening (TFPW) method. AIP Conference Proceedings, 1571(1): 1049-1054.
|
|
|
| [11] |
Dooge J C I, Bruen M, Parmentier B. 1999. A simple model for estimating the sensitivity of runoff to long-term changes in precipitation without a change in vegetation. Advances in Water Resources, 23(2): 153-163.
doi: 10.1016/S0309-1708(99)00019-6
|
|
|
| [12] |
Emamgholizadeh S. 2015. Trend analysis of stream flow changing of North watershed of Dez River with MK test with the TFPW-MK procedure. Journal of Water and Soil Conservation, 22(3): 39-55.
|
|
|
| [13] |
Erol A, Randhir T O. 2012. Climatic change impacts on the ecohydrology of Mediterranean watersheds. Climatic Change, 114: 319-341.
doi: 10.1007/s10584-012-0406-8
|
|
|
| [14] |
Fu G B, Charles S P, Chiew F H S. 2007. A two-parameter climate elasticity of streamflow index to assess climate change effects on annual streamflow. Water Resources Research, 43: W11419, doi:10.1029/2007wr005890.
|
|
|
| [15] |
Gao Y X, Vogel R M, Kroll C N, et al. 2009. Development of representative indicators of hydrologic alteration. Journal of Hydrology, 374(1-2): 136-147.
doi: 10.1016/j.jhydrol.2009.06.009
|
|
|
| [16] |
Gao Z L, Zhang L, Zhang X P, et al. 2016. Long-term streamflow trends in the middle reaches of the Yellow River Basin: detecting drivers of change. Hydrological Processes, 30(9): 1315-1329.
doi: 10.1002/hyp.v30.9
|
|
|
| [17] |
Gu L, Chen J, Yin J B, et al. 2020. Responses of precipitation and runoff to climate warming and implications for future drought changes in China. Earth's Future, 8(10): e2020EF001718, doi:10.1029/2020ef001718.
|
|
|
| [18] |
Guo W X, Zhou H T, Jiao X Y, et al. 2022. Analysis of alterations of the hydrological situation and causes of river runoff in the Min River, China. Water, 14(7): 1093, doi: 10.3390/w14071093.
|
|
|
| [19] |
Hamed K H, Rao A R. 1998. A modified Mann-Kendall trend test for autocorrelated data. Journal of hydrology, 204(1-4): 182-196.
doi: 10.1016/S0022-1694(97)00125-X
|
|
|
| [20] |
Hamed K H. 2008. Trend detection in hydrologic data: the Mann-Kendall trend test under the scaling hypothesis. Journal of Hydrology, 349(3-4): 350-363.
doi: 10.1016/j.jhydrol.2007.11.009
|
|
|
| [21] |
Huang T T, Wang Z H, Wu Z Y, et al. 2023. Attribution analysis of runoff evolution in Kuye River Basin based on the time-varying Budyko framework. Frontiers in Earth Science, 10: 1092409, doi: 10.3389/feart.2022.1092409.
|
|
|
| [22] |
Jin J L, Wang G Q, Zhang J Y, et al. 2020. Impacts of climate change on hydrology in the Yellow River source region, China. Journal of Water and Climate Change, 11(3): 916-930.
doi: 10.2166/wcc.2018.085
|
|
|
| [23] |
Kim B S, Kim B K, Kwon H H. 2011. Assessment of the impact of climate change on the flow regime of the Han River basin using indicators of hydrologic alteration. Hydrological Processes, 25(5): 691-704.
doi: 10.1002/hyp.v25.5
|
|
|
| [24] |
Li X, Cheng G D, Ge Y C, et al. 2018. Hydrological cycle in the Heihe River Basin and its implication for water resource management in endorheic basins. Journal of Geophysical Research: Atmospheres, 123(2): 890-914.
doi: 10.1002/jgrd.v123.2
|
|
|
| [25] |
Li Y Y, Chang J X, Tu H, et al. 2016. Impact of the Sanmenxia and Xiaolangdi reservoirs operation on the hydrologic regime of the lower Yellow River. Journal of Hydrologic Engineering, 21(3): 06015015, doi: 10.1061/(ASCE)HE.1943-5584.0001290.
|
|
|
| [26] |
Liu C X, Zhang X D, Wang T, et al. 2022. Detection of vegetation coverage changes in the Yellow River Basin from 2003 to 2020. Ecological Indicators, 138: 108818, doi: 10.1016/j.ecolind.2022.108818.
|
|
|
| [27] |
Liu Q A, Yang Z F. 2010. Quantitative estimation of the impact of climate change on actual evapotranspiration in the Yellow River Basin, China. Journal of Hydrology, 395(3-4): 226-234.
doi: 10.1016/j.jhydrol.2010.10.031
|
|
|
| [28] |
Liu Y E, Yu K K, Zhao Y Q, et al. 2022. Impacts of climatic variation and human activity on runoff in Western China. Sustainability, 14(2): 942, doi: 10.3390/su14020942.
|
|
|
| [29] |
Liu Y Y, Zhang X N, Xia D Z, et al. 2013. Impacts of land-use and climate changes on hydrologic processes in the Qingyi River Watershed, China. Journal of Hydrologic Engineering, 18: 1495-1512.
doi: 10.1061/(ASCE)HE.1943-5584.0000485
|
|
|
| [30] |
McVicar T R, Roderick M L, Donohue R J, et al. 2012. Global review and synthesis of trends in observed terrestrial near-surface wind speeds: Implications for evaporation. Journal of Hydrology, 416-417: 182-205.
|
|
|
| [31] |
Pettersson M. 1998. Monitoring a freshwater fish population: statistical surveillance of biodiversity. Environmetrics, 9(2): 139-150.
doi: 10.1002/(ISSN)1099-095X
|
|
|
| [32] |
Richter B D, Baumgartner J V, Powell J, et al. 1996. A method for assessing hydrologic alteration within ecosystems. Conservation Biology, 10(4): 1163-1174.
doi: 10.1046/j.1523-1739.1996.10041163.x
|
|
|
| [33] |
Rolls R J, Heino J, Ryder D S, et al. 2018. Scaling biodiversity responses to hydrological regimes. Biological Reviews, 93(2): 971-995.
doi: 10.1111/brv.2018.93.issue-2
|
|
|
| [34] |
Rybski D, Neumann J. 2011. A review on the Pettitt test. In: Kropp J, Schellnhuber H J. Extremis: Disruptive Events and Trends in Climate and Hydrology. Berlin, Heidelberg: Springer, 202-213.
|
|
|
| [35] |
Schaake J S. 1990. From climate to flow. In: Waggoner P E. Climate Change and U.S. Water Resources. New York: John Wiley, 177-206.
|
|
|
| [36] |
Shao Y Q, Dong Z C, Meng J Y, et al. 2023. Analysis of runoff variation and future trends in a changing environment: case study for Shiyanghe River Basin, Northwest China. Sustainability, 15(3): 2173, doi: 10.3390/su15032173.
|
|
|
| [37] |
Shi H L, Hu C H, Wang Y G, et al. 2017. Analyses of trends and causes for variations in runoff and sediment load of the Yellow River. International Journal of Sediment Research, 32(2): 171-179.
doi: 10.1016/j.ijsrc.2016.09.002
|
|
|
| [38] |
Sofi M S, Bhat S U, Rashid I, et al. 2020. The natural flow regime: A master variable for maintaining river ecosystem health. Ecohydrology, 13(8): e2247, doi:10.1002/eco.2247.
|
|
|
| [39] |
Sorribas M V, Paiva R C D, Melack J M, et al. 2016. Projections of climate change effects on discharge and inundation in the Amazon basin. Climatic Change, 136: 555-570.
doi: 10.1007/s10584-016-1640-2
|
|
|
| [40] |
Taye M T, Ntegeka V, Ogiramoi N P, et al. 2011. Assessment of climate change impact on hydrological extremes in two source regions of the Nile River Basin. Hydrology and Earth System Sciences, 15: 209-222.
doi: 10.5194/hess-15-209-2011
|
|
|
| [41] |
Wang H X, Ma Y C, Yang H, et al. 2023. Quantitative evaluation of the impact of climate change and human activities on Jialing River runoff changes in the past 60 years, China. Journal of Water and Climate Change, 14(2): 590-609.
doi: 10.2166/wcc.2023.452
|
|
|
| [42] |
Wang K C, Dickinson R E. 2012. A review of global terrestrial evapotranspiration: observation, modeling, climatology, and climatic variability. Reviews of Geophysics, 50(2), 2011RG000373, doi: 10.1029/2011RG000373.
|
|
|
| [43] |
Wang S J, Yan M, Yan Y X, et al. 2012. Contributions of climate change and human activities to the changes in runoff increment in different sections of the Yellow River. Quaternary International, 282: 66-77.
doi: 10.1016/j.quaint.2012.07.011
|
|
|
| [44] |
Wang W, Wang S Y. 2022. Overview of eco-environmental impact of Xiaolangdi Water Conservancy Hub on the Yellow River. Open Geosciences, 14(1): 847-852.
doi: 10.1515/geo-2022-0397
|
|
|
| [45] |
Wang Y J, Gu X C, Yang G, et al. 2021. Impacts of climate change and human activities on water resources in the Ebinur Lake Basin, Northwest China. Journal of Arid Land, 13(6): 581-598.
doi: 10.1007/s40333-021-0067-4
|
|
|
| [46] |
Xu Z X, Takeuchi K, Ishidaira H, et al. 2005. An overview of water resources in the Yellow River Basin. Water International, 30(2): 225-238.
doi: 10.1080/02508060508691863
|
|
|
| [47] |
Yang H B, Yang D W, Lei Z D, et al. 2008. New analytical derivation of the mean annual water-energy balance equation. Water Resources Research, 44(3): W03410, doi: 10.1029/2007wr006135.
|
|
|
| [48] |
Yang H B, Yang D W. 2011. Derivation of climate elasticity of runoff to assess the effects of climate change on annual runoff. Water Resources Research, 47(7): W07526, doi: 10.1029/2010wr009287.
|
|
|
| [49] |
Yang Y C E, Cai X M, Herricks E E. 2008. Identification of hydrologic indicators related to fish diversity and abundance: A data mining approach for fish community analysis. Water Resources Research, 44(4): W04412, doi: 10.1029/2006wr005764.
|
|
|
| [50] |
Yellow River Conservancy Commission of the Ministry of Water Resources, 1961-2021, ellow River Basin Hydrological Yearbook. Zhengzhou: Yellow River Conservancy Commission of the Ministry of Water Resources, (in Chinese)
|
|
|
| [51] |
Zhang Q, Zhang Z J, Shi P J, et al. 2018. Evaluation of ecological instream flow considering hydrological alterations in the Yellow River basin, China. Global and Planetary Change, 160: 61-74.
doi: 10.1016/j.gloplacha.2017.11.012
|
|
|
| [52] |
Zhang X Q, Qiao W B, Huang J F, et al. 2023. Analysis of the impact of the Xiaolangdi Reservoir on the runoff of the Yellow River downstream based on CEEMDAN-multiscale information entropy. Water Science & Technology, 88(4): 1058-1073.
|
|
|
| [53] |
Zhou X Y, Huang X R, Zhao H B. 2021. Uncertainty analysis for evaluating flow regime alteration of Jinsha River based on Indicators of Hydrologic Alteration. Hydrological Sciences Journal, 66(12): 1808-1819.
doi: 10.1080/02626667.2021.1962882
|
|
|
| [54] |
Zhu Y, Lin Z, Wang J, et al. 2016. Impacts of climate changes on water resources in Yellow River Basin, China. Procedia Engineering, 154: 687-695.
doi: 10.1016/j.proeng.2016.07.570
|
|
|
|
Viewed |
|
|
|
Full text
|
|
|
|
|
Abstract
|
|
|
|
|
Cited |
|
|
|
|
| |
Shared |
|
|
|
|
| |
Discussed |
|
|
|
|