| Research article |
|


|
|
|
| Scenario simulation of water retention services under land use/cover and climate changes: a case study of the Loess Plateau, China |
SUN Dingzhao1,2,3, LIANG Youjia2,*( ), PENG Shouzhang1 ), PENG Shouzhang1 |
1State Key Laboratory of Soil Erosion and Dryland Farming on the Loess Plateau, Institute of Water and Soil Conservation, Chinese Academy of Sciences and Ministry of Water Resources, Yangling 712100, China
2School of Resources and Environmental Engineering, Wuhan University of Technology, Wuhan 430070, China
3Institute of Surveying and Mapping, Guizhou Geology and Mineral Exploration Bureau, Guiyang 550018, China |
|
|
|
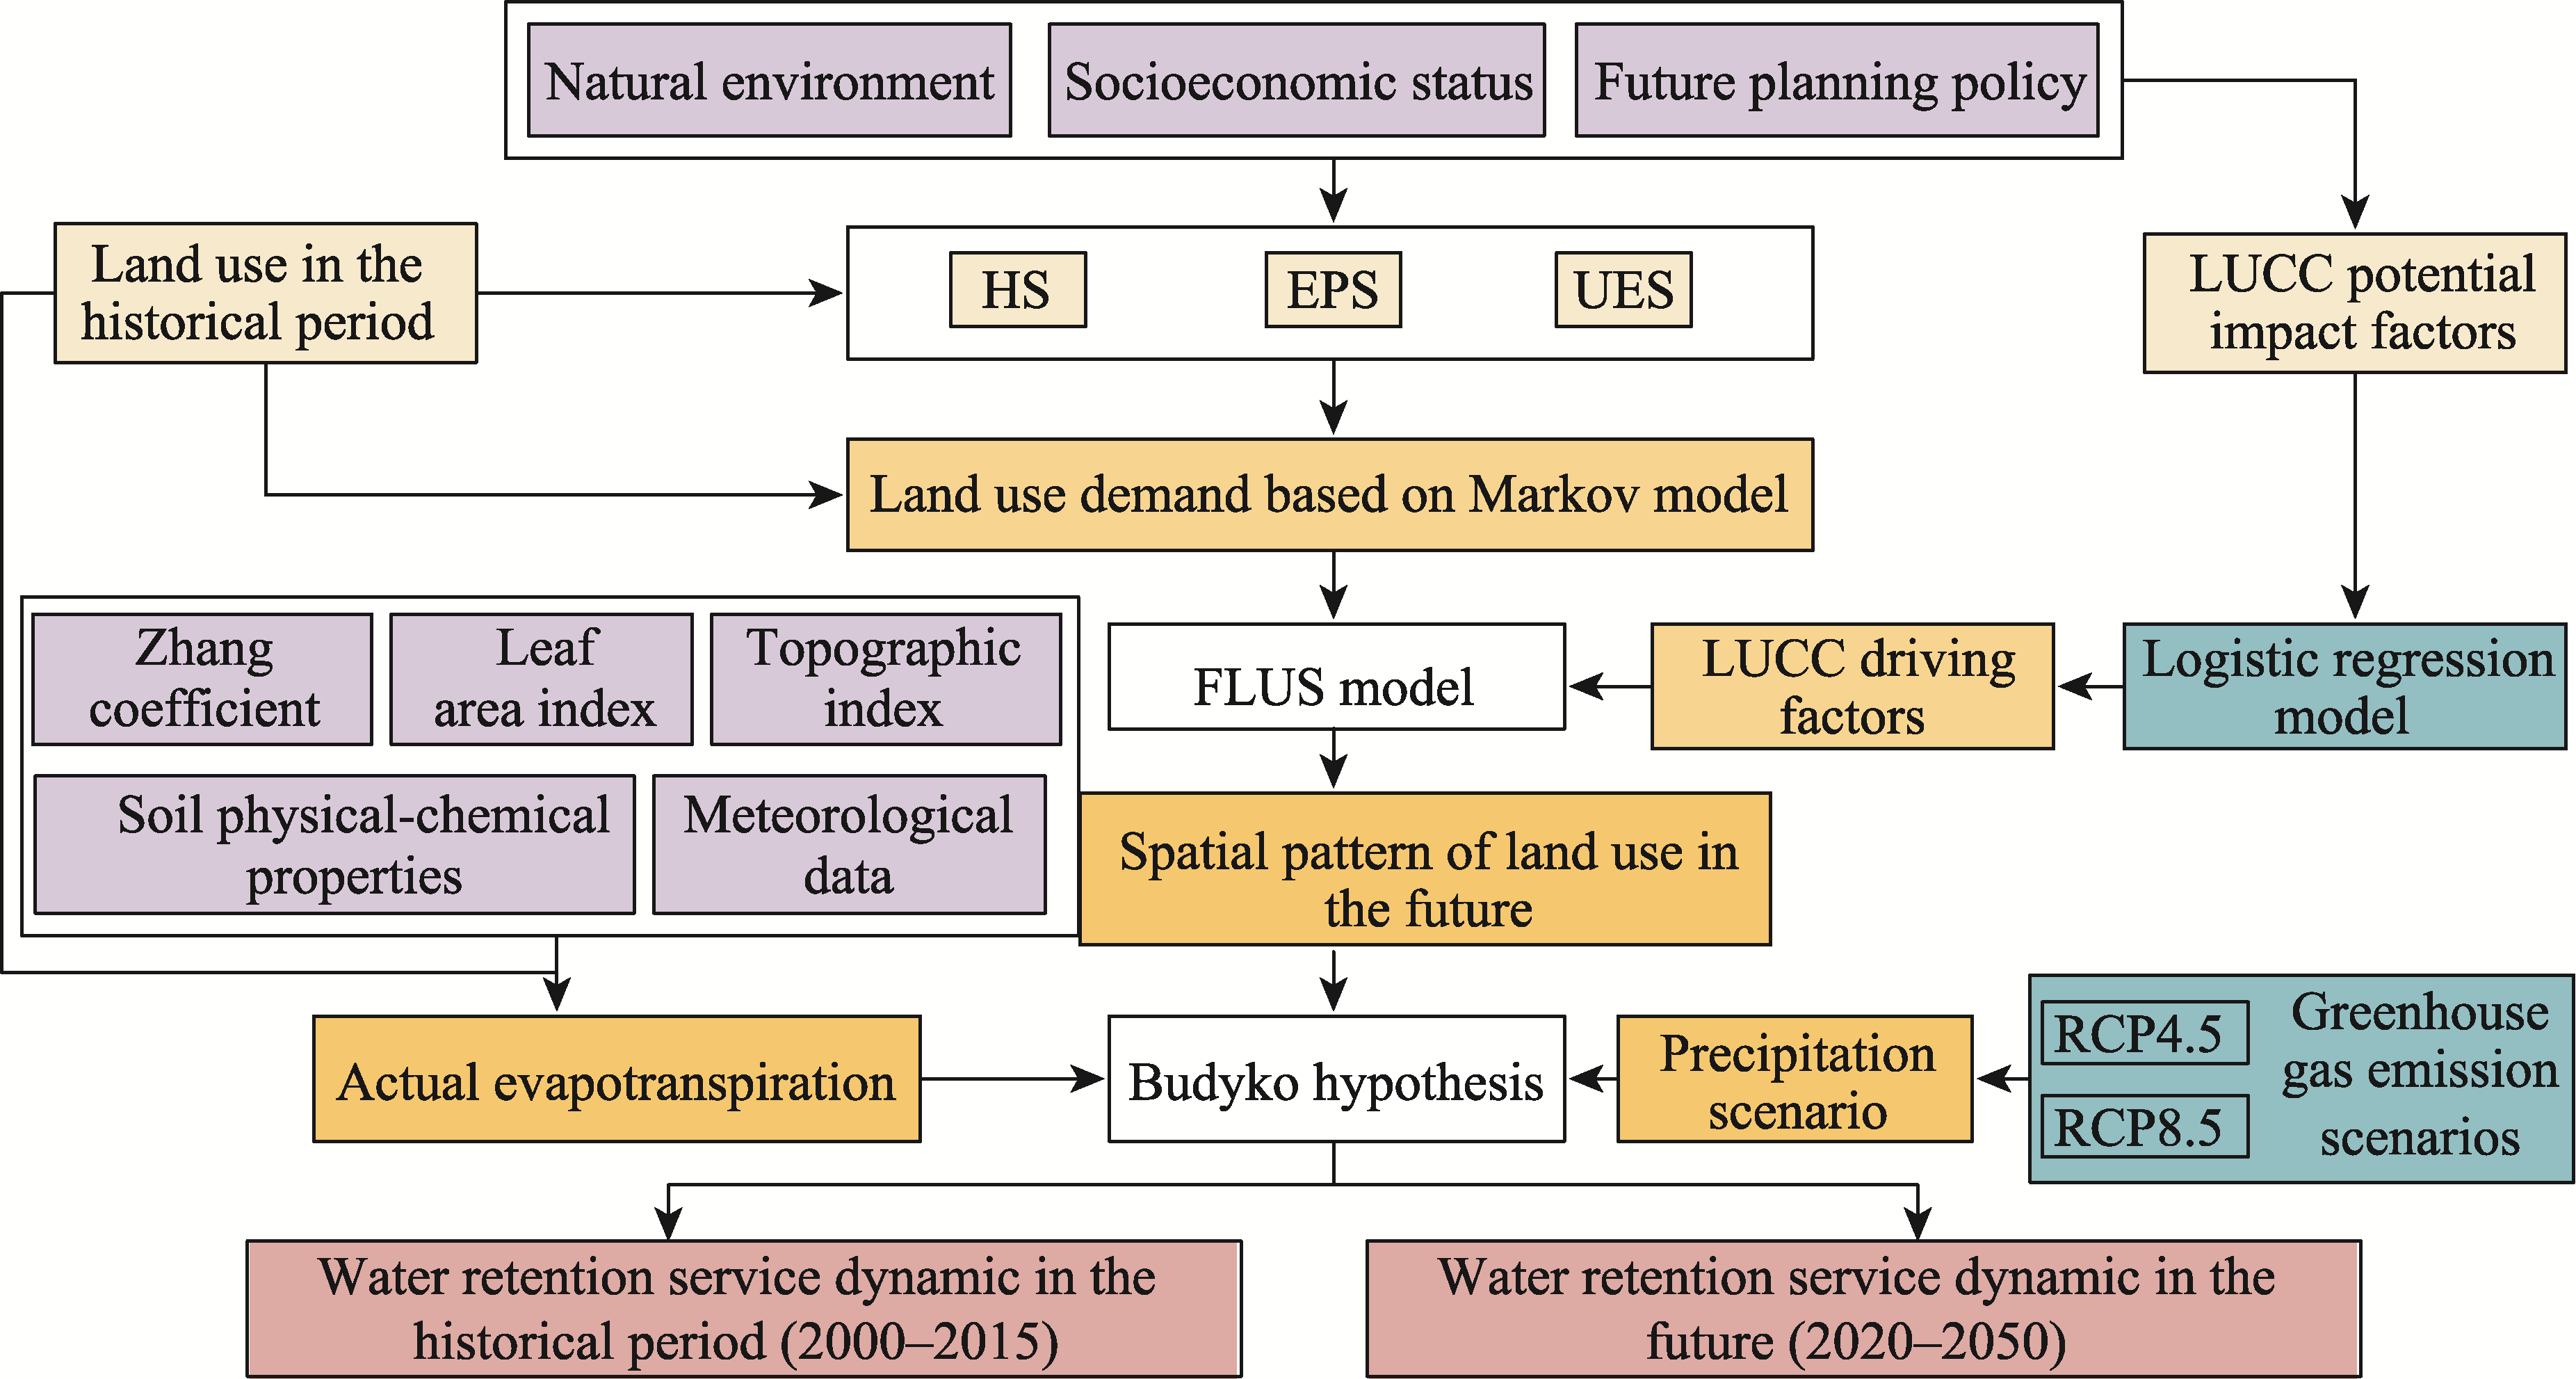
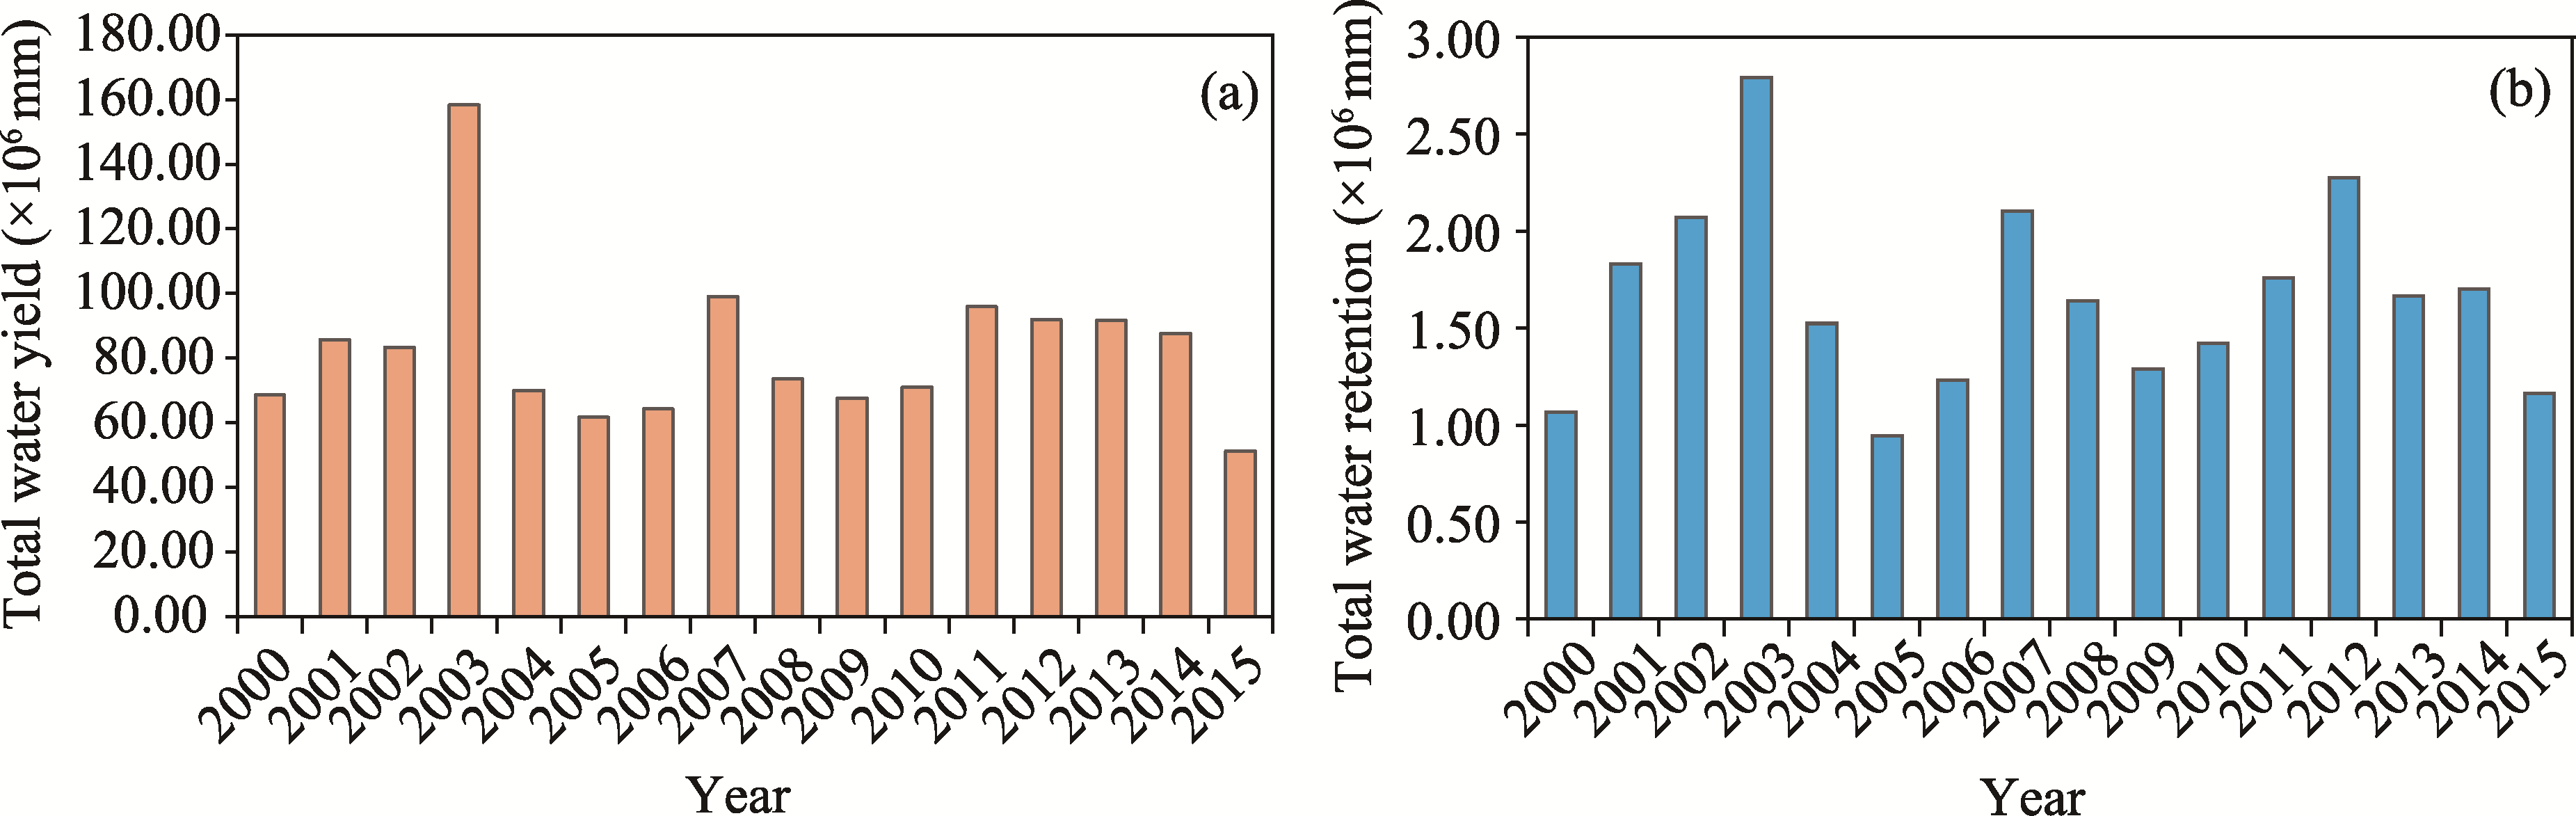
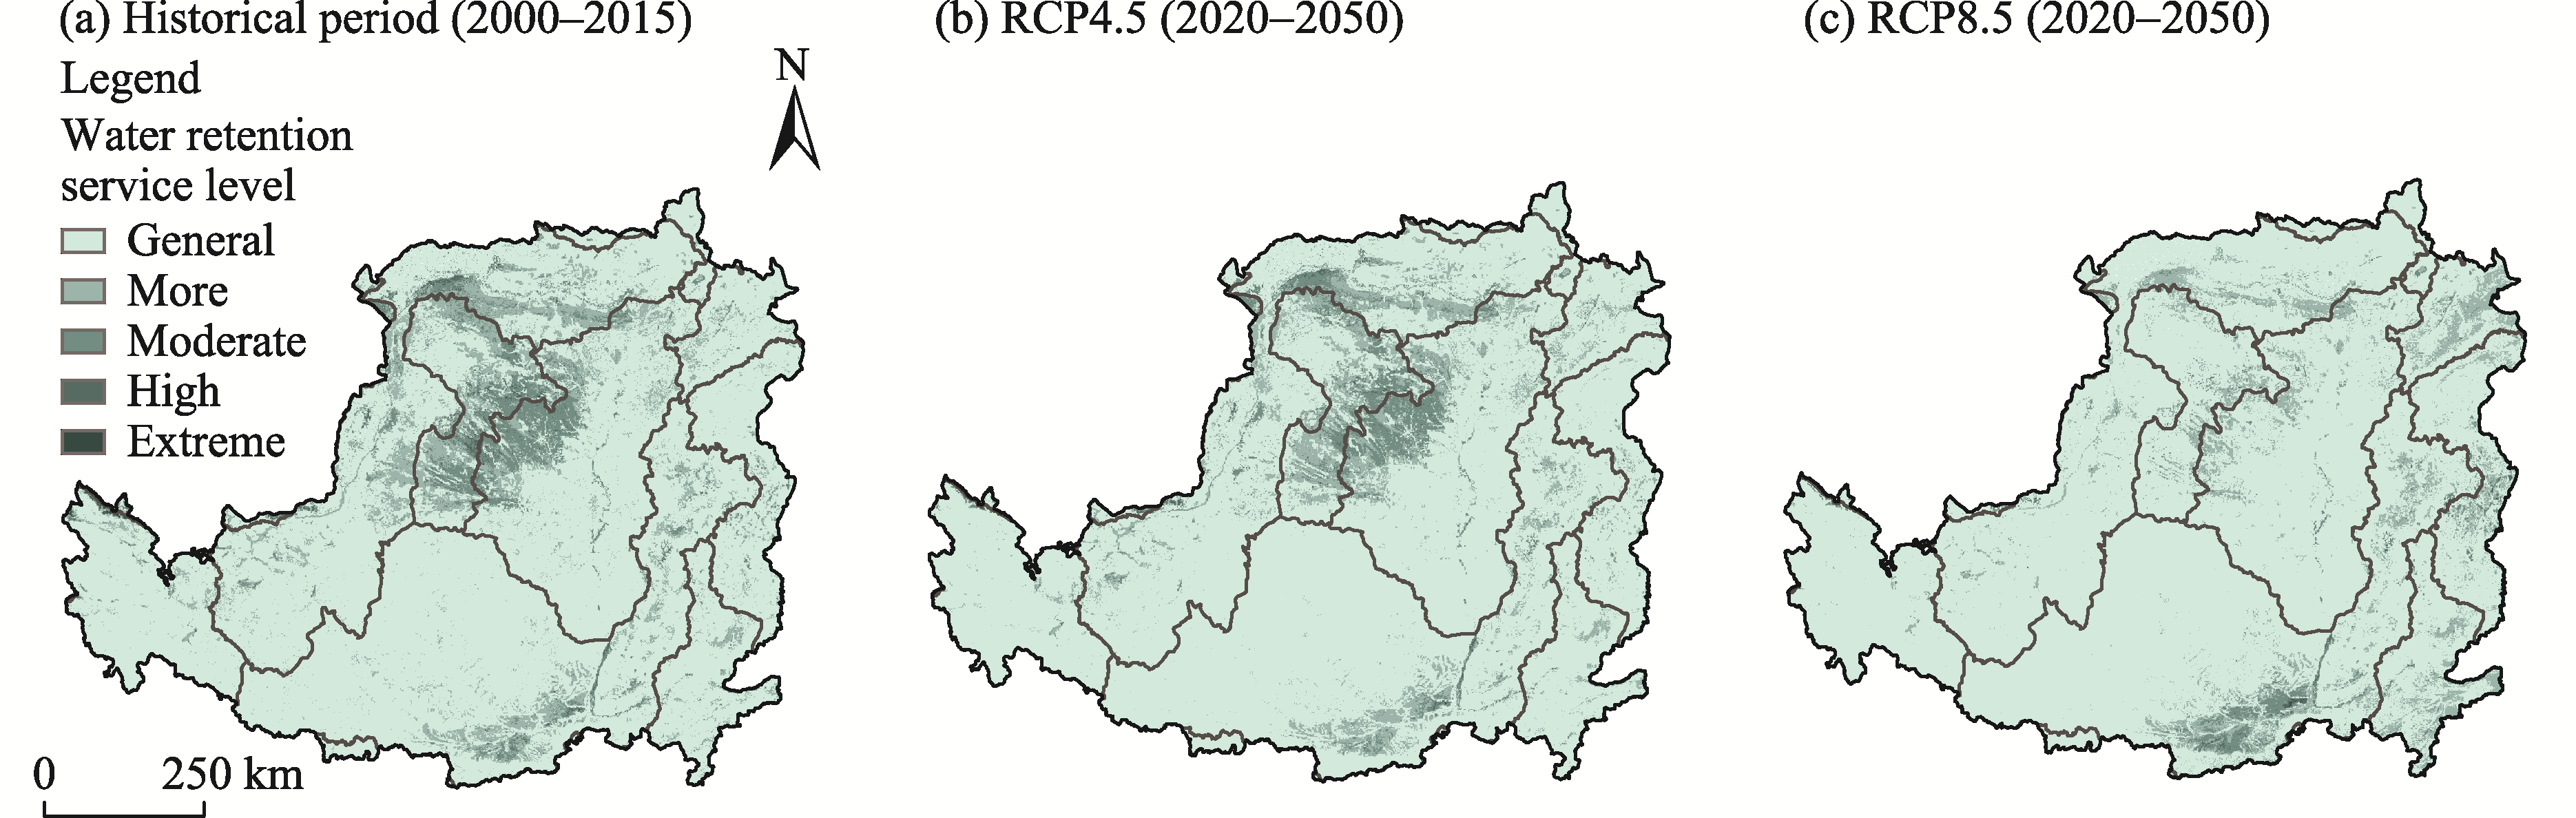
Abstract Comprehensive assessments of ecosystem services in environments under the influences of human activities and climate change are critical for sustainable regional ecosystem management. Therefore, integrated interdisciplinary modelling has become a major focus of ecosystem service assessment. In this study, we established a model that integrates land use/cover change (LUCC), climate change, and water retention services to evaluate the spatial and temporal variations of water retention services in the Loess Plateau of China in the historical period (2000-2015) and in the future (2020-2050). An improved Markov-Cellular Automata (Markov-CA) model was used to simulate land use/land cover patterns, and ArcGIS 10.2 software was used to simulate and assess water retention services from 2000 to 2050 under six combined scenarios, including three land use/land cover scenarios (historical scenario (HS), ecological protection scenario (EPS), and urban expansion scenario (UES)) and two climate change scenarios (RCP4.5 and RCP8.5, where RCP is the representative concentration pathway). LUCCs in the historical period (2000-2015) and in the future (2020-2050) are dominated by transformations among agricultural land, urban land and grassland. Urban land under UES increased significantly by 0.63×10³ km2/a, which was higher than the increase of urban land under HS and EPS. In the Loess Plateau, water yield decreased by 17.20×106 mm and water retention increased by 0.09×106 mm in the historical period (2000-2015), especially in the Interior drainage zone and its surrounding areas. In the future (2020-2050), the pixel means of water yield is higher under RCP4.5 scenario (96.63 mm) than under RCP8.5 scenario (95.46 mm), and the pixel means of water retention is higher under RCP4.5 scenario (1.95 mm) than under RCP8.5 scenario (1.38 mm). RCP4.5-EPS shows the highest total water retention capacity on the plateau scale among the six combined scenarios, with the value of 1.27×106 mm. Ecological restoration projects in the Loess Plateau have enhanced soil and water retention. However, more attention needs to be paid not only to the simultaneous increase in water retention services and evapotranspiration but also to the type and layout of restored vegetation. Furthermore, urbanization needs to be controlled to prevent uncontrollable LUCCs and climate change. Our findings provide reference data for the regional water and land resources management and the sustainable development of socio-ecological systems in the Loess Plateau under LUCC and climate change scenarios.
|
|
Received: 07 August 2021
Published: 30 April 2022
|
|
Corresponding Authors:
*LIANG Youjia (E-mail: yjliang@whut.edu.cn)
|
|
|
| [1] |
Bai Y, Zhuang C W, Ouyang Z Y, et al. 2011. Spatial characteristics between biodiversity and ecosystem services in a human-dominated watershed. Ecological Complexity, 8(2): 177-183.
doi: 10.1016/j.ecocom.2011.01.007
|
|
|
| [2] |
Bai Y, Ochuodho T O, Yang J. 2019. Impact of land use and climate change on water-related ecosystem services in Kentucky, USA. Ecological Indicators, 102: 51-64.
doi: 10.1016/j.ecolind.2019.01.079
|
|
|
| [3] |
Chen H P, Sun J Q, Li H X. 2017. Future changes in precipitation extremes over China using the NEX-GDDP high-resolution daily downscaled data-set. Atmospheric and Oceanic Science Letters, 10(6): 1-8.
doi: 10.1080/16742834.2017.1248755
|
|
|
| [4] |
Chen J Y, Tao C, Wang H M, et al. 2018. Spatio-temporal evolution of water-related ecosystem services: Taihu Basin, China. PeerJ, 6(3): e5041, doi: 10.7717/peerj.5041.
doi: 10.7717/peerj.5041
|
|
|
| [5] |
Chen Y P, Wang K B, Lin Y S, et al. 2015. Balancing green and grain trade. Nature Geoscience, 8: 739-741.
doi: 10.1038/ngeo2544
|
|
|
| [6] |
Costanza R, d'Arge R, de Groot R, et al. 1997. The value of the world's ecosystem services and natural capital. Nature, 387: 253-260.
doi: 10.1038/387253a0
|
|
|
| [7] |
Deng L, Kim D G, Li M Y, et al. 2019. Land-use changes driven by 'Grain for Green' program reduced carbon loss induced by soil erosion on the Loess Plateau of China. Global and Planetary Change, 177: 101-115.
doi: 10.1016/j.gloplacha.2019.03.017
|
|
|
| [8] |
Donohue R J, Roderick M L, McVicar T R. 2012. Roots, storms and soil pores: Incorporating key ecohydrological processes into Budyko's hydrological model. Journal of Hydrology, 436-437: 35-50.
doi: 10.1016/j.jhydrol.2012.02.033
|
|
|
| [9] |
Du X Z, Zhao X, Liang S L, et al. 2020. Quantitatively assessing and attributing land use and land cover changes on China's Loess Plateau. Remote Sensing, 12(3): 353, doi: 10.3390/rs12030353.
doi: 10.3390/rs12030353
|
|
|
| [10] |
Feng X M, Sun G, Fu B J, et al. 2012. Regional effects of vegetation restoration on water yield across the Loess Plateau, China. Hydrology and Earth System Sciences, 16: 2617-2628.
doi: 10.5194/hess-16-2617-2012
|
|
|
| [11] |
Feng X M, Fu B J, Piao S L, et al. 2016a. Revegetation in China's Loess Plateau is approaching sustainable water resource limits. Nature Climate Chang, 6: 1019-1022.
doi: 10.1038/nclimate3092
|
|
|
| [12] |
Feng X M, Cheng W, Fu B, et al. 2016b. The role of climatic and anthropogenic stresses on long-term runoff reduction from the Loess Plateau, China. Science of the Total Environment, 571: 688-698.
doi: 10.1016/j.scitotenv.2016.07.038
|
|
|
| [13] |
Fu B J, Wang S, Liu Y, et al. 2017. Hydrogeomorphic ecosystem responses to natural and anthropogenic changes in the Loess Plateau of China. Annual Review of Earth and Planetary Sciences, 45: 223-243.
doi: 10.1146/annurev-earth-063016-020552
|
|
|
| [14] |
Fu W, Lü Y H, Harris P, et al. 2018. Peri-urbanization may vary with vegetation restoration: A large scale regional analysis. Urban Forestry & Urban Greening, 29: 77-87.
|
|
|
| [15] |
Guan D J, Li H F, Inohae T, et al. 2011. Modeling urban land use change by the integration of cellular automaton and Markov model. Ecological Modelling, 222(20-22): 3761-3772.
doi: 10.1016/j.ecolmodel.2011.09.009
|
|
|
| [16] |
Hackbart V C S, de Lima G T N P, dos Santos R F. 2017. Theory and practice of water ecosystem services valuation: Where are we going? Ecosystem Services, 23: 218-227.
doi: 10.1016/j.ecoser.2016.12.010
|
|
|
| [17] |
He G H, Zhao Y, Wang J H, et al. 2019. Attribution analysis based on Budyko hypothesis for land evapotranspiration change in the Loess Plateau, China. Journal of Arid Land, 11(6): 939-953.
doi: 10.1007/s40333-019-0107-5
|
|
|
| [18] |
Howe C, Suich H, Vira B, et al. 2014. Creating win-wins from trade-offs? Ecosystem services for human well-being: A meta-analysis of ecosystem service trade-offs and synergies in the real world. Global Environmental Change, 28: 263-275.
doi: 10.1016/j.gloenvcha.2014.07.005
|
|
|
| [19] |
Hu J Y, Wu Y P, Wang L J, et al. 2021. Impacts of land-use conversions on the water cycle in a typical watershed in the southern Chinese Loess Plateau. Journal of Hydrology, 593: 125741, doi: 10.1016/j.jhydrol.2020.125741.
doi: 10.1016/j.jhydrol.2020.125741
|
|
|
| [20] |
Hu Y F, Gao M, Batunacun . 2020. Evaluations of water yield and soil erosion in the Shaanxi-Gansu Loess Plateau under different land use and climate change scenarios. Environmental Development, 34: 100488, doi: 10.1016/j.envdev.2019.100488.
doi: 10.1016/j.envdev.2019.100488
|
|
|
| [21] |
Intergovernmental Panel on Climate Change (IPCC). 2017. IPCC Fifth Assessment Report (AR5) Observed Climate Change Impacts Database, Version 2.01. Palisades, NY: NASA Socioeconomic Data and Applications Center (SEDAC). https://doi.org/10.7927/H4FT8J0X.
|
|
|
| [22] |
Jiang C, Zhang H Y, Zhang Z D. 2018. Spatially explicit assessment of ecosystem services in China's Loess Plateau: Patterns, interactions, drivers, and implications. Global and Planetary Change, 161: 41-52.
doi: 10.1016/j.gloplacha.2017.11.014
|
|
|
| [23] |
Kim J S, Choi J S, Choi C L, et al. 2013. Impacts of changes in climate and land use/land cover under IPCC RCP scenarios on stream flow in the Hoeya River Basin, Korea. Science of the Total Environment, 452-453: 181-195.
doi: 10.1016/j.scitotenv.2013.02.005
|
|
|
| [24] |
Kim S W, Jung Y Y. 2020. Application of the InVEST model to quantify the water yield of North Korean forests. Forests, 11(8): 804, doi: 10.3390/f11080804.
doi: 10.3390/f11080804
|
|
|
| [25] |
Li B J, Chen D X, Wu S H, et al. 2016. Spatio-temporal assessment of urbanization impacts on ecosystem services: Case study of Nanjing City, China. Ecological Indicators, 71: 416-427.
doi: 10.1016/j.ecolind.2016.07.017
|
|
|
| [26] |
Li J C, Zhao Y F, Han L Y, et al. 2017. Moisture variation inferred from a nebkha profile correlates with vegetation changes in the southwestern Mu Us Desert of China over one century. Science of the Total Environment, 598: 797-804.
doi: 10.1016/j.scitotenv.2017.03.145
|
|
|
| [27] |
Li W, Macbean N, Ciais P, et al. 2018. Gross and net land cover changes based on plant functional types derived from the annual ESA CCI land cover maps (1992-2015). Earth System Science Data, 10: 219-234.
doi: 10.5194/essd-10-219-2018
|
|
|
| [28] |
Li Z, Zheng F L, Liu W Z. 2012. Spatiotemporal characteristics of reference evapotranspiration during 1961-2009 and its projected changes during 2011-2099 on the Loess Plateau of China. Agricultural and Forest Meteorology, 154-155: 147-155.
doi: 10.1016/j.agrformet.2011.10.019
|
|
|
| [29] |
Liang W, Bai D, Wang F Y, et al. 2015. Quantifying the impacts of climate change and ecological restoration on stream flow changes based on a Budyko hydrological model in China's Loess Plateau. Water Resources Research, 51(8): 6500-6519.
doi: 10.1002/2014WR016589
|
|
|
| [30] |
Liang X, Liu X P, Li X, et al. 2018. Delineating multi-scenario urban growth boundaries with a CA-based FLUS model and morphological method. Landscape and Urban Planning, 177: 47-63.
doi: 10.1016/j.landurbplan.2018.04.016
|
|
|
| [31] |
Lin W B, Sun Y M, Nijhuis S, et al. 2020. Scenario-based flood risk assessment for urbanizing deltas using future land-use simulation (FLUS): Guangzhou Metropolitan Area as a case study. Science of the Total Environment, 739: 139899, doi: 10.1016/j.scitotenv.2020.139899.
doi: 10.1016/j.scitotenv.2020.139899
|
|
|
| [32] |
Liu Q F, Zhang Q, Yan Y Z, et al. 2020. Ecological restoration is the dominant driver of the recent reversal of desertification in the Mu Us Desert (China). Journal of Cleaner Production, 268: 122241, doi: 10.1016/j.jclepro.2020.122241.
doi: 10.1016/j.jclepro.2020.122241
|
|
|
| [33] |
Liu X P, Liang X, Li X, et al. 2017. A future land use simulation model (FLUS) for simulating multiple land use scenarios by coupling human and natural effects. Landscape and Urban Planning, 168: 94-116.
doi: 10.1016/j.landurbplan.2017.09.019
|
|
|
| [34] |
Lü Y H, Fu B J, Feng X M, et al. 2012. A policy-driven large scale ecological restoration: Quantifying ecosystem services changes in the Loess Plateau of China. PLoS ONE, 7(2): e31782, doi: 10.1371%2Fjournal.pone.0031782.
doi: 10.1371%2Fjournal.pone.0031782
|
|
|
| [35] |
Martnez-Harms M J, Balvanera P. 2012. Methods for mapping ecosystem service supply: a review. International Journal of Biodiversity Science, Ecosystem Services & Management, 8(1-2): 17-25.
|
|
|
| [36] |
Meinshausen M, Smith S J, Calvin K, et al. 2011. The RCP greenhouse gas concentrations and their extensions from 1765 to 2300. Climatic Change, 109: 213-241.
doi: 10.1007/s10584-011-0156-z
|
|
|
| [37] |
Minasny B, McBratney A B. 2002. The Neuro-m method for fitting neural network parametric pedotransfer functions. Soil Science Society of America Journal, 66(2): 352-361.
|
|
|
| [38] |
Muller M R, Middleton J. 1994. A Markov model of land-use change dynamics in the Niagara Region, Ontario, Canada. Landscape Ecology, 9: 151-157.
|
|
|
| [39] |
Ochoa V, Urbina-Cardona N. 2017. Tools for spatially modeling ecosystem services:Publication trends, conceptual reflections and future challenges. Ecosystem Services, 26: 155-169.
|
|
|
| [40] |
Okkan U, Kirdemir U. 2016. Downscaling of monthly precipitation using CMIP 5 climate models operated under RCPs. Meteorological Applications, 23(3): 514-528.
doi: 10.1002/met.1575
|
|
|
| [41] |
Peng J, Shen H, Wu W H, et al. 2016. Net primary productivity (NPP) dynamics and associated urbanization driving forces in metropolitan areas: a case study in Beijing City, China. Landscape Ecology, 31: 1077-1092.
doi: 10.1007/s10980-015-0319-9
|
|
|
| [42] |
Peng J, Tian L, Liu Y X, et al. 2017. Ecosystem services response to urbanization in metropolitan areas: Thresholds identification. Science of the Total Environment, 607-608: 706-714.
doi: 10.1016/j.scitotenv.2017.06.218
|
|
|
| [43] |
Perrings C, Duraiappah A, Larigauderie A, et al. 2011. The biodiversity and ecosystem services science-policy interface. Science, 331(6021): 1139-1140.
doi: 10.1126/science.1202400
pmid: 21330488
|
|
|
| [44] |
Pontius R G. 2000. Quantification error versus location error in comparison of categorical maps. Photogrammetric Engineering & Remote Sensing, 66(8): 1101-1016.
|
|
|
| [45] |
Pontius R G, Schneider L C. 2001. Land-cover change model validation by an ROC method for the Ipswich watershed, Massachusetts, USA. Agriculture Ecosystems & Environment, 85: 239-248.
doi: 10.1016/S0167-8809(01)00187-6
|
|
|
| [46] |
Quintas-Soriano C, Castro A J, García-Llorente M, et al. 2014. From supply to social demand: a landscape-scale analysis of the water regulation service. Landscape Ecology, 29: 1069-1082.
doi: 10.1007/s10980-014-0032-0
|
|
|
| [47] |
Raghavan S V, Hur J, Liong S Y. 2018. Evaluations of NASA NEX-GDDP data over Southeast Asia: present and future climates. Climatic Change, 148: 503-518.
doi: 10.1007/s10584-018-2213-3
|
|
|
| [48] |
Rwanga S S, Ndambuki J M. 2017. Accuracy assessment of land use/land cover classification using remote sensing and GIS. International Journal of Geosciences, 8: 611-622.
doi: 10.4236/ijg.2017.84033
|
|
|
| [49] |
Sahany S, Mishra S K, Salunke P. 2019. Historical simulations and climate change projections over India by NCAR CCSM4: CMIP5 vs. NEX-GDDP. Theoretical and Applied Climatology, 135: 1423-1433.
doi: 10.1007/s00704-018-2455-z
|
|
|
| [50] |
Shao R, Zhang B Q, Su T X, et al. 2019. Estimating the increase in regional evaporative water consumption as a result of vegetation restoration over the Loess Plateau, China. Journal of Geophysical Research: Atmospheres, 124(22): 11783-11802.
doi: 10.1029/2019JD031295
|
|
|
| [51] |
Su C H, Fu B J. 2013. Evolution of ecosystem services in the Chinese Loess Plateau under climatic and land use changes. Global and Planetary Change, 101: 119-128.
doi: 10.1016/j.gloplacha.2012.12.014
|
|
|
| [52] |
Sun D Z, LiangY L. 2021. Multi-scenario simulation of land use dynamic in the Loess Plateau using an improved Markov-CA model. Journal of Geo-information Science, 23(5): 825-835.
|
|
|
| [53] |
Sun G, Zhou G Y, Zhang Z Q, et al. 2006. Potential water yield reduction due to forestation across China. Journal of Hydrology, 328(3-4): 548-558.
doi: 10.1016/j.jhydrol.2005.12.013
|
|
|
| [54] |
van Vliet J. 2019. Direct and indirect loss of natural area from urban expansion. Nature Sustainability, 2: 755-763.
doi: 10.1038/s41893-019-0340-0
|
|
|
| [55] |
van Vuuren D P, Edmonds J A, Kainuma M, et al. 2011. A special issue on the RCPs. Climatic Change, 109: 1-4.
|
|
|
| [56] |
Wang J F, Wu T L, Li Q, et al. 2021. Quantifying the effect of environmental drivers on water conservation variation in the eastern Loess Plateau, China. Ecological Indicators, 125: 107493, doi: 10.1016/j.ecolind.2021.107493.
doi: 10.1016/j.ecolind.2021.107493
|
|
|
| [57] |
Wang S, Fu B J, Chen H B, et al. 2018. Regional development boundary of China's Loess Plateau: Water limit and land shortage. Land Use Policy, 74: 130-136.
doi: 10.1016/j.landusepol.2017.03.003
|
|
|
| [58] |
Wang Y C, Zhao J, Fu J W, et al. 2019. Effects of the Grain for Green Program on the water ecosystem services in an arid area of China-Using the Shiyang River Basin as an example. Ecological Indicators, 104: 659-668.
doi: 10.1016/j.ecolind.2019.05.045
|
|
|
| [59] |
Wen X, Théau J. 2020. Spatiotemporal analysis of water-related ecosystem services under ecological restoration scenarios: A case study in northern Shaanxi, China. Science of the Total Environment, 720: 137477, doi: 10.1016/j.scitotenv.2020.137477.
doi: 10.1016/j.scitotenv.2020.137477
|
|
|
| [60] |
Wu X T, Wang S, Fu B J, et al. 2019. Socio-ecological changes on the Loess Plateau of China after Grain to Green Program. Science of the Total Environment, 678: 565-573.
doi: 10.1016/j.scitotenv.2019.05.022
|
|
|
| [61] |
Zhang B Q, Wu P T, Zhao X N, et al. 2014. Spatiotemporal analysis of climate variability (1971-2010) in spring and summer on the Loess Plateau, China. Hydrological Processes, 28(4): 1689-1702.
doi: 10.1002/hyp.9724
|
|
|
|
Viewed |
|
|
|
Full text
|
|
|
|
|
Abstract
|
|
|
|
|
Cited |
|
|
|
|
| |
Shared |
|
|
|
|
| |
Discussed |
|
|
|
|