| Research article |
|


|
|
|
| Projection of precipitation extremes over South Asia from CMIP6 GCMs |
Adnan ABBAS1, Asher S BHATTI2, Safi ULLAH3, Waheed ULLAH1, Muhammad WASEEM4, ZHAO Chengyi1,*( ), DOU Xin1, Gohar ALI5 ), DOU Xin1, Gohar ALI5 |
1Land Science Research Center, Nanjing University of Information Science & Technology, Nanjing 210044, China
2Department of Geology, Bacha Khan University, Charsadda 24420, Pakistan
3Department of Atmospheric and Oceanic Sciences/Institute of Atmospheric Sciences, Fudan University, Shanghai 200438, China
4Center of Excellence in Water Resources, University of Engineering and Technology, Lahore 54890, Pakistan
5Pakistan Meteorological Department, Sector H-8/2, Islamabad 44000, Pakistan |
|
|
|
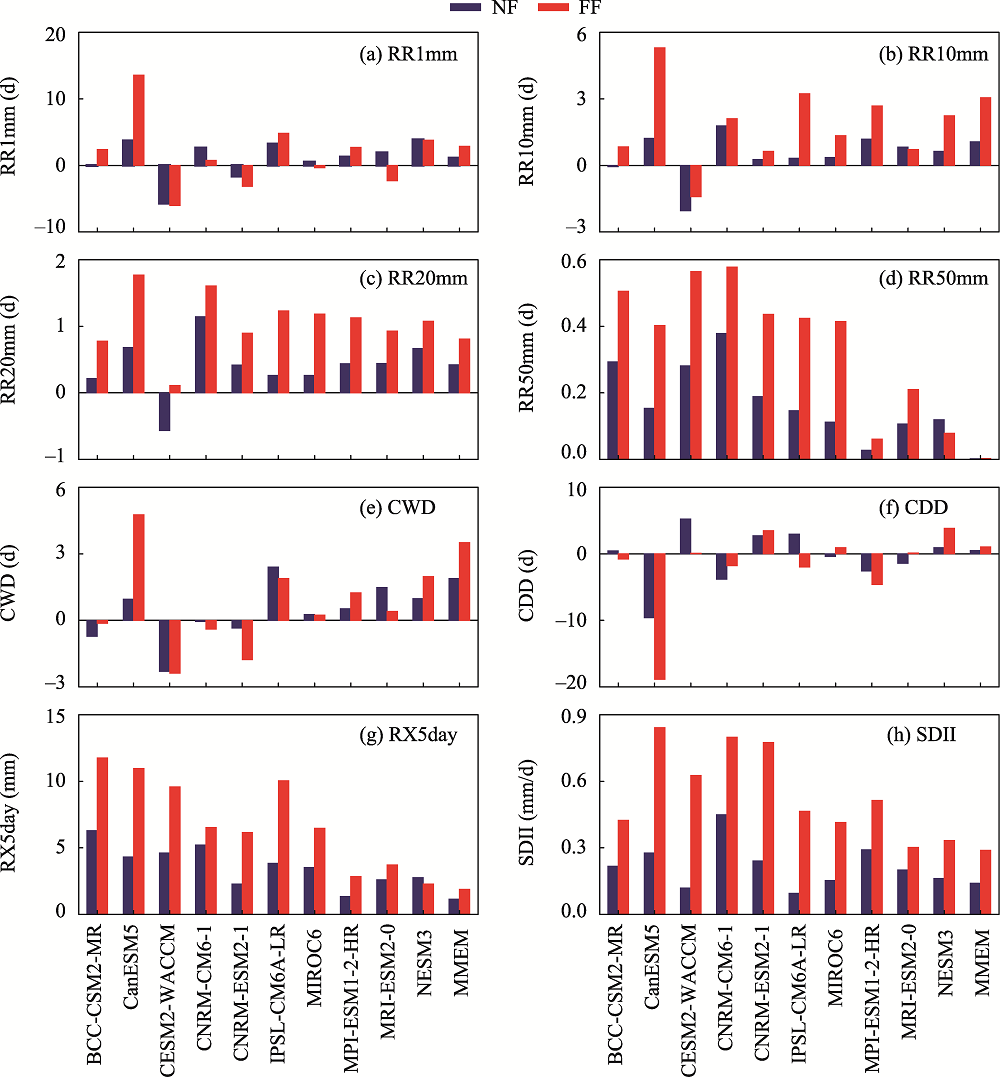
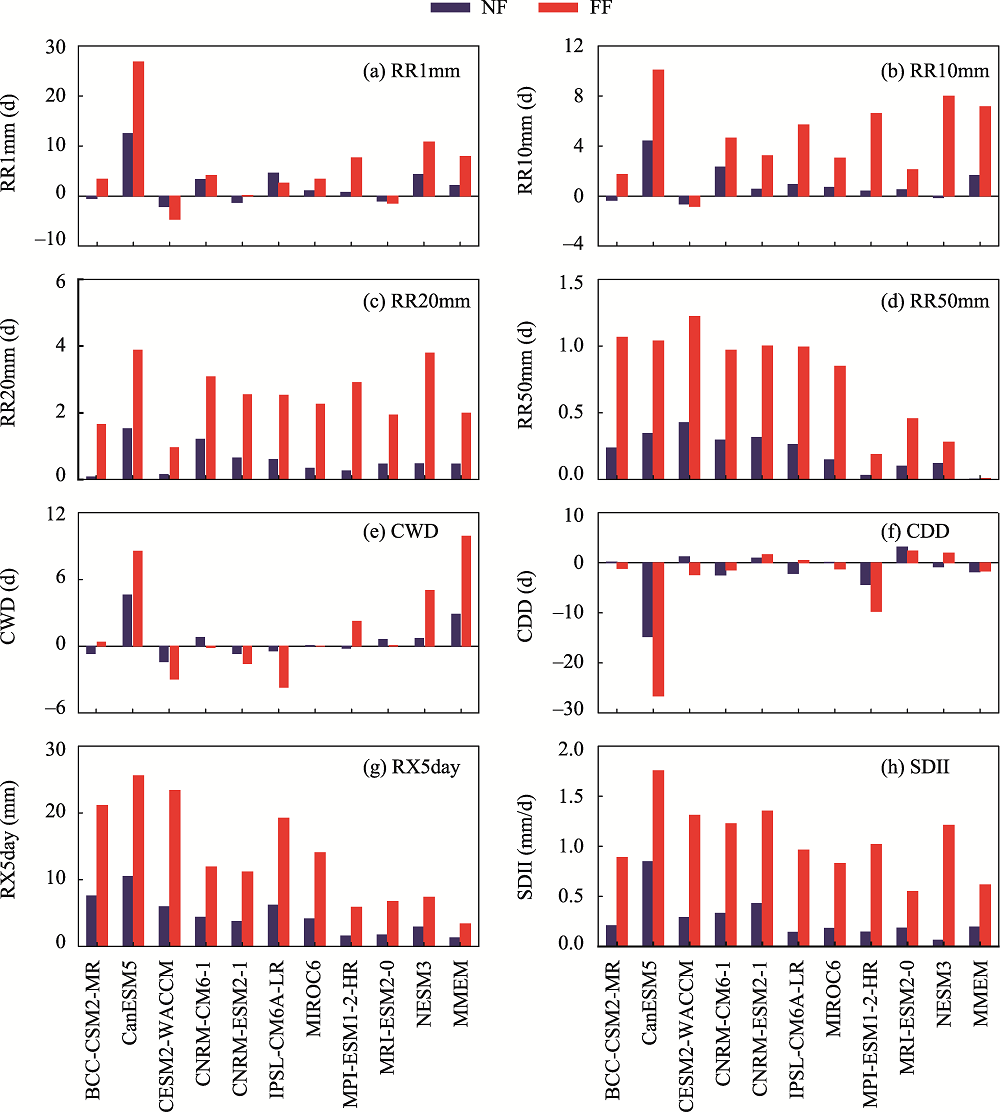
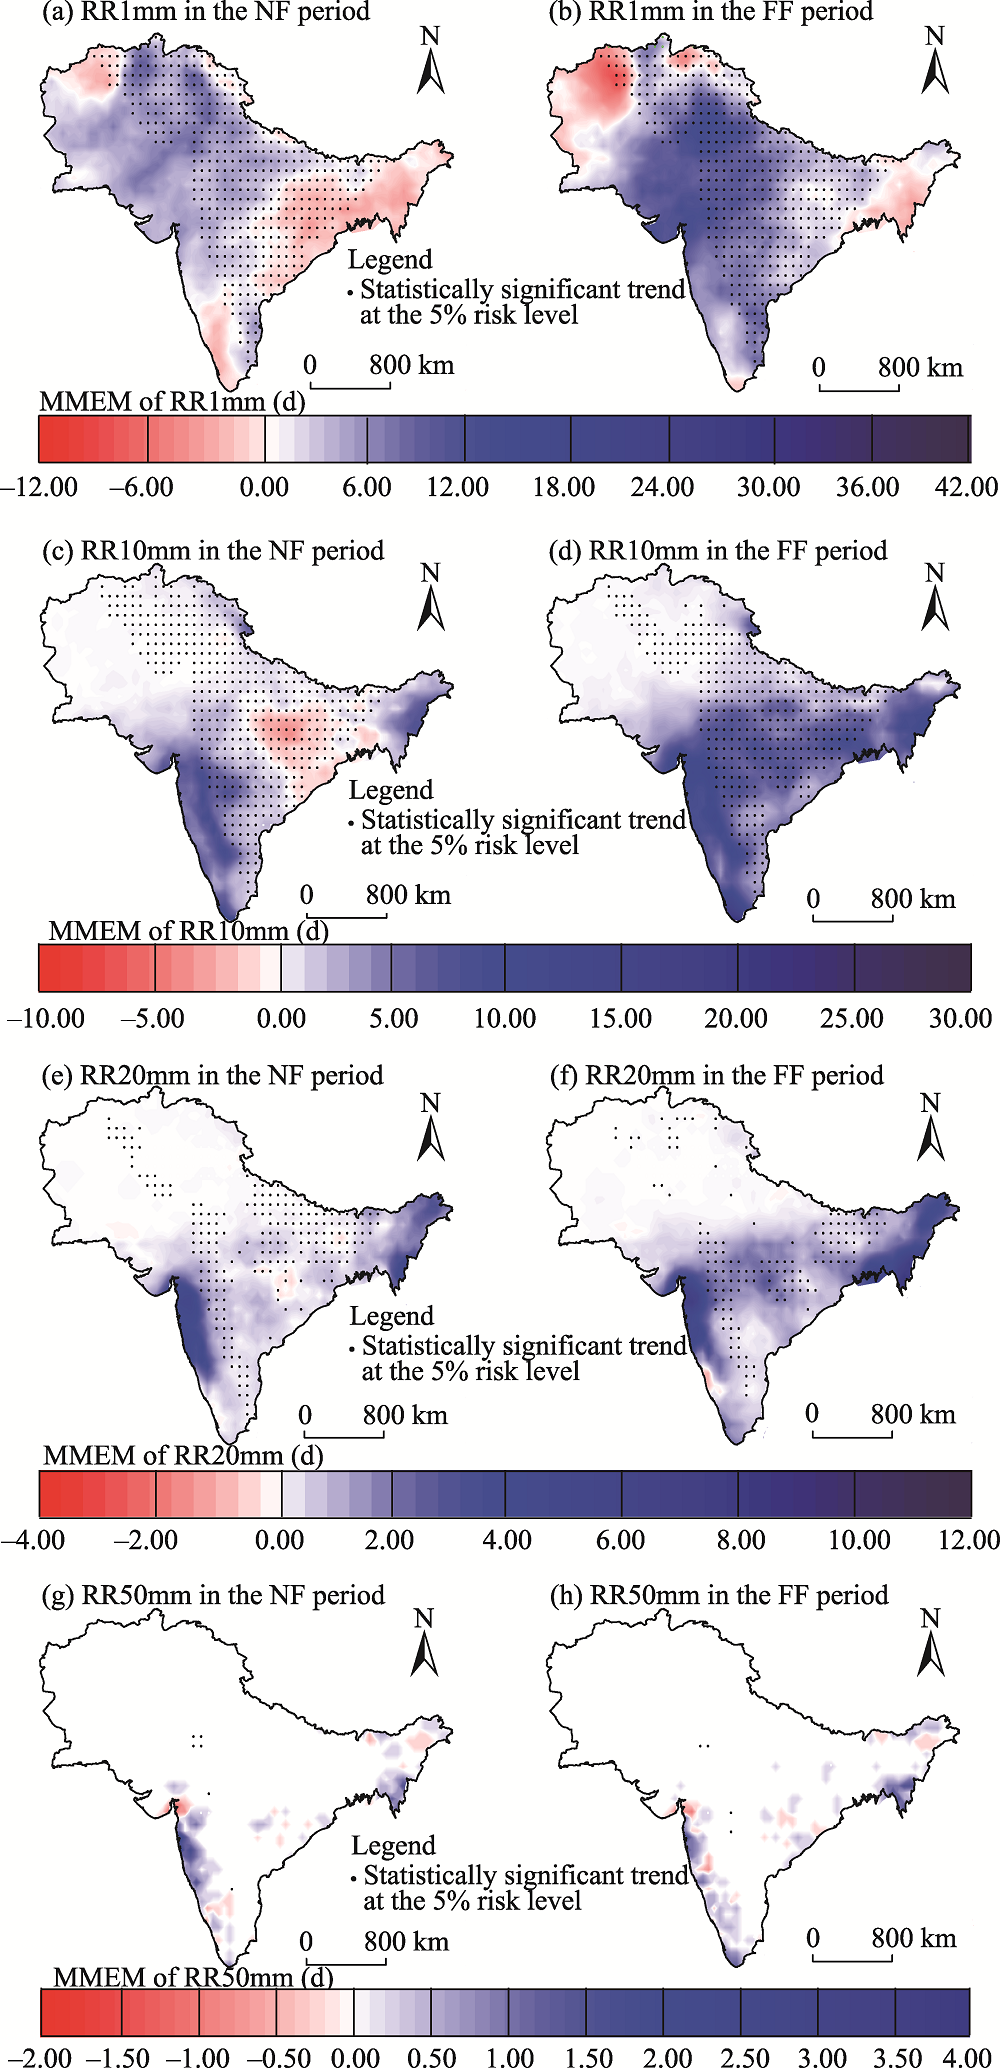
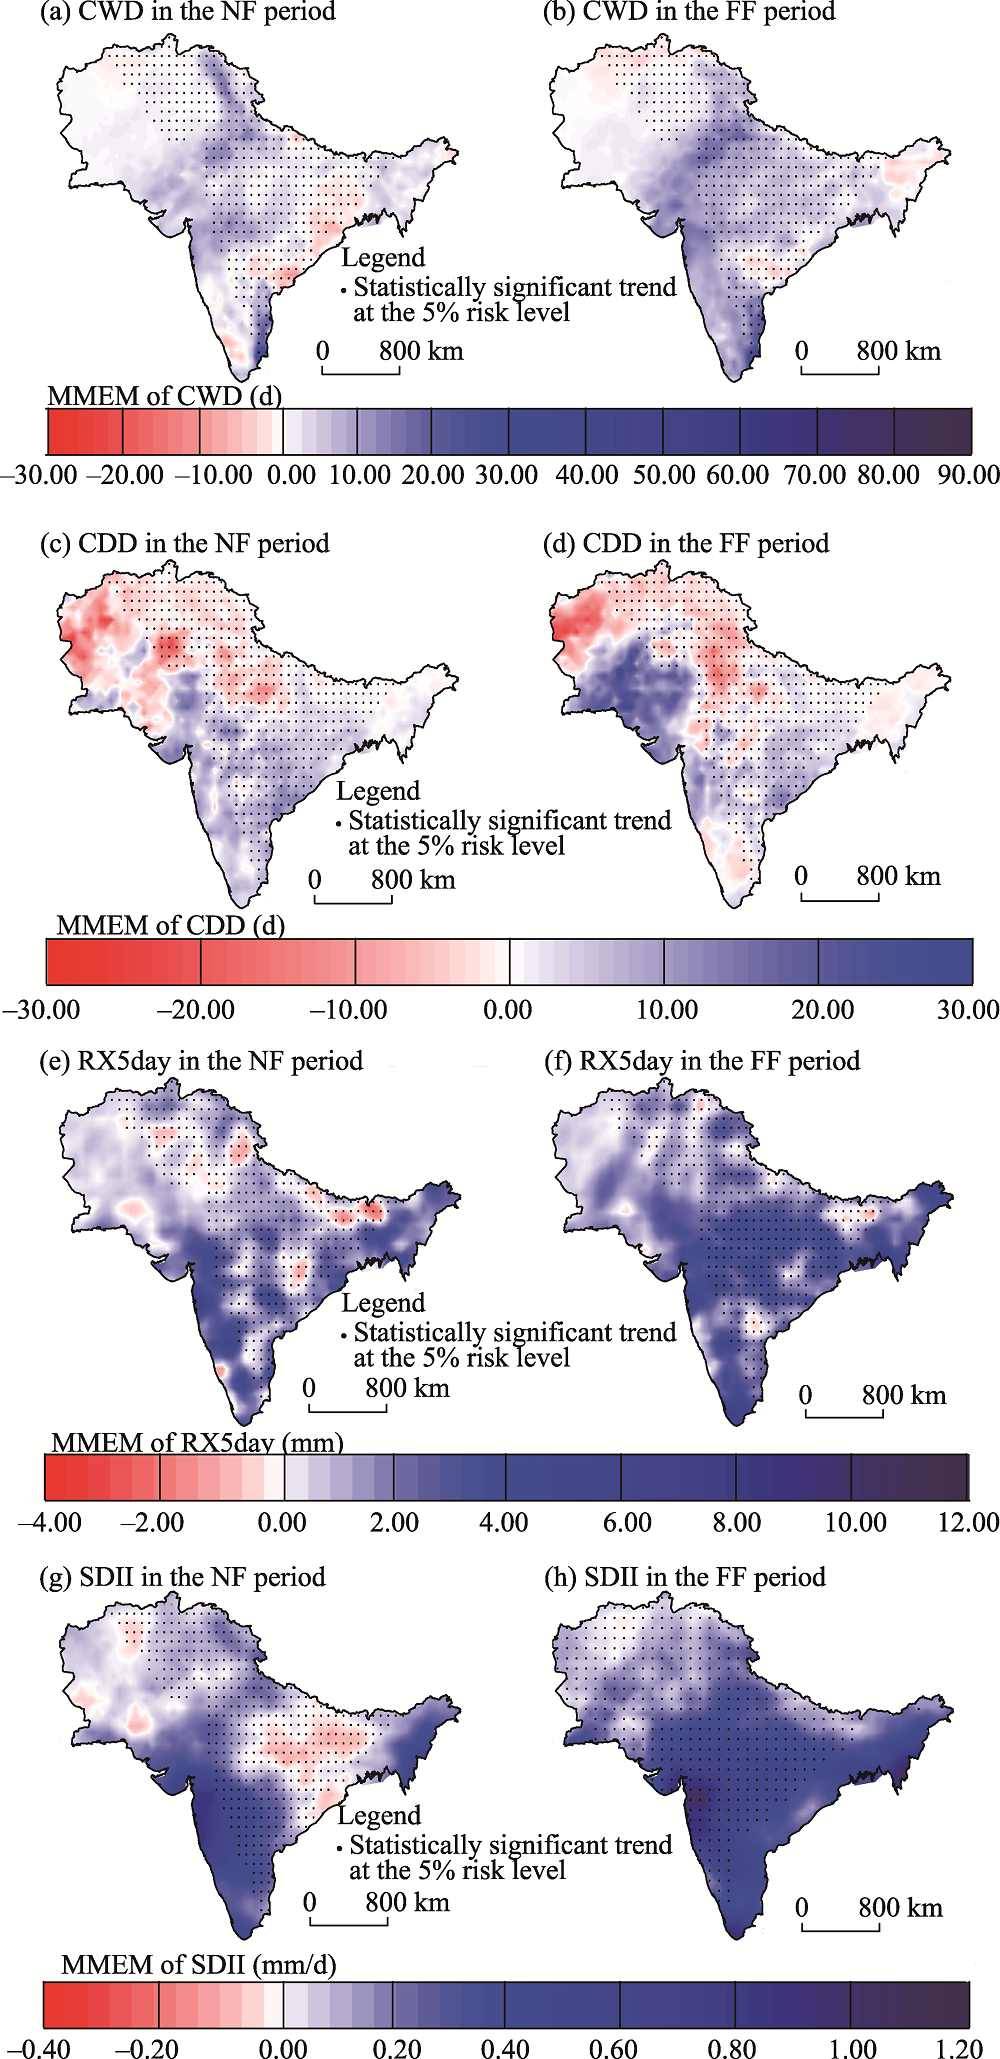
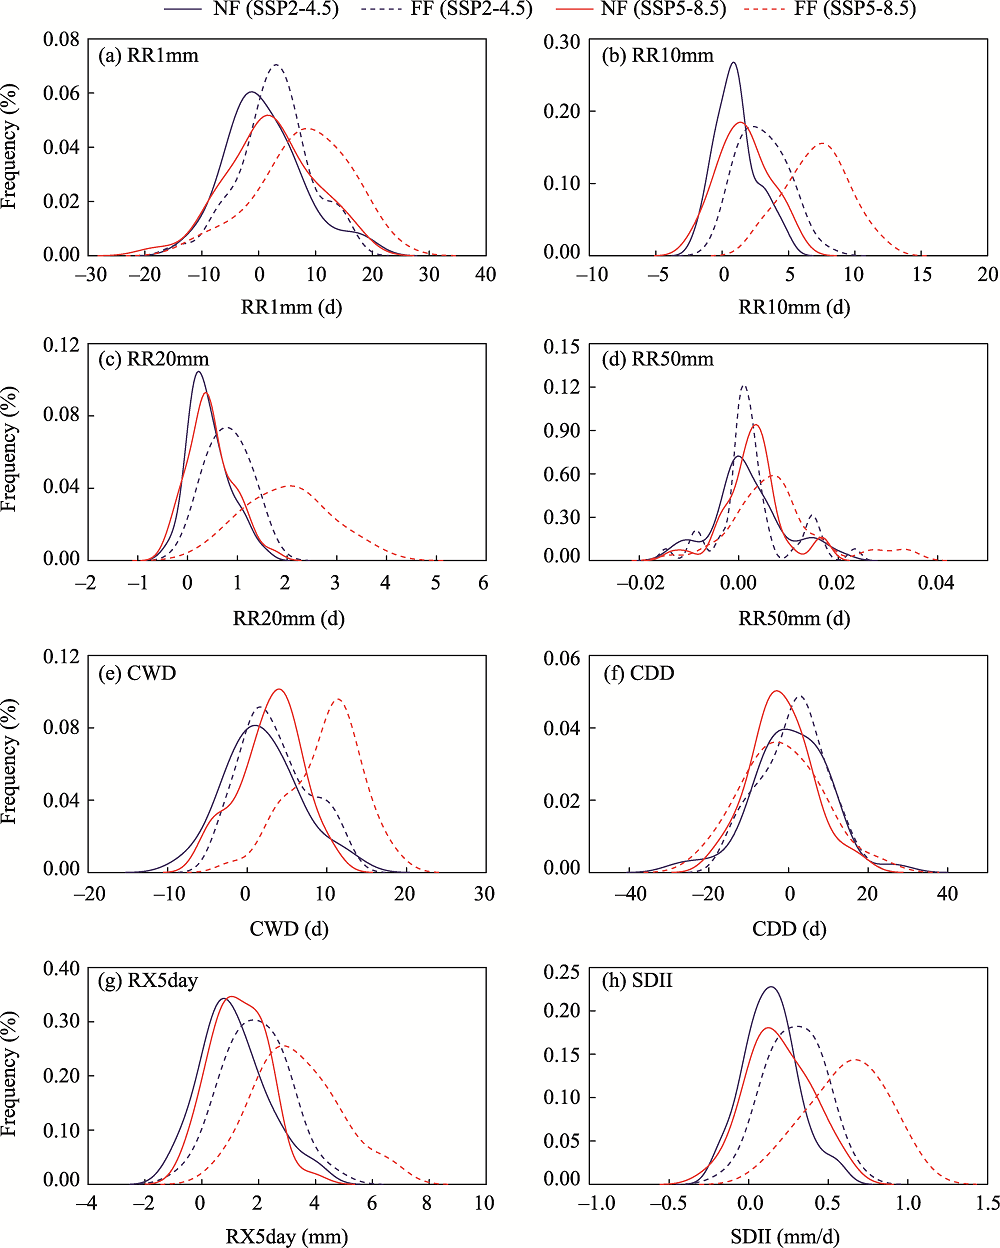
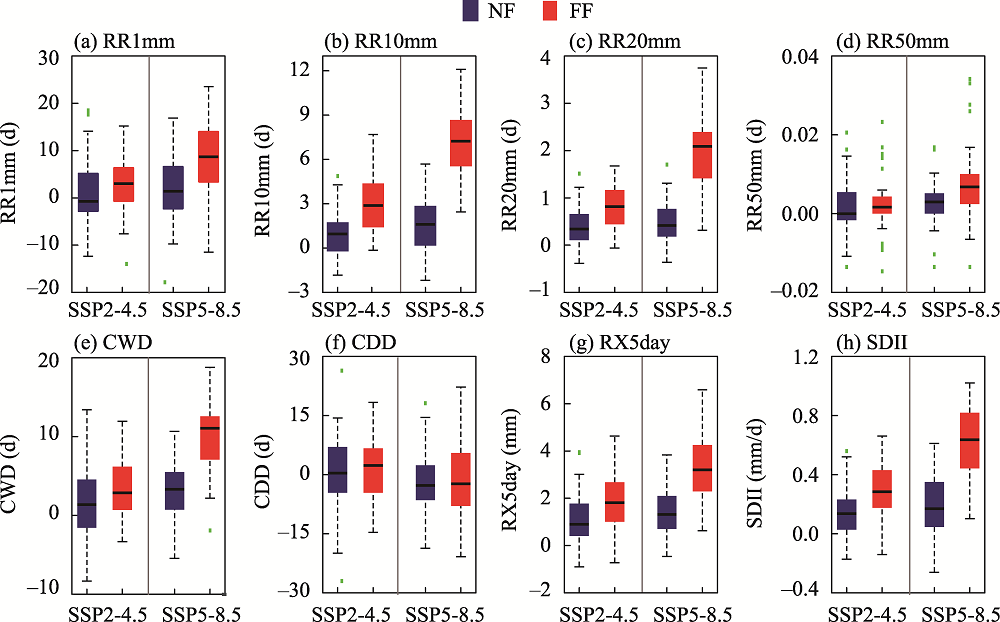
Abstract Extreme precipitation events are one of the most dangerous hydrometeorological disasters, often resulting in significant human and socio-economic losses worldwide. It is therefore important to use current global climate models to project future changes in precipitation extremes. The present study aims to assess the future changes in precipitation extremes over South Asia from the Coupled Model Intercomparison Project Phase 6 (CMIP6) Global Climate Models (GCMs). The results were derived using the modified Mann-Kendall test, Sen's slope estimator, student's t-test, and probability density function approach. Eight extreme precipitation indices were assessed, including wet days (RR1mm), heavy precipitation days (RR10mm), very heavy precipitation days (RR20mm), severe precipitation days (RR50mm), consecutive wet days (CWD), consecutive dry days (CDD), maximum 5-day precipitation amount (RX5day), and simple daily intensity index (SDII). The future changes were estimated in two time periods for the 21st century (i.e., near future (NF; 2021-2060) and far future (FF; 2061-2100)) under two Shared Socioeconomic Pathway (SSP) scenarios (SSP2-4.5 and SSP5-8.5). The results suggest increases in the frequency and intensity of extreme precipitation indices under the SSP5-8.5 scenario towards the end of the 21st century (2061-2100). Moreover, from the results of multimodel ensemble means (MMEMs), extreme precipitation indices of RR1mm, RR10mm, RR20mm, CWD, and SDII demonstrate remarkable increases in the FF period under the SSP5-8.5 scenario. The spatial distribution of extreme precipitation indices shows intensification over the eastern part of South Asia compared to the western part. The probability density function of extreme precipitation indices suggests a frequent (intense) occurrence of precipitation extremes in the FF period under the SSP5-8.5 scenario, with values up to 35.00 d for RR1mm and 25.00-35.00 d for CWD. The potential impacts of heavy precipitation can pose serious challenges to the study area regarding flooding, soil erosion, water resource management, food security, and agriculture development.
|
|
Received: 10 May 2022
Published: 31 March 2023
|
|
Corresponding Authors:
* ZHAO Chengyi (E-mail: zhaocy@nuist.edu.cn)
|
| About author: First author contact:The first and second authors contributed equally to this work. |
|
|
| [1] |
Abbas A, Ullah S, Ullah W, et al. 2022. Evaluation and projection of precipitation in Pakistan using the Coupled Model Intercomparison Project Phase 6 model simulations. International Journal of Climatology, 42(13): 6665-6684.
doi: 10.1002/joc.v42.13
|
|
|
| [2] |
Abbas F, Rehman I, Adrees M, et al. 2018. Prevailing trends of climatic extremes across Indus-Delta of Sindh-Pakistan. Theoretical and Applied Climatology, 131(3-4): 1101-1117.
doi: 10.1007/s00704-016-2028-y
|
|
|
| [3] |
Ahmed K, Shahid S, Nawaz N. 2018. Impacts of climate variability and change on seasonal drought characteristics of Pakistan. Atmospheric Research, 214: 364-374.
doi: 10.1016/j.atmosres.2018.08.020
|
|
|
| [4] |
Ahmed K, Shahid S, Wang X J, et al. 2019. Spatiotemporal changes in aridity of Pakistan during 1901-2016. Hydrology and Earth System Sciences, 23(7): 3081-3096.
doi: 10.5194/hess-23-3081-2019
|
|
|
| [5] |
Akinsanola A A, Ongoma V, Kooperman G J. 2021. Evaluation of CMIP 6 models in simulating the statistics of extreme precipitation over Eastern Africa. Atmospheric Research, 254: 105509, doi: 10.1016/j.atmosres.2021.105509.
doi: 10.1016/j.atmosres.2021.105509
|
|
|
| [6] |
Alashan S. 2020. Combination of modified Mann-Kendall method and Şen innovative trend analysis. Engineering Reports, 2(3): e12131, doi: 10.1002/eng2.12131.
doi: 10.1002/eng2.12131
|
|
|
| [7] |
Allen M R, Ingram W J. 2002. Constraints on future changes in climate and the hydrologic cycle. Nature, 419(6903): 224-232.
doi: 10.1038/nature01092
|
|
|
| [8] |
Almazroui M, Kamil S, Ammar K, et al. 2016. Climatology of the 500-hPa Mediterranean storms associated with Saudi Arabia wet season precipitation. Climate Dynamics, 47(9-10): 3029-3042.
doi: 10.1007/s00382-016-3011-0
|
|
|
| [9] |
Almazroui M, Raju P V S, Yusef A, et al. 2018. Simulation of extreme rainfall event of November 2009 over Jeddah, Saudi Arabia: the explicit role of topography and surface heating. Theoretical and Applied Climatology, 132(1-2): 89-101.
doi: 10.1007/s00704-017-2080-2
|
|
|
| [10] |
Almazroui M, Saeed S, Saeed F, et al. 2020. Projections of precipitation and temperature over the South Asian Countries in CMIP6. Earth Systems and Environment, 4: 297-320.
doi: 10.1007/s41748-020-00157-7
|
|
|
| [11] |
Almazroui M, Islam M N, Saeed F, et al. 2021. Projected changes in temperature and precipitation over the United States, Central America, and the Caribbean in CMIP6 GCMs. Earth Systems and Environment, 5: 1-24.
doi: 10.1007/s41748-021-00199-5
|
|
|
| [12] |
Andrijevic M, Byers E, Mastrucci A, et al. 2021. Future cooling gap in shared socioeconomic pathways. Environmental Research Letters, 16(9): 094053, doi: 10.1088/1748-9326/ac2195.
doi: 10.1088/1748-9326/ac2195
|
|
|
| [13] |
Ayugi B, Dike V, Ngoma H, et al. 2021. Future changes in precipitation extremes over East Africa based on CMIP6 models. Water, 13(17): 2358, doi: 10.3390/w13172358.
doi: 10.3390/w13172358
|
|
|
| [14] |
Azad A K, Hossain K M, Nasreen M. 2013. Flood-induced vulnerabilities and problems encountered by women in northern Bangladesh. International Journal of Disaster Risk Science, 4: 190-199.
doi: 10.1007/s13753-013-0020-z
|
|
|
| [15] |
Bandara J S, Cai Y Y. 2014. The impact of climate change on food crop productivity, food prices and food security in South Asia. Economic Analysis and Policy, 44(4): 451-465.
doi: 10.1016/j.eap.2014.09.005
|
|
|
| [16] |
Bhatti A S, Wang G J, Ullah W, et al. 2020. Trend in extreme precipitation indices based on long term in situ precipitation records over Pakistan. Water, 12(3): 797, doi: 10.3390/w12030797.
doi: 10.3390/w12030797
|
|
|
| [17] |
Blain G C. 2013. The modified Mann-Kendall test: on the performance of three variance correction approaches. Bragantia, 72(4): 416-425.
doi: 10.1590/brag.2013.045
|
|
|
| [18] |
Chen F H, Chen J H, Huang W, et al. 2019. Westerlies Asia and monsoonal Asia: Spatiotemporal differences in climate change and possible mechanisms on decadal to sub-orbital timescales. Earth-Science Reviews, 192: 337-354.
doi: 10.1016/j.earscirev.2019.03.005
|
|
|
| [19] |
Chen H P, Sun J Q. 2019. Increased population exposure to extreme droughts in China due to 0.5°C of additional warming. Environmental Research Letters, 14(6): 064011, doi: 10.1088/1748-9326/ab072e.
doi: 10.1088/1748-9326/ab072e
|
|
|
| [20] |
Chen X L, Zhou T J. 2015. Distinct effects of global mean warming and regional sea surface warming pattern on projected uncertainty in the South Asian summer monsoon. Geophysical Research Letters, 42(21): 9433-9439.
doi: 10.1002/2015GL066384
|
|
|
| [21] |
Chen Z M, Zhou T J, Zhang L X, et al. 2020. Global land monsoon precipitation changes in CMIP6 projections. Geophysical Research Letters, 47(14): e2019GL086902, doi: 10.1029/2019GL086902.
doi: 10.1029/2019GL086902
|
|
|
| [22] |
Christensen O B, Christensen J H. 2004. Intensification of extreme European summer precipitation in a warmer climate. Global and Planetary Change, 44(1-4): 107-117.
doi: 10.1016/j.gloplacha.2004.06.013
|
|
|
| [23] |
Dimri A P, Niyogi D, Barros A P, et al. 2015. Western disturbances: A review. Reviews of Geophysics, 53(2): 225-246.
doi: 10.1002/2014RG000460
|
|
|
| [24] |
Endo H, Kitoh A. 2014. Thermodynamic and dynamic effects on regional monsoon rainfall changes in a warmer climate. Geophysical Research Letters, 41(5): 1704-1710.
doi: 10.1002/2013GL059158
|
|
|
| [25] |
Filippi L, Palazzi E, von Hardenberg J, et al. 2014. Multidecadal variations in the relationship between the NAO and winter precipitation in the Hindu Kush-Karakoram. Journal of Climate, 27(20): 7890-7902.
doi: 10.1175/JCLI-D-14-00286.1
|
|
|
| [26] |
Fischer E M, Sippel S, Knutti R. 2021. Increasing probability of record-shattering climate extremes. Nature Climate Change, 11(8): 689-695.
doi: 10.1038/s41558-021-01092-9
|
|
|
| [27] |
Fróna D, Szenderák J, Harangi-Rákos M. 2021. Economic effects of climate change on global agricultural production. Nature Conservation, 44: 117-139.
doi: 10.3897/natureconservation.44.64296
|
|
|
| [28] |
Gidden M J, Riahi K, Smith S J, et al. 2019. Global emissions pathways under different socioeconomic scenarios for use in CMIP6: A dataset of harmonized emissions trajectories through the end of the century. Geoscientific Model Development, 12(4): 1443-1475.
doi: 10.5194/gmd-12-1443-2019
|
|
|
| [29] |
Gupta V, Jain M K. 2018. Investigation of multi-model spatiotemporal mesoscale drought projections over India under climate change scenario. Journal of Hydrology, 567: 489-509.
doi: 10.1016/j.jhydrol.2018.10.012
|
|
|
| [30] |
Hamed K H, Rao A R. 1998. A modified Mann-Kendall trend test for autocorrelated data. Journal of Hydrology, 204(1-4): 182-196.
doi: 10.1016/S0022-1694(97)00125-X
|
|
|
| [31] |
Hanf F S, Annamalai H, Rinke A, et al. 2017. South Asian summer monsoon breaks: Process-based diagnostics in HIRHAM5. Journal of Geophysical Research: Atmospheres, 122(9): 4880-4902.
doi: 10.1002/jgrd.v122.9
|
|
|
| [32] |
Held I M, Soden B J. 2006. Robust responses of the hydrological cycle to global warming. Journal of Climate, 19(21): 5686-5699.
doi: 10.1175/JCLI3990.1
|
|
|
| [33] |
Herring S C, Christidis N, Hoell A, et al. 2021. Explaining extreme events of 2019 from a climate perspective. Bulletin of the American Meteorological Society, 102(1): S1-S115.
|
|
|
| [34] |
Hulme M. 2016. 1.5°C and climate research after the Paris Agreement. Nature Climate Change, 6(3): 222-224.
doi: 10.1038/nclimate2939
|
|
|
| [35] |
Hunt K M R, Turner A G, Shaffrey L C. 2018. The evolution, seasonality and impacts of western disturbances. Quarterly Journal of the Royal Meteorological Society, 144(710): 278-290.
doi: 10.1002/qj.2018.144.issue-710
|
|
|
| [36] |
Hussain M, Liu G J, Yousaf B, et al. 2018. Regional and sectoral assessment on climate-change in Pakistan: Social norms and indigenous perceptions on climate-change adaptation and mitigation in relation to global context. Journal of Cleaner Production, 200: 791-808.
doi: 10.1016/j.jclepro.2018.07.272
|
|
|
| [37] |
Immerzeel W W, Wanders N, Lutz A F, et al. 2015. Reconciling high-altitude precipitation in the upper Indus basin with glacier mass balances and runoff. Hydrology and Earth System Sciences, 19(11): 4673-4687.
doi: 10.5194/hess-19-4673-2015
|
|
|
| [38] |
IPCC. 2014. Climate Change 2014:The Physical Science Basis. Working Group I Contribution to the Fifth Assessment Report of the Intergovernmental Panel on Climate Change. Cambridge: Cambridge University Press.
|
|
|
| [39] |
IPCC. 2021. Climate Change 2021:The Physical Science Basis. Contribution of Working Group I to the Sixth Assessment Report of the Intergovernmental Panel on Climate Change. In: Masson-Delmotte V, Zhai P, Pirani A, et al. Cambridge and New York: Cambridge University Press.
|
|
|
| [40] |
Iqbal M A, Penas A, Cano-Ortiz A, et al. 2016. Analysis of recent changes in maximum and minimum temperatures in Pakistan. Atmospheric Research, 168: 234-249.
doi: 10.1016/j.atmosres.2015.09.016
|
|
|
| [41] |
Jena P, Azad S, Rajeevan M N. 2016. CMIP 5 projected changes in the annual cycle of Indian monsoon rainfall. Climate, 4(1): 14, doi: 10.3390/cli4010014.
doi: 10.3390/cli4010014
|
|
|
| [42] |
Jiang R G, Wang Y P, Xie J C, et al. 2019. Assessment of extreme precipitation events and their teleconnections to El Niño Southern Oscillation, a case study in the Wei River Basin of China. Atmospheric Research, 218: 372-384.
doi: 10.1016/j.atmosres.2018.12.015
|
|
|
| [43] |
Joshi S, Kar S C. 2018. Mechanism of ENSO influence on the South Asian monsoon rainfall in global model simulations. Theoretical and applied climatology, 131(3-4): 1449-1464.
doi: 10.1007/s00704-017-2045-5
|
|
|
| [44] |
Khan I, Waqas T, Samiullah, et al. 2020. Precipitation variability and its trend detection for monitoring of drought hazard in northern mountainous region of Pakistan. Arabian Journal of Geosciences, 13(15): 698, doi: 10.1007/s12517-020-05700-4.
doi: 10.1007/s12517-020-05700-4
|
|
|
| [45] |
Khan I, Ali A, Waqas A, et al. 2022. Investing in disaster relief and recovery: A reactive approach of disaster management in Pakistan. International Journal of Disaster Risk Reduction, 75: 1-10.
|
|
|
| [46] |
Kitoh A. 2017. The Asian monsoon and its future change in climate models: A review. Journal of the Meteorological Society of Japan, 95(1): 7-33.
|
|
|
| [47] |
Kripalani R H, Oh J H, Kulkarni A, et al. 2007. South Asian summer monsoon precipitation variability: Coupled climate model simulations and projections under IPCC AR4. Theoretical and Applied Climatology, 90: 133-159.
doi: 10.1007/s00704-006-0282-0
|
|
|
| [48] |
Latif M, Syed F S, Hannachi A. 2017. Rainfall trends in the South Asian summer monsoon and its related large-scale dynamics with focus over Pakistan. Climate Dynamics, 48(11): 3565-3581.
doi: 10.1007/s00382-016-3284-3
|
|
|
| [49] |
Lehtonen H S, Aakkula J, Fronzek S, et al. 2021. Shared socioeconomic pathways for climate change research in Finland: co-developing extended SSP narratives for agriculture. Regional Environmental Change, 21(1): 7, doi: 10.1007/s10113-020-01734-2.
doi: 10.1007/s10113-020-01734-2
|
|
|
| [50] |
Li R Q, Lv S H, Han B, et al. 2017. Projections of South Asian summer monsoon precipitation based on 12 CMIP5 models. International Journal of Climatology, 37(1): 94-108.
doi: 10.1002/joc.2017.37.issue-1
|
|
|
| [51] |
Li W, Jiang Z, Xu J, et al. 2016. Extreme precipitation indices over China in CMIP 5 models. Part II: probabilistic projection. Journal of Climate, 29(24): 8989-9004.
doi: 10.1175/JCLI-D-16-0377.1
|
|
|
| [52] |
Lun Y R, Liu L, Cheng L, et al. 2021. Assessment of GCMs simulation performance for precipitation and temperature from CMIP 5 to CMIP6 over the Tibetan Plateau. International Journal of Climatology, 41(7): 3994-4018.
doi: 10.1002/joc.v41.7
|
|
|
| [53] |
Marotzke J, Jakob C, Bony S, et al. 2017. Climate research must sharpen its view. Nature Climate Chang, 7(2): 89-91.
doi: 10.1038/nclimate3206
|
|
|
| [54] |
Medina S, Houze R A, Kumar A, et al. 2010. Summer monsoon convection in the Himalayan region: terrain and land cover effects. Quarterly Journal of the Royal Meteorological Society, 136(648): 593-616.
|
|
|
| [55] |
Mishra V, Bhatia U, Tiwari A D. 2020. Bias-corrected climate projections for South Asia from Coupled Model Intercomparison Project-6. Scientific Data, 7(1): 338, doi: 10.1038/s41597-020-00681-1.
doi: 10.1038/s41597-020-00681-1
pmid: 33046709
|
|
|
| [56] |
Nikulin G, Lennard C, Dosio A, et al. 2018. The effects of 1.5 and 2 degrees of global warming on Africa in the CORDEX ensemble. Environmental Research Letters, 13(6): 065003, doi: 10.1088/1748-9326/aab1b1.
doi: 10.1088/1748-9326/aab1b1
|
|
|
| [57] |
Nooni I K, Hagan D F T, Wang G J, et al. 2021. Spatiotemporal characteristics and trend analysis of two evapotranspiration- based drought products and their mechanisms in sub-Saharan Africa. Remote Sensing, 13(3): 533, doi: 10.3390/rs13030533.
doi: 10.3390/rs13030533
|
|
|
| [58] |
Ogata T, Ueda H, Inoue T, et al. 2014. Projected future changes in the Asian monsoon: A comparison of CMIP3 and CMIP 5 model results. Journal of the Meteorological Society of Japan, 92(3): 207-225.
|
|
|
| [59] |
Ongoma V, Chen H S, Gao C J, et al. 2018. Future changes in climate extremes over Equatorial East Africa based on CMIP 5 multimodel ensemble. Natural Hazards, 90(2): 901-920.
doi: 10.1007/s11069-017-3079-9
|
|
|
| [60] |
Papalexiou S M, Montanari A, 2019. Global and regional increase of precipitation extremes under global warming. Water Resources Research, 55(6): 4901-4914.
doi: 10.1029/2018WR024067
|
|
|
| [61] |
Phillips N. 2020. Climate change made Australia's devastating fire season 30% more likely. Nature, doi: 10.1038/D41586-020-00627-Y.
doi: 10.1038/D41586-020-00627-Y
|
|
|
| [62] |
Rahman G, Atta-ur-Rahman, Samiullah, et al. 2018. Spatial and temporal variation of rainfall and drought in Khyber Pakhtunkhwa Province of Pakistan during 1971-2015. Arabian Journal of Geosciences, 11(3): 46, doi: 10.1007/s12517-018-3396-7.
doi: 10.1007/s12517-018-3396-7
|
|
|
| [63] |
Ramachandran S, Kedia S. 2013. Aerosol optical properties over South Asia from ground-based observations and remote sensing: a review. Climate, 1(3): 84-119.
doi: 10.3390/cli1030084
|
|
|
| [64] |
Rasmussen K L, Hill A J, Toma V E, et al. 2015. Multiscale analysis of three consecutive years of anomalous flooding in Pakistan. Quarterly Journal of the Royal Meteorological Society, 141(689): 1259-1276.
doi: 10.1002/qj.2015.141.issue-689
|
|
|
| [65] |
Ren Y Y, Ren G Y, Sun X B, et al. 2017. Observed changes in surface air temperature and precipitation in the Hindu Kush Himalayan region over the last 100-plus years. Advances in Climate Change Research, 8(3): 148-156.
doi: 10.1016/j.accre.2017.08.001
|
|
|
| [66] |
Riahi K, van Vuuren D P, Kriegler E, et al. 2016. The Shared Socioeconomic Pathways and their energy, land use, and greenhouse gas emissions implications: An Overview. Global Environmental Change, 42: 153-168.
doi: 10.1016/j.gloenvcha.2016.05.009
|
|
|
| [67] |
Scoccimarro E, Gualdi S. 2020. Heavy daily precipitation events in the CMIP 6 worst-case scenario: Projected twenty-first-century changes. Journal of Climate, 33(17): 7631-7642.
doi: 10.1175/JCLI-D-19-0940.1
|
|
|
| [68] |
Sen P K. 1968. Estimates of the regression coefficient based on Kendall's Tau. Journal of the American Statistical Association, 63: 1379-1389, doi: 10.1080/01621459.1968.10480934.
doi: 10.1080/01621459.1968.10480934
|
|
|
| [69] |
Sharmila S, Joseph S, Sahai A K, et al. 2015. Future projection of Indian summer monsoon variability under climate change scenario: An assessment from CMIP5 climate models. Global and Planetary Change, 124: 62-78.
doi: 10.1016/j.gloplacha.2014.11.004
|
|
|
| [70] |
Shen L, Wen J, Zhang Y, et al. 2022 Changes in population exposure to extreme precipitation in the Yangtze River Delta, China. Climate Services, 27: 100317, do: 10.1016/j.cliser.2022.100317.
doi: 10.1016/j.cliser.2022.100317
|
|
|
| [71] |
Shiu C J, Liu S C, Fu C B, et al. 2012. How much do precipitation extremes change in a warming climate? Geophysical Research Letters, 39(17): L17707, doi: 10.1029/2012GL052762.
doi: 10.1029/2012GL052762
|
|
|
| [72] |
Shrestha S, Bae D H, Hok P, et al. 2021. Future hydrology and hydrological extremes under climate change in Asian river basins. Scientific Reports, 11(1): 17089, doi: 10.1038/s41598-021-96656-2.
doi: 10.1038/s41598-021-96656-2
pmid: 34429491
|
|
|
| [73] |
Sillmann J, Stjern C W, Myhre G, et al. 2017. Slow and fast responses of mean and extreme precipitation to different forcing in CMIP5 simulations. Geophysical Research Letters, 44(12): 6383-6390.
doi: 10.1002/grl.v44.12
|
|
|
| [74] |
Sun X B, Ren G Y, Shrestha A B, et al. 2017. Changes in extreme temperature events over the Hindu Kush Himalaya during 1961-2015. Advances in Climate Change Research, 8(3): 157-165.
doi: 10.1016/j.accre.2017.07.001
|
|
|
| [75] |
Supharatid S, Nafung J, 2021. Projected drought conditions by CMIP 6 multimodel ensemble over Southeast Asia. Journal of Water and Climate Change, 12(7): 3330-3354.
doi: 10.2166/wcc.2021.308
|
|
|
| [76] |
Syed A, Zhang J, Rousta I, et al. 2022. Statistical analysis of precipitation variations and its forecasting in Southeast Asia using remote sensing images. Frontiers in Environmental Science, 10, doi: 10.3389/fenvs.2022.832427.
doi: 10.3389/fenvs.2022.832427
|
|
|
| [77] |
Sylla M B, Faye A, Giorgi F, et al. 2018. Projected heat stress under 1.5°C and 2°C global warming scenarios creates unprecedented discomfort for humans in West Africa. Earth's Future, 6(7): 1029-1044.
doi: 10.1029/2018EF000873
|
|
|
| [78] |
Tabari H. 2020. Climate change impact on flood and extreme precipitation increases with water availability. Scientific Reports, 10(1): 13768, doi: 10.1038/s41598-020-70816-2.
doi: 10.1038/s41598-020-70816-2
pmid: 32792563
|
|
|
| [79] |
Thibeault J M, Seth A. 2014. Changing climate extremes in the Northeast United States: observations and projections from CMIP5. Climate Change, 127: 273-287.
doi: 10.1007/s10584-014-1257-2
|
|
|
| [80] |
Turner A G, Annamalai H. 2012. Climate change and the South Asian summer monsoon. Nature Climate Change, 2(8): 587-595.
doi: 10.1038/nclimate1495
|
|
|
| [81] |
Ullah S, You Q L, Ullah W, et al. 2018. Observed changes in precipitation in China-Pakistan economic corridor during 1980-2016. Atmospheric Research, 210: 1-14.
doi: 10.1016/j.atmosres.2018.04.007
|
|
|
| [82] |
Ullah S, You Q L, Ullah W, et al. 2019a. Observed changes in temperature extremes over China-Pakistan Economic Corridor during 1980-2016. International Journal of Climatology, 39(3): 1457-1475.
doi: 10.1002/joc.2019.39.issue-3
|
|
|
| [83] |
Ullah S, You Q L, Ullah W, et al. 2019b. Daytime and nighttime heat wave characteristics based on multiple indices over the China-Pakistan economic corridor. Climate Dynamics, 53(9-10): 6329-6349.
doi: 10.1007/s00382-019-04934-7
|
|
|
| [84] |
Ullah S, You Q L, Zhang Y Q, et al. 2020. Evaluation of CMIP 5 models and projected changes in temperatures over South Asia under global warming of 1.5°C, 2°C, and 3°C. Atmospheric Research, 246: 105122, doi: 10.1016/J.ATMOSRES.2020.105122.
doi: 10.1016/J.ATMOSRES.2020.105122
|
|
|
| [85] |
Ullah S, You Q L, Chen D L, et al. 2022a. Future population exposure to daytime and nighttime heat waves in South Asia. Earth's Future, 10(5): e2021EF002511, doi: 10.1029/2021EF002511.
doi: 10.1029/2021EF002511
|
|
|
| [86] |
Ullah S, You Q L, Wang G, et al. 2022b. Characteristics of human thermal stress in South Asia during 1981-2019. Environmental Research Letters, 17: 104018, doi:10.1088/1748-9326/ac8fa6.
doi: 10.1088/1748-9326/ac8fa6
|
|
|
| [87] |
Ullah W, Wang G J, Gao Z Q, et al. 2021a. Observed linkage between Tibetan Plateau soil moisture and South Asian summer precipitation and the possible mechanism. Journal of Climate, 34(1): 361-377.
doi: 10.1175/JCLI-D-20-0347.1
|
|
|
| [88] |
Ullah W, Wang G J, Lou D, et al. 2021b. Large-scale atmospheric circulation patterns associated with extreme monsoon precipitation in Pakistan during 1981-2018. Atmospheric Research, 253: 105489, doi: 10.1016/J.ATMOSRES.2021.105489.
doi: 10.1016/J.ATMOSRES.2021.105489
|
|
|
| [89] |
Vecchi G A, Soden B J, Wittenberg A T, et al. 2006. Weakening of tropical Pacific atmospheric circulation due to anthropogenic forcing. Nature, 441(7089): 73-76.
doi: 10.1038/nature04744
|
|
|
| [90] |
Watterson I, Rafter T. 2017. The distribution of daily rainfall in Australia and simulated future changes. Journal of Southern Hemisphere Earth System Science, 67(3): 160-180.
doi: 10.1071/ES17010
|
|
|
| [91] |
Wen X H, Wu X Q, Gao M. 2017. Spatiotemporal variability of temperature and precipitation in Gansu Province (Northwest China) during 1951-2015. Atmospheric Research, 197: 132-149.
doi: 10.1016/j.atmosres.2017.07.001
|
|
|
| [92] |
WMO (World Meteorological Organization). 2021. WMO atlas of mortality and economic losses from weather, climate and water extremes (1970-2019) (WMO-No. 1267). Geneva, Switzerland. [2022-10-14]. https://library.wmo.int/index.php?lvl=notice_display&id=21930#.Y0uvcnbP2Uk.
|
|
|
| [93] |
Woo S, Singh G P, Oh J H, et al. 2018. Projected changes in summer precipitation over East Asia with a high-resolution atmospheric general circulation model during 21st century. International Journal of Climatology, 38(12): 4610-4631.
doi: 10.1002/joc.2018.38.issue-12
|
|
|
| [94] |
Wu S H, Liu L L, Liu Y H, et al. 2019. The Belt and Road: Geographical pattern and regional risks. Journal of Geographical Sciences, 29(4): 483-495.
doi: 10.1007/s11442-019-1611-4
|
|
|
| [95] |
Xu L, Zheng C L, Ma Y. 2021. Variations in precipitation extremes in the arid and semi-arid regions of China. International Journal of Climatology, 41(3): 1542-1554.
doi: 10.1002/joc.v41.3
|
|
|
| [96] |
Yadav S S, Lal R. 2018. Vulnerability of women to climate change in arid and semi-arid regions: The case of India and South Asia. Journal of Arid Environments, 149: 4-17.
doi: 10.1016/j.jaridenv.2017.08.001
|
|
|
| [97] |
Yu Y, You Q L, Zuo Z, et al. 2023. Compound climate extremes in China: Trends, causes, and projections, 286: 106675, doi: 10.1016/j.atmosres.2023.106675.
doi: 10.1016/j.atmosres.2023.106675
|
|
|
| [98] |
Zhai J Q, Mondal S K, Fischer T, et al. 2020. Future drought characteristics through a multi-model ensemble from CMIP 6 over South Asia. Atmospheric Research, 246: 105111, doi: 10.1016/j.atmosres.2020.105111.
doi: 10.1016/j.atmosres.2020.105111
|
|
|
| [99] |
Zhang X B, Alexander L, Hegerl G C, et al. 2011. Indices for monitoring changes in extremes based on daily temperature and precipitation data. Wiley Interdisciplinary Reviews: Climate Change, 2(6): 851-870.
doi: 10.1002/wcc.v2.6
|
|
|
| [100] |
Zhang Y Q, You Q L, Chen C C, et al. 2018. Evaluation of downscaled CMIP 5 coupled with VIC Model for flash drought simulation in a humid subtropical basin, China. Journal of Climate, 31(3): 1075-1090.
doi: 10.1175/JCLI-D-17-0378.1
|
|
|
| [101] |
Zhou S J, Huang G, Huang P. 2018. Changes in the East Asian summer monsoon rainfall under global warming: moisture budget decompositions and the sources of uncertainty. Climate Dynamics, 51(4): 1363-1373.
doi: 10.1007/s00382-017-3959-4
|
|
|
| [102] |
Zhu H H, Jiang Z H, Li J, et al. 2020. Does CMIP6 inspire more confidence in simulating climate extremes over China? Advances in Atmospheric Sciences, 37(10): 1119-1132.
doi: 10.1007/s00376-020-9289-1
|
|
|
|
Viewed |
|
|
|
Full text
|
|
|
|
|
Abstract
|
|
|
|
|
Cited |
|
|
|
|
| |
Shared |
|
|
|
|
| |
Discussed |
|
|
|
|