| Research article |
|


|
|
|
| Spatiotemporal evolution and prediction of habitat quality in Hohhot City of China based on the InVEST and CA-Markov models |
LUAN Yongfei1, HUANG Guohe2,*( ), ZHENG Guanghui3 ), ZHENG Guanghui3 |
1College of Environmental Science and Engineering, North China Electric Power University, Beijing 102206, China
2School of Environment, Beijing Normal University, Beijing 100875, China
3School of Architecture and Art, Central South University, Changsha 410083, China |
|
|
|
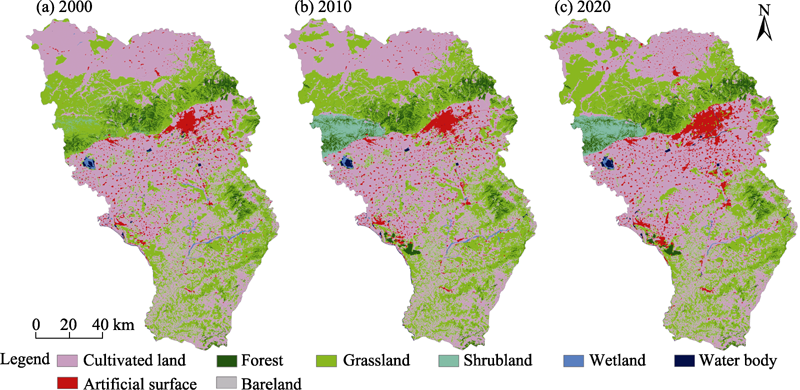
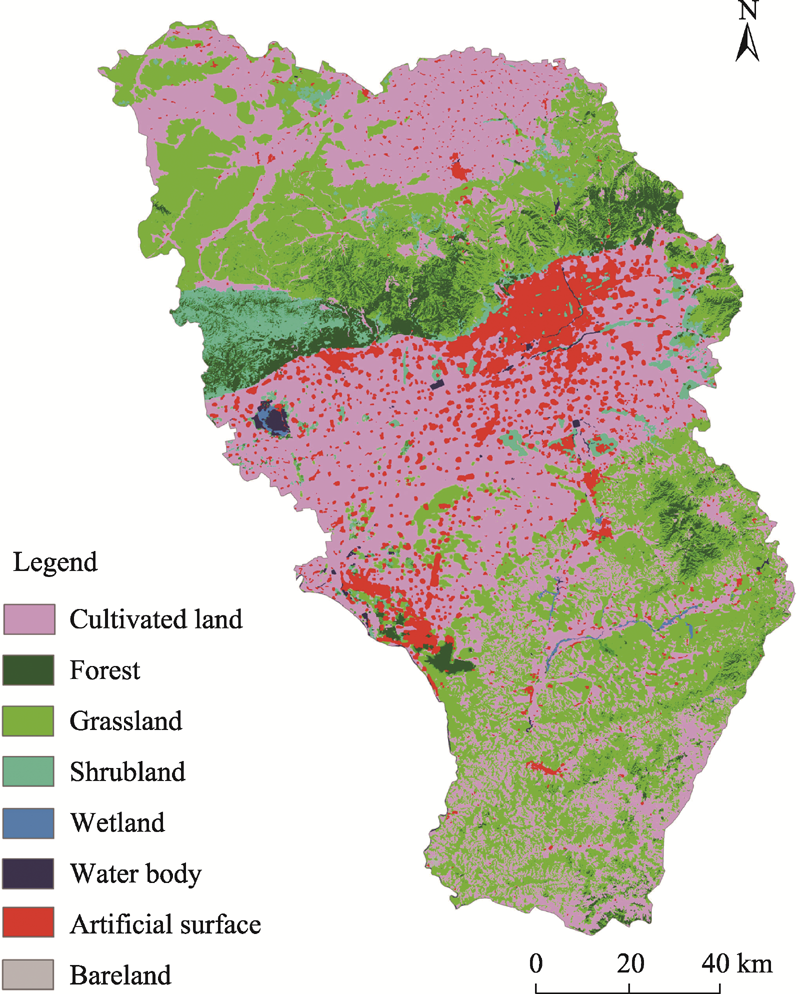
Abstract With the acceleration of urbanization, changes in the urban ecological environment and landscape pattern have led to a series of prominent ecological environmental problems. In order to better coordinate the balanced relationship between city and ecological environment, we selected land use change data to evaluate the habitat quality in Hohhot City of China, which is of great practical significance for regional urban and economic development. Thus, the integrated valuation of ecosystem services and tradeoffs (InVEST) and Cellular Automata-Markov (CA-Markov) models were used to analyze, predict, and explore the Spatiotemporal evolution path and characteristics of urban land use, and forecast the typical evolution pattern of land use in 2030. The results showed that the land use types in Hohhot City changed significantly from 2000 to 2020, and the biggest change took place in cultivated land, grassland, shrub, and artificial surface. The decrease of cultivated land area and the increase of artificial surface area were the main impact trend of land use change. The average value of habitat quality had been decreasing continuously from 2000 to 2020, and the values of habitat degradation were 0.2605, 0.2494, and 0.2934 in 2000, 2010, and 2020, respectively, showing a decreasing trend. The decrease of habitat quality was caused by the needs of economic development and urban construction, as well as the impact of land occupation. During this evolution, many cultivated land and urban grassland had been converted into construction land. The simulated land use changes in 2030 are basically the same as those during 2000-2020, and the habitat quality will still be declining. The regional changes are influenced by the urban rapid development and industrial layout. These results can provide decision-making reference for regional urban planning and management as well as habitat quality evaluation.
|
|
Received: 01 August 2022
Published: 31 January 2023
|
|
Corresponding Authors:
*HUANG Guohe (E-mail: huang@iseis.org)
|
|
|
| [1] |
Bai L M, Feng X H, Sun R F, et al. 2020. Spatial and temporal responses of habitat quality to urbanization: A case study of Changchun City, Jilin Province, China. Chinese Journal of Applied Ecology, 31(4): 1267-1277. (in Chinese)
|
|
|
| [2] |
Cai E X, Bi Q S, Lu J, et al. 2022. The spatiotemporal characteristics and rationality of emerging megacity urban expansion: A case study of Zhengzhou in central China. Frontiers in Environmental Science, 10: 860814, doi: 10.3389/fenvs.2022.860814.
doi: 10.3389/fenvs.2022.860814
|
|
|
| [3] |
Chen Y, Qiao F, Jiang L. 2016. Effects of land use pattern change on regional scale habitat quality based on InVEST model-A case study in Beijing. Acta Scientiarum Naturalium Universitatis Pekinensis, 52(3): 553-562. (in Chinese)
|
|
|
| [4] |
Cheng C N, Hu Y, Zhao M. 2020. Progress and prospect of the spatiotemporal change and ecosystem services evaluation of urban green space pattern. Progress in Geography, 39(10): 1770-1782. (in Chinese)
doi: 10.18306/dlkxjz.2020.10.015
|
|
|
| [5] |
Fan H J. 2014. Study on dynamic change law of land use and ecological benefit in Hohhot. MSc Thesis. Hohhot: Inner Mongolia Normal University. (in Chinese)
|
|
|
| [6] |
Gao J L, Bao J W, Liu Y S, et al. 2018. Regional disparity and the influencing factors of land urbanization in China at the county level, 2000-2015. Acta Geographica Sinica, 73(12): 2329-2344. (in Chinese)
doi: 10.11821/dlxb201812005
|
|
|
| [7] |
Gao X, Yang L W Q, Li C X, et al. 2021. Land use change and ecosystem service value measurement in Baiyangdian Basin under the simulated multiple scenarios. Acta Ecologica Sinica, 41(20): 7974-7988. (in Chinese)
|
|
|
| [8] |
Haddad N M, Brudvig L A, Clobert J, et al. 2015. Habitat fragmentation and its lasting impact on Earth's ecosystems. Science Advances, 1(2): e1500052, doi: 10.1126/sciadv.1500052.
doi: 10.1126/sciadv.1500052
|
|
|
| [9] |
Hu S. 2020. Research on ecosystem service value and ecological compensation standard based on land use Change. PhD Dissertation. Beijing: China University of Mining and Technology. (in Chinese)
|
|
|
| [10] |
Laurance W F, Clements G R, Sloan S, et al. 2014. A global strategy for road building. Nature, 513(7521): 229-232.
doi: 10.1038/nature13717
|
|
|
| [11] |
Li S, Dong B, Gao X, et al. 2022. Study on spatio-temporal evolution of habitat quality based on land-use change in Chongming Dongtan, China. Environmental Earth Sciences, 81(7): 1-12.
doi: 10.1007/s12665-021-10123-9
|
|
|
| [12] |
Li S J, Fu M C, Tian Y, et al. 2022. Relationship between urban land use efficiency and economic development level in the Beijing-Tianjin-Hebei Region. Land, 11(7): 976, doi: 10.3390/land11070976.
doi: 10.3390/land11070976
|
|
|
| [13] |
Li X, Liu X P, Lao C H, et al. 2010. The implementation and application of geographical simulation and optimization systems (GeoSOS). Acta Scientiarum Naturalium Universitatis Sunyatseni, 49(4): 1-5. (in Chinese)
|
|
|
| [14] |
Li X Y, Kuang W H. 2019. Spatio-temporal trajectories of urban land use change during 1980-2015 and future scenario simulation in Beijing-Tianjin-Hebei urban agglomeration. Economic Geography, 39(3): 187-194, 200. (in Chinese)
|
|
|
| [15] |
Li Y N, Duo L H, Zhang M, et al. 2022. Habitat quality assessment of mining cities based on InVEST model-a case study of Yanshan County, Jiangxi Province. Intetnational Journal of Coal Science & Technology, 9: 28, doi: 10.1007/s40789-022-00498-w.
doi: 10.1007/s40789-022-00498-w
|
|
|
| [16] |
Li Z T, Li M, Xia B C. 2020. Spatio-temporal dynamics of ecological security pattern of the Pearl River Delta urban agglomeration based on LUCC simulation. Ecological Indicators, 114: 106319, doi: 10.1016/j.ecolind.2020.106319.
doi: 10.1016/j.ecolind.2020.106319
|
|
|
| [17] |
Liang X, Guan Q F, Clarke K C, et al. 2021. Understanding the drivers of sustainable land expansion using a patch-generating land use simulation (PLUS) model: A case study in Wuhan, China. Computers Environment and Urban Systems, 85: 101569, doi: 10.1016/j.compenvurbsys.2020.101569.
doi: 10.1016/j.compenvurbsys.2020.101569
|
|
|
| [18] |
Liu G L, Li J Y, Nie P. 2022. Tracking the history of urban expansion in Guangzhou (China) during 1665-2017: Evidence from historical maps and remote sensing images. Land Use Policy, 112: 105773, doi: 10.1016/j.landusepol.2021.105773.
doi: 10.1016/j.landusepol.2021.105773
|
|
|
| [19] |
Liu J H, Lu L R. 2022. Study on the prediction of urban landscape pattern evolution based on Markov process. Fresenius Environmental Bulletin, 31(7): 6945-6952.
|
|
|
| [20] |
Liu X Y, Xin L J. 2022. Assessment of the efficiency of cultivated land occupied by urban and rural construction land in China from 1990 to 2020. Land, 11(6): 941, doi: 10.3390/land11060941.
doi: 10.3390/land11060941
|
|
|
| [21] |
Liu Z F, Tang L, Qiu Q Y, et al. 2017. Temporal and spatial changes in habitat quality based on land-use change in Fujian Province. Acta Ecologica Sinica, 37(13): 4538-4548. (in Chinese)
|
|
|
| [22] |
Lou Y Y, Yang D, Zhang P Y, et al. 2022. Multi-scenario simulation of land use changes with ecosystem service value in the Yellow River Basin. Land, 11(7): 992, doi: 10.3390/land11070992.
doi: 10.3390/land11070992
|
|
|
| [23] |
Ma C Y, Zhen J H, Feng Y W, et al. 2020. Comprehensive assessment of ecological risks based on urban expansion: The case of Hohhot. Chinese Journal of Ecology, 38(11): 3472-3479.
|
|
|
| [24] |
Matlhodi B, Kenabatho P K, Parida B P, et al. 2021. Analysis of the future land use land cover changes in the Gaborone dam catchment using CA-Markov model: implications on water resources. Remote Sensing, 13(13): 2427, doi: 10.3390/rs13132427.
doi: 10.3390/rs13132427
|
|
|
| [25] |
Mokarram M, Pourghasemi H R, Hu M, et al. 2021. Determining and forecasting drought susceptibility in southwestern Iran using multiple-criteria decision-making (MCDM) coupled with CA-Markov model. Science of the Total Environment, 781(3): 146703, doi: 10.1016/j.scitotenv.2021.146703.
doi: 10.1016/j.scitotenv.2021.146703
|
|
|
| [26] |
Niu W T, Nie T, Chen X, et al. 2022. Understanding the corrective effect of the urban growth boundary policy on land finance dependence of local governments in China. International Journal of Environmental Research and Public Health, 19(8): 4785, doi: 10.3390/ijerph19084785.
doi: 10.3390/ijerph19084785
|
|
|
| [27] |
Pan Y, Yu D S, Wang X H, et al. 2018. Prediction of land use landscape pattern based on CA-Markov model. Soils, 50(2): 391-397. (in Chinese)
|
|
|
| [28] |
Qi L, Xu D, Zhu Q, et al. 2021. Ecological pattern optimization of forest barrier belt in Northeast China based on GeoSOS-FLUS. Chinese Journal of Ecology, 40(11): 3448-3462. (in Chinese)
|
|
|
| [29] |
Rahnama M R. 2020. Forecasting land-use changes in Mashhad Metropolitan area using Cellular Automata and Markov chain model for 2016-2030. Sustainable Cities and Society, 64, doi: 10.1016/j.scs.2020.102548.
doi: 10.1016/j.scs.2020.102548
|
|
|
| [30] |
Statistics Bureau of Hohhot. 2020. Hohhot Statistical Yearbook. [2022-01-01]. http://tjj.huhhot.gov.cn/tjyw/tjsj/tjnj/. (in Chinese)
|
|
|
| [31] |
Tang Y, Zhu W P, Zhang H, et al. 2015. A review on principle and application of the InVEST model. Ecological Science, 34(3): 204-208. (in Chinese)
|
|
|
| [32] |
Tong G H. 2014. Study on land use change and its driving forces in Hohhot. MSc Thesis. Hohhot: Inner Mongolia Agricultural University, (in Chinese)
|
|
|
| [33] |
Verburg P H, Soepboer W, Veldkamp A. 2002. Modeling the spatial dynamics of regional land use: the CLUE-S model. Environmental Management, 30(3): 391-405.
pmid: 12148073
|
|
|
| [34] |
Wang C C, Liu Y F, Kong X S, et al. 2017. Spatiotemporal decoupling between population and construction land in urban and rural Hubei Province. Sustainability, 9(7): 1258, doi: 10.3390/su9071258.
doi: 10.3390/su9071258
|
|
|
| [35] |
Wang J, Yan Y L, Wang J M, et al. 2021. Temporal-spatial variation characteristics and prediction of habitat quality in Min River Basin. Acta Ecologica Sinica, 41(14): 5837-5848. (in Chinese)
|
|
|
| [36] |
Wang J, Zhang J P, Xiong N N, et al. 2022. Spatial and temporal variation, simulation and prediction of land use in ecological conservation area of western Beijing. Remote Sensing, 14(6): 1452, doi: 10.3390/rs14061452.
doi: 10.3390/rs14061452
|
|
|
| [37] |
Wang L Y, Herzberger A, Zhang L Y, et al. 2019. Spatial and temporal changes of arable land driven by urbanization and ecological restoration in China. Chinese Geographical Science, 29(5): 809-819.
doi: 10.1007/s11769-018-0983-1
|
|
|
| [38] |
Wang Q R, Liu R M, Zhou F, et al. 2021. A declining trend in China's future cropland-N2O emissions due to reduced cropland area. Environmental Science & Technology, 55(21): 14546-14555.
doi: 10.1021/acs.est.1c03612
|
|
|
| [39] |
Wang S W, Munkhnasan L, Lee W K. 2021. Land use and land cover change detection and prediction in Bhutan's high altitude city of Thimphu, using cellular automata and Markov chain. Environmental Challenges, 2: 100017, doi: 10.1016/j.envc. 2020.100017.
doi: 10.1016/j.envc. 2020.100017
|
|
|
| [40] |
Wang Y F. 2022. Effects of urbanization on spatial-temporal changes of cultivated land in Bohai Rim region. Environment, Development and Sustainability, doi: 10.1007/s10668-022-02408-1.
doi: 10.1007/s10668-022-02408-1
|
|
|
| [41] |
Weldesilassie A B, Worku G B. 2022. Managing urban land markets in Africa: Valuation, performance and policy implication. Land Use Policy, 114: 105906, doi: 10.1016/j.landusepol.2021.105906.
doi: 10.1016/j.landusepol.2021.105906
|
|
|
| [42] |
Wu F L. 2002. Calibration of stochastic cellular automata: the application to rural-urban land conversions. International Journal of Geographical Information Science, 16(8): 795-818.
doi: 10.1080/13658810210157769
|
|
|
| [43] |
Wu J S, Cao Q W, Shi S Q, et al. 2015. Spatio-temporal variability of habitat quality in Beijing-Tianjin-Hebei area based on land use change. Chinese Journal of Applied Ecology, 26(11): 3457-3466. (in Chinese)
|
|
|
| [44] |
Yang H R, Wu Q. 2021. Dynamic simulation of carbon emissions from land use in Nanjing city under different policy scenarios. Areal Research and Development, 40(3): 121-126. (in Chinese)
|
|
|
| [45] |
Zhang Y J, Song W, Fu S, et al. 2020. Decoupling of land use intensity and ecological environment in Gansu Province, China. Sustainability, 12(7): 2779, doi: 10.3390/su12072779.
doi: 10.3390/su12072779
|
|
|
| [46] |
Zhao Y. 2021. Study on land use change and benefits of the grain. MSc Thesis. Hohhot: Inner Mongolia University, (in Chinese)
|
|
|
| [47] |
Zheng H L, Li H. 2022. Spatial-temporal evolution characteristics of land use and habitat quality in Shandong Province, China. Scientific Reports, 12: 15422, doi: 10.1038/s41598-022-19493-x.
doi: 10.1038/s41598-022-19493-x
pmid: 36104426
|
|
|
| [48] |
Zhou L, Tang J J, Liu X K, et al. 2021. Effects of urban expansion on habitat quality in densely populated areas on the Loess Plateau: A case study of Lanzhou, Xi'an-Xianyang and Taiyuan, China. Chinese Journal of Applied Ecology, 32(1): 261-270. (in Chinese)
|
|
|
| [49] |
Zhou X P, Shen D S, Gu X K. 2022. Influences of land policy on urban ecological corridors governance: A case study from Shanghai. International Journal of Environmental Research and Public Health, 19(15): 9747, doi: 10.3390/ijerph19159747.
doi: 10.3390/ijerph19159747
|
|
|
| [50] |
Zhou Y, Huang X J, Chen Y, et al. 2017. The effect of land use planning (2006-2020) on construction land growth in China. Cities, 68: 37-47.
doi: 10.1016/j.cities.2017.04.014
|
|
|
| [51] |
Zhu H, Ou X, Yang Z, et al. 2022. Spatiotemporal dynamics and driving forces of land urbanization in the Yangtze River Delta urban agglomeration. Land, 11(8): 1365, doi: 10.3390/land11081365.
doi: 10.3390/land11081365
|
|
|
|
Viewed |
|
|
|
Full text
|
|
|
|
|
Abstract
|
|
|
|
|
Cited |
|
|
|
|
| |
Shared |
|
|
|
|
| |
Discussed |
|
|
|
|