| Research article |
|


|
|
|
| Natural and anthropogenic contributions to the variability of aerosol optical depth in arid and semi- arid areas |
WEI Xin1, LIU Qiong1,*( ), CHEN Yonghang1, CHEN Siyu2, LI Changyu2, YANG Fan3, SHAO Weiling4, ZHANG Taixi4, XU Yunhong1, GAO Tianyi1 |
1 College of Environmental Science and Engineering, Donghua University, Shanghai 201620, China
2 Key Laboratory for Semi-Arid Climate Change of the Ministry of Education, College of Atmospheric Sciences, Lanzhou University, Lanzhou 730000, China
3 Institute of Desert Meteorology, China Meteorological Administration, Urumqi 830002, China
4 Xinjiang Uygur Autonomous Region Climate Center of China Meteorological Administration, Urumqi 830002, China |
|
|
|
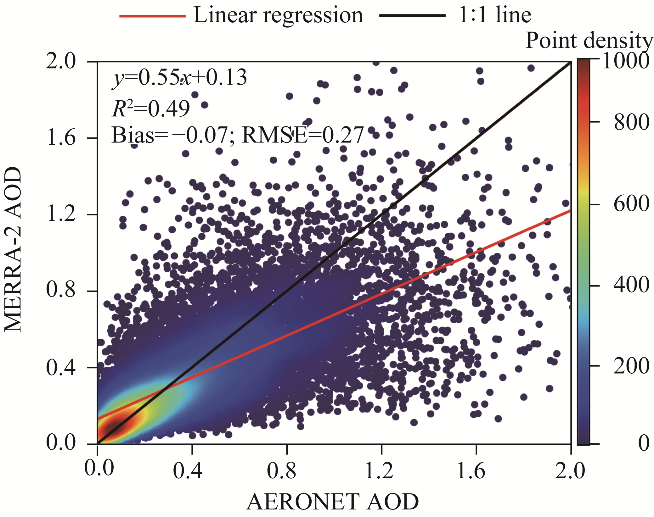
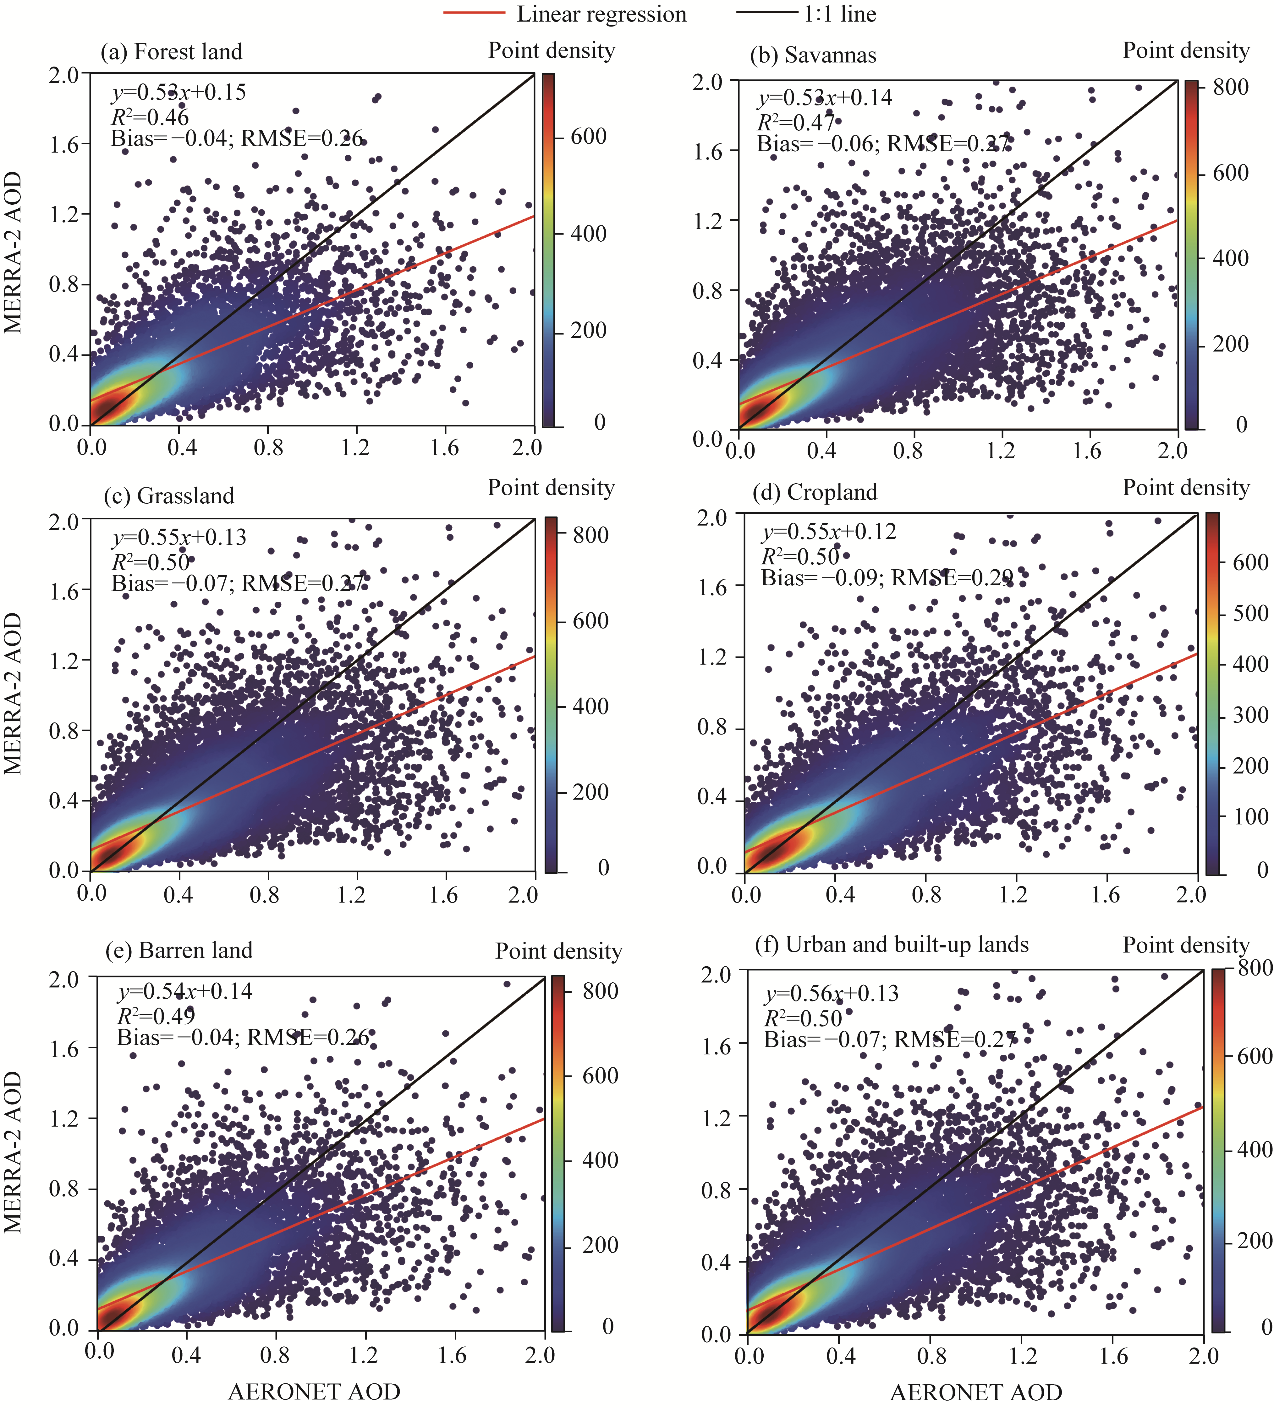
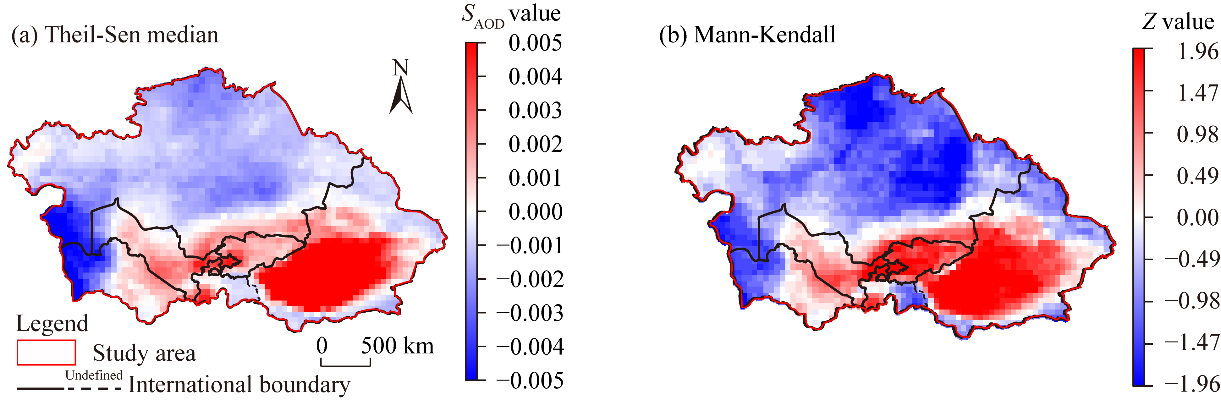
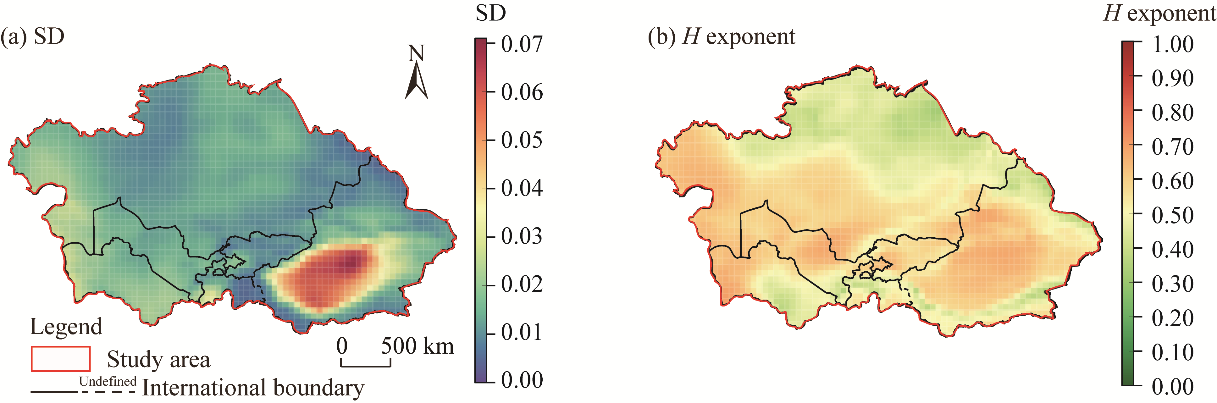
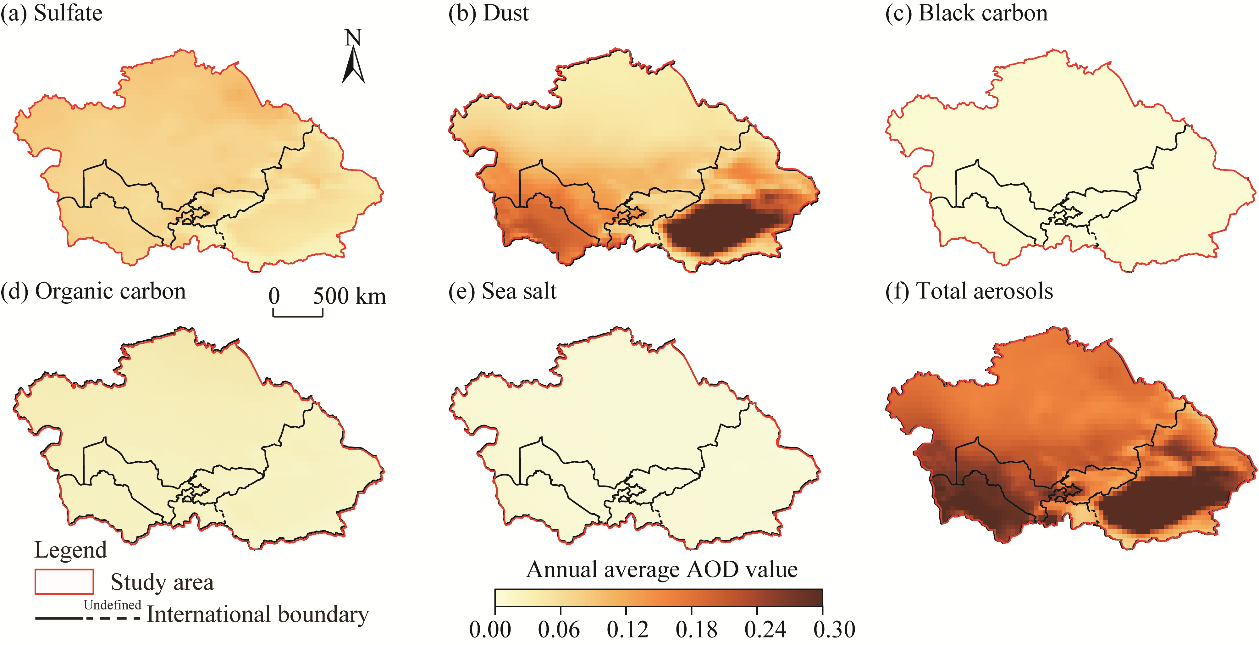
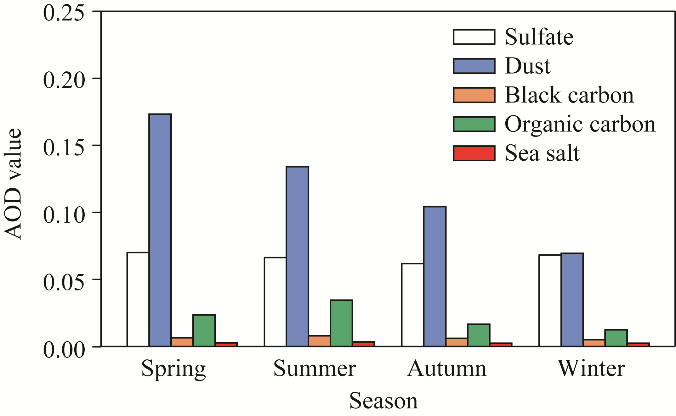
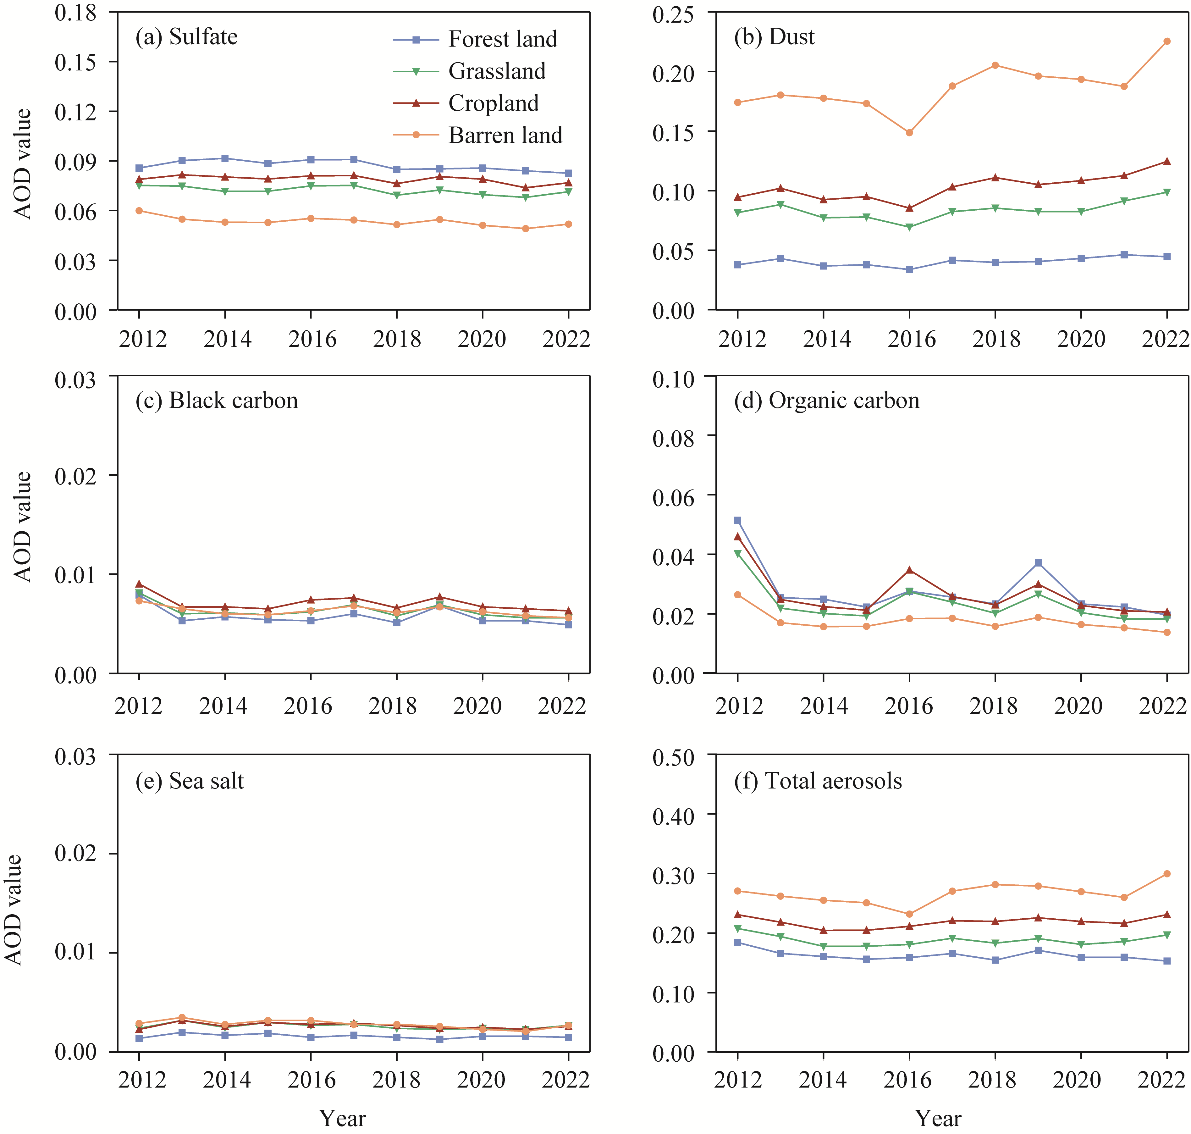
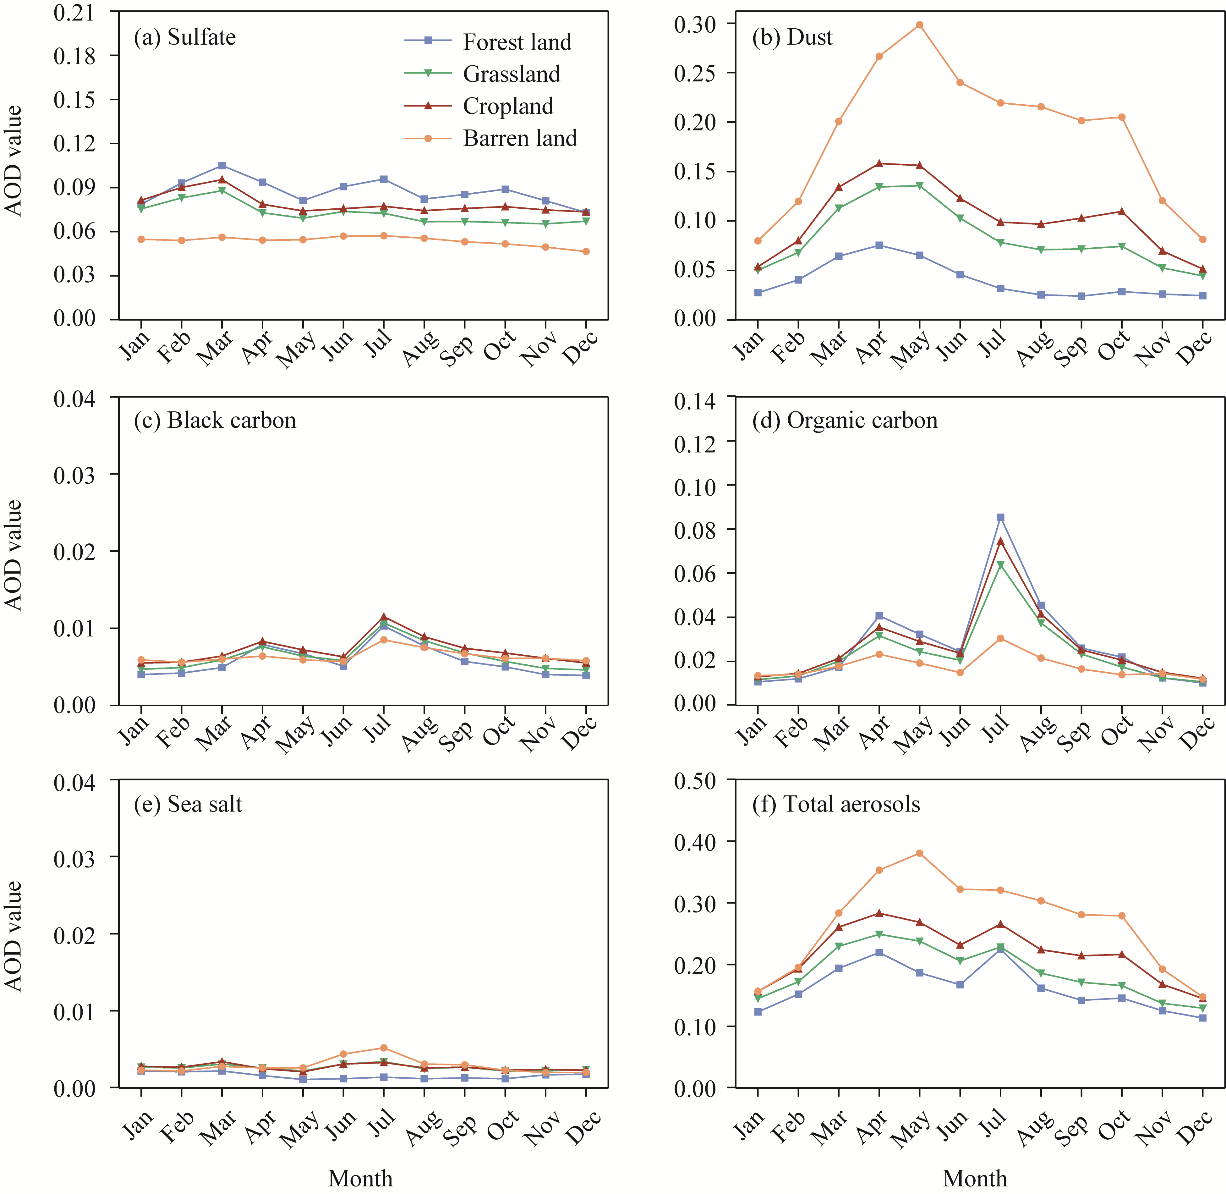
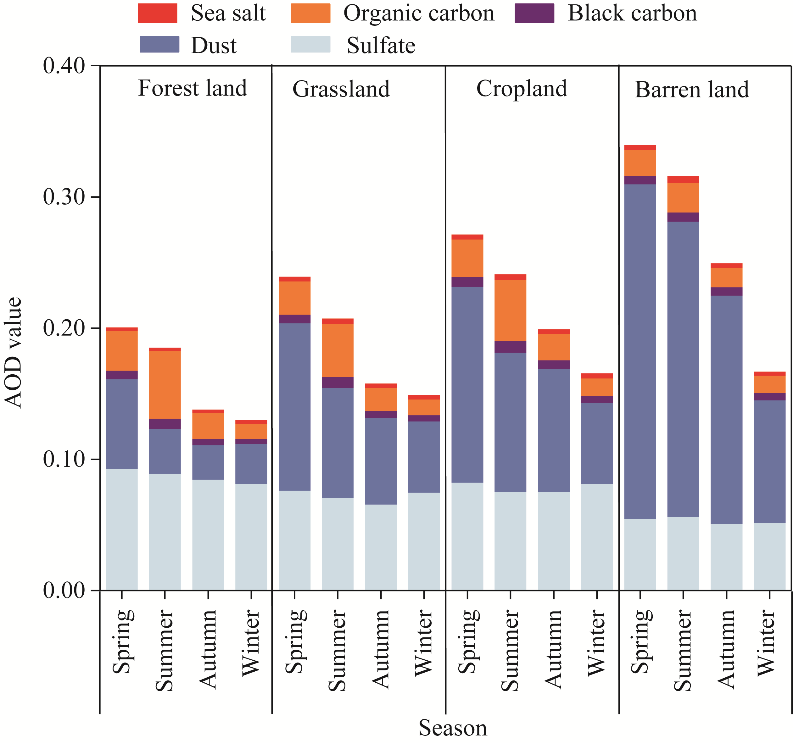
Abstract Aerosol optical depth (AOD) is an important indicator for evaluating atmospheric pollution. Xinjiang Uygur Autonomous Region, China and its surrounding areas including Kazakhstan, Uzbekistan, Turkmenistan, Kyrgyzstan, and Tajikistan are well known as the typical arid and semi-arid areas mainly affected by dust aerosols, but the researches of different aerosol types, particularly the anthropogenic emissions are not enough. Moreover, the applicability of Modern-Era Retrospective Analysis for Research and Applications, Version 2 (MERRA-2) reanalysis AOD data remains unclear and the long-term trends of AOD in the study area have not been thoroughly investigated. Therefore, the accuracy of MERRA-2 reanalysis AOD data was evaluated against Aerosol Robotic Network (AERONET) observations. Subsequently, the contributions of five aerosol types (dust, sulfate, organic carbon, black carbon, and sea salt) derived from MERRA-2 AOD data from 2012 to 2022 were qualitatively and quantitatively explored. Results showed that AOD based on MERRA-2 reanalysis exhibited reasonable agreement with 19 AERONET sites (R2=0.49; bias= -0.07), confirming its regional reliability. The overall trends of MERRA-2 AOD revealed that aerosol concentrations in the Taklimakan Desert showed a significant increase (Theil-Sen slope≥0.005; standardized test statistic (Z)≥1.96) and higher variability (standard deviation (SD)>0.05), mainly owing to strong influence of natural disturbances, such as dust transport events. Conversely, low AOD variability (SD<0.01) appeared in the high-altitude and sparsely populated areas, such as eastern Tajikistan. The contributions of five aerosol types showed that dust AOD was the highest (0.120), followed by sulfate (0.067) and organic carbon (0.022), whereas black carbon and sea salt contributed relatively little, with values of 0.006 and 0.003, respectively. Spatially, dust AOD exhibited significant variation and gradually decreased from south to north, with high values mainly concentrated in the Taklamakan and Karakum deserts, whereas northern Kazakhstan was weakly affected by dust aerosols (AOD<0.060), but showed relatively high sulfate aerosol loading (AOD>0.100), mainly associated with anthropogenic emissions. From the perspective of land use types, spring dust aerosols made the largest contribution under the influence of dust sources of arid areas, with the highest contributions observed in barren land (75.28%; AOD=0.255), followed by cropland (55.21%; AOD=0.128), grassland (53.45%; AOD=0.150), and forest land (34.17%; AOD=0.068). Although greatly affected by dust and organic carbon at four seasons, sulfate remained the dominant aerosol type in forest land, driven by long-distance transport of industrial emissions, with percentages exceeding 46.00% (AOD>0.080). These findings indicate that aerosol variability in Xinjiang Uygur Autonomous Region, China and its surrounding areas is jointly controlled by natural dust emissions, anthropogenic sulfate inputs, and land-use-dependent seasonal processes, highlighting the importance of distinguishing natural and anthropogenic aerosol contributions in regional air quality and climate assessments.
|
|
Received: 05 February 2026
Published: 30 November 2026
|
|
Corresponding Authors:
*LIU Qiong (E-mail: liuqiong@dhu.edu.cn)
|
| About author: Author contributions
Conceptualization: WEI Xin; Methodology: WEI Xin, LIU Qiong; Writing - original draft preparation: WEI Xin; Writing - reviewing and editing: WEI Xin, CHEN Yonghang, CHEN Siyu, LI Changyu; Funding Acquisition: CHEN Yonghang; Data curation: YANG Fan, SHAO Weiling, ZHANG Taixi, XU Yunhong; Software: XU Yunhong, GAO Tianyi. All authors approved the manuscript.
|
| Cite this article:
WEI Xin, LIU Qiong, CHEN Yonghang, CHEN Siyu, LI Changyu, YANG Fan, SHAO Weiling, ZHANG Taixi, XU Yunhong, GAO Tianyi. Natural and anthropogenic contributions to the variability of aerosol optical depth in arid and semi- arid areas. Journal of Arid Land, 2026, 18(11): 1870-1892.
URL:
http://jal.xjegi.com/10.1016/j.jaridl.2026.11.002 OR http://jal.xjegi.com/Y2026/V18/I11/1870
|
|
|
| [1] |
Abbott T H, Cronin T W. 2021. Aerosol invigoration of atmospheric convection through increases in humidity. Science, 371(6524): 83-85.
|
|
|
| [2] |
Amini S, Momeni M, Monadjemi A. 2021. Sensitivity analysis of look-up table for satellite-based aerosol optical depth retrieval. Journal of Aerosol Science, 158: 105842, doi: 10.1016/j.jaerosci.2021.105842.
|
|
|
| [3] |
Ansari K, Ramachandran S. 2024. Optical and physical characteristics of aerosols over Asia: AERONET, MERRA-2 and CAMS. Atmospheric Environment, 326: 120470, doi: 10.1016/j.atmosenv.2024.120470.
|
|
|
| [4] |
Bakatsoula V D, Korras-Carraca M B, Hatzianastassiou N, et al. 2023. A comparison of atmospheric aerosol absorption properties from the MERRA-2 reanalysis with AERONET. Atmospheric Environment, 311: 119997, doi: 10.1016/j.atmosenv.2023.119997.
|
|
|
| [5] |
Barreto A, Román R, Cuevas E, et al. 2019. Evaluation of night-time aerosols measurements and lunar irradiance models in the frame of the first multi-instrument nocturnal intercomparison campaign. Atmospheric Environment, 202: 190-211.
|
|
|
| [6] |
Buchard V, Randles C A, Silva A M D, et al. 2017. The MERRA-2 aerosol reanalysis, 1980 onward. Part II: Evaluation and case studies. Journal of Climate, 30(17): 6851-6872.
|
|
|
| [7] |
Bulatovic I, Ekman A M L, Savre J, et al. 2019. Aerosol indirect effects in marine stratocumulus: the importance of explicitly predicting cloud droplet activation. Geophysical Research Letters, 46(6): 3473-3481.
|
|
|
| [8] |
Cao S S, Zhang S Q, Gao C C, et al. 2021. A long-term analysis of atmospheric black carbon MERRA-2 concentration over China during 1980-2019. Atmospheric Environment, 264: 118662, doi: 10.1016/j.atmosenv.2021.118662.
|
|
|
| [9] |
Chen A N, Zhao C F, Fan T Y. 2022. Spatio-temporal distribution of aerosol direct radiative forcing over mid-latitude regions in north hemisphere estimated from satellite observations. Atmospheric Research, 266: 105938, doi: 10.1016/j.atmosres.2021.105938.
|
|
|
| [10] |
Chen A N, Zhao C F, Zhang H T, et al. 2024. Surface albedo regulates aerosol direct climate effect. Nature Communications, 15: 7816, doi: 10.1038/s41467-024-52255-z.
|
|
|
| [11] |
Chin M, Diehl T, Tan Q, et al. 2014. Multi-decadal aerosol variations from 1980 to 2009: a perspective from observations and a global model. Atmospheric Chemistry and Physics, 14(7): 3657-3690.
|
|
|
| [12] |
Du H Q, Fan Y W, Luo L H, et al. 2023. Identification of natural and anthropogenic sources and the effects of climatic fluctuations and land use changes on dust emissions variations in the Qinghai-Tibetan Plateau. Agricultural and Forest Meteorology, 340: 109628, doi: 10.1016/j.agrformet.2023.109628.
|
|
|
| [13] |
Friedl M A, McIver D K, Hodges J C F, et al. 2002. Global land cover mapping from MODIS: algorithms and early results. Remote Sensing of Environment, 83(1-2): 287-302.
|
|
|
| [14] |
Gan Y, Zhang Z, Liu F Q, et al. 2024. Analysis of characteristics and changes in three-dimensional spatial and temporal distribution of aerosol types in Central Asia. Science of The Total Environment, 927: 172196, doi: 10.1016/j.scitotenv.2024.172196.
|
|
|
| [15] |
Gan Y, Zhang Z, Yang Y C, et al. 2025. Study on typical dust aerosol transport processes and radiative effects in Central Asia using EOF decomposition. Global and Planetary Change, 252: 104869, doi: 10.1016/j.gloplacha.2025.104869.
|
|
|
| [16] |
Hofer J, Althausen D, Abdullaev, S F, et al. 2017. Long-term profiling of mineral dust and pollution aerosol with multiwavelength polarization Raman liDAR at the Central Asian site of Dushanbe, Tajikistan: case studies. Atmospheric Chemistry and Physics, 17(23): 14559-14577.
|
|
|
| [17] |
Holben B N, Eck T F, Slutsker I, et al. 1998. AERONET-a federated instrument network and data archive for aerosol characterization. Remote Sensing of Environment, 66(1): 1-16.
|
|
|
| [18] |
Hsu N C, Gautam R, Sayer A M, et al. 2012. Global and regional trends of aerosol optical depth over land and ocean using SeaWiFS measurements from 1997 to 2010. Atmospheric Chemistry and Physics, 12(17): 8037-8053.
|
|
|
| [19] |
Hurst H E. 2013. Closure to long-term storage capacity of reservoirs by H. E. Hurst. Transactions of the American Society of Civil Engineers, 116: 804-808.
|
|
|
| [20] |
Ichoku C, Chu D A, Mattoo S, et al. 2002. A spatio-temporal approach for global validation and analysis of MODIS aerosol products. Geophysical Research Letters, 29(12): MOD1-1-MOD1-4, doi: 10.1029/2001GL013206.
|
|
|
| [21] |
Jiang D Y, Wang L C, Yi X P, et al. 2022. Comprehensive evaluation of multisource aerosol optical depth gridded products over China. Atmospheric Environment, 278: 119088, doi: 10.1016/j.atmosenv.2022.119088.
|
|
|
| [22] |
Kang N, Kumar K R, Hu K, et al. 2016. Long-term (2002-2014) evolution and trend in collection 5.1 Level-2 aerosol products derived from the MODIS and MISR sensors over the Chinese Yangtze River Delta. Atmospheric Research, 181: 29-43.
|
|
|
| [23] |
Kaskaoutis D G, Grivas G, Liakakou E, et al. 2021. Assessment of the COVID-19 lockdown effects on spectral aerosol scattering and absorption properties in Athens, Greece. Atmosphere, 12(2): 231, doi: 10.3390/atmos12020231.
|
|
|
| [24] |
Kendall M G. 1955. Rank correlation methods. British Journal of Psychology, 25(1): 86-91.
|
|
|
| [25] |
Klingmüller K, Pozzer A, Metzger S, et al. 2016. Aerosol optical depth trend over the Middle East. Atmospheric Chemistry and Physics, 16(8): 5063-5073.
|
|
|
| [26] |
Kumar K R, Boiyo R, Madina A, et al. 2018. A 13-year climatological study on the variations of aerosol and cloud properties over Kazakhstan from remotely sensed satellite observations. Journal of Atmospheric and Solar-Terrestrial Physics, 179: 55-68.
|
|
|
| [27] |
Labban A H, Butt M J. 2023. Evaluation of MERRA-2 data for aerosols patterns over the Kingdom of Saudi Arabia. Heliyon, 9(6): e17047, doi: 10.1016/j.heliyon.2023.e17047.
|
|
|
| [28] |
Levy R C, Remer L A, Kleidman R G, et al. 2010. Global evaluation of the collection 5 MODIS dark-target aerosol products over land. Atmospheric Chemistry and Physics, 10(21): 10399-10420.
|
|
|
| [29] |
Li C G, Ling X L, Liu W H, et al. 2025. Long-term spatiotemporal variability and source attribution of aerosols over Xinjiang, China. Remote Sensing, 17(13): 2207, doi: 10.3390/rs17132207.
|
|
|
| [30] |
Li J L, Ge X Y, He Q, et al. 2021a. Aerosol optical depth (AOD): spatial and temporal variations and association with meteorological covariates in Taklimakan Desert, China. PeerJ, 9: e10542, doi: 10.7717/peerj.10542.
|
|
|
| [31] |
Li J L, He Q, Ge X Y, et al. 2021b. Spatio-temporal changes of AOD in Xinjiang of China from 2000 to 2019: which factor is more influential, natural factor or human factor? PLoS ONE, 16(8): e0253942, doi: 10.1371/journal.pone.0253942.
|
|
|
| [32] |
Li X H, Ginoux P. 2025. An empirical parameterization to separate coarse and fine mode aerosol optical depth over land. Geophysical Research Letters, 52(6), e2024GL114397, doi: 10.1029/2024GL114397.
|
|
|
| [33] |
Liu J, Ding J L, Li L, et al. 2020. Characteristics of aerosol optical depth over land types in central Asia. Science of The Total Environment, 727: 138676, doi: 10.1016/j.scitotenv.2020.138676.
|
|
|
| [34] |
Liu J, Ding J L, Li X H, et al. 2023. Identification of dust aerosols, their sources, and the effect of soil moisture in Central Asia. Science of The Total Environment, 868: 161575, doi: 10.1016/j.scitotenv.2023.161575.
|
|
|
| [35] |
Liu X, Min R Q, Zhang H P, et al. 2025. Land cover changes reduce dust aerosol concentrations in Northern China (2000-2020). Environmental Research, 268: 120823, doi: 10.1016/j.envres.2025.120823.
|
|
|
| [36] |
Liu Y, Zhu Q, Wang R, et al. 2019. Distribution, source and transport of the aerosols over Central Asia. Atmospheric Environment, 210: 120-131.
|
|
|
| [37] |
Loeb N G, Su W Y, Bellouin N, et al. 2021. Changes in clear-sky shortwave aerosol direct radiative effects since 2002. Journal of Geophysical Research: Atmospheres, 126(5): e2020JD034090, doi: 10.1029/2020JD034090.
|
|
|
| [38] |
Logothetis S A, Salamalikis V, Gkikas A, et al. 2021. 15-year variability of desert dust optical depth on global and regional scales. Atmospheric Chemistry and Physics, 21(21): 16499-16529.
|
|
|
| [39] |
Magistrali I C, Delgado R C, Santos G L, et al. 2021. Performance of CCCma and GFDL climate models using remote sensing and surface data for the state of Rio de Janeiro-Brazil. Remote Sensing Applications: Society and Environment, 21: 100446, doi: 10.1016/j.rsase.2020.100446.
|
|
|
| [40] |
Mao Q J, Huang C L, Zhang H X, et al. 2018. Aerosol optical properties and radiative effect under different weather conditions in Harbin, China. Infrared Physics & Technology, 89: 304-314.
|
|
|
| [41] |
Mao Q J, Huang C L, Zhang H X, et al. 2021. Performance of MODIS aerosol products at various timescales and in different pollution conditions over eastern Asia. Science China Technological Sciences, 64: 774-784.
|
|
|
| [42] |
Markowicz K M, Chilinski M T, Lisok J, et al. 2016. Study of aerosol optical properties during long-range transport of biomass burning from Canada to Central Europe in July 2013. Journal of Aerosol Science, 101: 156-173.
|
|
|
| [43] |
Meng L, He Q, Zhao T L, et al. 2025. Association of spring thermal forcing anomalies in the Tibetan Plateau with dust aerosol changes over the Taklamakan Desert. Science of The Total Environment, 958: 177839, doi: 10.1016/j.scitotenv.2024.177839.
|
|
|
| [44] |
Mhawish A, Banerjee T, Hamer M S, et al. 2019. Comparison and evaluation of MODIS Multi-angle Implementation of Atmospheric Correction (MAIAC) aerosol product over South Asia. Remote Sensing of Environment, 224: 12-28.
|
|
|
| [45] |
Mukkavilli S K, Prasad A A, Taylor R A, et al. 2019. Assessment of atmospheric aerosols from two reanalysis products over Australia. Atmospheric Research, 215: 149-164.
|
|
|
| [46] |
Ng D H L, Li R M, Raghavan S V, et al. 2017. Investigating the relationship between aerosol optical depth and precipitation over Southeast Asia with relative humidity as an influencing factor. Scientific Reports, 7(1): 13395, doi: 10.1038/s41598-017-10858-1.
|
|
|
| [47] |
Ou Y, Li Z Q, Chen C, et al. 2022. Evaluation of MERRA-2 aerosol optical and component properties over China using SONET and PARASOL/GRASP Data. Remote Sensing, 14(4): 821, doi: 10.3390/rs14040821.
|
|
|
| [48] |
Proestakis E, Amiridis V, Marinou E, et al. 2018. Nine-year spatial and temporal evolution of desert dust aerosols over South and East Asia as revealed by CALIOP. Atmospheric Chemistry and Physics, 18(2): 1337-1362.
|
|
|
| [49] |
Pye H O T, Ward-Caviness C K, Murphy B N, et al. 2021. Secondary organic aerosol association with cardiorespiratory disease mortality in the United States. Nature Communications, 12: 7215, doi: 10.1038/s41467-021-27484-1.
|
|
|
| [50] |
Remer L A, Kaufman Y J, Tanré D, et al. 2005. The MODIS aerosol algorithm, products, and validation. Journal of the Atmospheric Sciences, 62(4): 947-973.
|
|
|
| [51] |
Rosenfeld D, Andreae M O, Asmi A, et al. 2014. Global observations of aerosol-cloud precipitation-climate interactions. Reviews of Geophysics, 52(4): 750-808.
|
|
|
| [52] |
Rosenfeld D, Zhu Y N, Wang M H, et al. 2019. Aerosol-driven droplet concentrations dominate coverage and water of oceanic low-level clouds. Science, 363: 6427, doi: 10.1126/science.aav056.
|
|
|
| [53] |
Rupakheti D, Rupakheti M, Yin X F, et al. 2021. Modifications in aerosol physical, optical and radiative properties during heavy aerosol events over Dushanbe, Central Asia. Geoscience Frontiers, 12(6): 101251, doi: 10.1016/j.gsf.2021.101251.
|
|
|
| [54] |
Safarov R, Shomanova Z, Nossenko Y, et al. 2024. Spatial analysis of air pollutants in an industrial city using GIS-based techniques: A case study of Pavlodar, Kazakhstan. Sustainability, 16(17): 7834, doi: 10.3390/su16177834.
|
|
|
| [55] |
Samman A E, Butt M J. 2025. Evaluating the Performance of MODIS and MERRA-2 AOD Retrievals Using AERONET Observations in the Dust Belt Region. Earth, 6(4): 115, doi: 10.3390/earth6040115.
|
|
|
| [56] |
Sayer A M, Munchak L A, Hsu N C, et al. 2014. MODIS collection 6 aerosol products: comparison between Aqua's e-deep blue, dark target, and ''merged'' data sets, and usage recommendations. Journal of Geophysical Research: Atmospheres, 119(24): 965-989.
|
|
|
| [57] |
Sen P K. 1968. Estimates of the regression coefficient based on Kendall's Tau. Journal of the American Statistical Association, 63(324): 1379-1389.
|
|
|
| [58] |
Shi S Q, Yang P Q, Vrieling A, et al. 2025. Vegetation optimal temperature modulates global vegetation season onset shifts in response to warming climate. Communications Earth & Environment, 6: 203, doi: 10.1038/s43247-025-02186-4.
|
|
|
| [59] |
Song Z J, Fu D S, Zhang X L, et al. 2018. Diurnal and seasonal variability of PM2.5, and AOD in North China plain: comparison of MERRA-2 products and ground measurements. Atmospheric Environment, 191: 70-78.
|
|
|
| [60] |
Su X, Huang Y H, Wang L C, et al. 2023. Validation and diurnal variation evaluation of MERRA-2 multiple aerosol properties on a global scale. Atmospheric Environment, 311: 120019, doi: 10.1016/j.atmosenv.2023.120019.
|
|
|
| [61] |
Sun E W, Xu X F, Che H Z, et al. 2019a. Variation in MERRA-2 aerosol optical depth and absorption aerosol optical depth over China from 1980 to 2017. Journal of Atmospheric and Solar-Terrestrial Physics, 186: 8-19.
|
|
|
| [62] |
Sun E W, Che H Z, Xu X F, et al. 2019b. Variation in MERRA-2 aerosol optical depth over the Yangtze River Delta from 1980 to 2016. Theoretical and Applied Climatology, 136(1): 363-375.
|
|
|
| [63] |
Swain B, Vountas M, Singh A, et al. 2025. Model simulations capture seasonal Arctic Haze and clean-air cycle better than satellite and reanalysis. Nature, 15: 42394, doi: 10.1038/s41598-025-29188-8.
|
|
|
| [64] |
Theil H. 1992. A rank-invariant method of linear and polynomial regression analysis. In: Raj B, Koerts J. Henri Theil's Contributions to Economics and Econometrics. Dordrecht: Springer, 345-381.
|
|
|
| [65] |
Tong Y, Feng L, Sun K, et al. 2020. Assessment of the representativeness of MODIS aerosol optical depth products at different temporal scales using global AERONET measurements. Remote Sensing, 12(14): 2330, doi: 10.3390/rs12142330.
|
|
|
| [66] |
Tuheti A, Dong Z P, Deng S X. 2025. Interdecadal variations of aerosol and its composition over the Fenwei Plain based on multi-source observations. Journal of Environmental Sciences, 156: 139-156.
|
|
|
| [67] |
Varis O, Kummu M. 2012. The major Central Asian river basins: An assessment of vulnerability. International Journal of Water Resources Development, 28(3): 433-452.
|
|
|
| [68] |
Wang D, Zhang F, Yang S T, et al. 2020. Exploring the spatial-temporal characteristics of the aerosol optical depth (AOD) in Central Asia based on the Moderate Resolution Imaging Spectroradiometer (MODIS). Environmental Monitoring and Assessment, 192: 383, doi: 10.1007/s10661-020-08299-x.
|
|
|
| [69] |
Wang Y J, Tang J K, Wang W H, et al. 2024. Long-term spatiotemporal characteristics and influencing factors of dust aerosols in East Asia (2000-2022). Remote Sensing, 16(2): 318, doi: 10.3390/rs16020318.
|
|
|
| [70] |
Wu S H, Xue Y, Sun Y X, et al. 2023. Spatial and temporal variation of aerosol optical depth in Huaihai economic zone from 1982 to 2021. Atmosphere, 14(5): 822, doi: 10.3390/atmos14050822.
|
|
|
| [71] |
Xu X F, Qiu J H, Xia X G, et al. 2015. Characteristics of atmospheric aerosol optical depth variation in China during 1993-2012. Atmospheric Environment, 119: 82-94.
|
|
|
| [72] |
Xu Y H, Liu Q, Chen Y H, et al. 2024. Impact of land cover variations on surface albedo in Xinjiang and its surrounding Central Asian region. Arid Zone Research, 41(10): 1649-1661. (in Chinese)
|
|
|
| [73] |
Yang N, Xia Y, Xie F, et al. 2025. Aerosol emission reductions cause post-2011 rapid warming in the northwestern Pacific. Communications Earth & Environment, 6: 1047, doi: 10.1038/s43247-025-03015-4.
|
|
|
| [74] |
Yang X C, Zhao C F, Luo N N, et al. 2020. Evaluation and comparison of Himawari-8 L 2 V1.0, V2.1 and MODIS C6.1 aerosol products over Asia and the Oceania regions. Atmospheric Environment, 220: 117068, doi: 10.1016/j.atmosenv.2019.117068.
|
|
|
| [75] |
Yang Y, Wang H L, Smith S J, et al. 2017. Global source attribution of sulfate concentration and direct and indirect radiative forcing. Atmospheric Chemistry and Physics, 17(14): 8903-8922.
|
|
|
| [76] |
Yang Y K, Zhao C F, Sun L, et al. 2019. Improved aerosol retrievals over complex regions using NPP visible infrared imaging radiometer suite observations. Earth and Space Science, 6(4): 629-645.
|
|
|
| [77] |
Yuan M N, Wang Q Y, Zhao Z Z, et al. 2022. Seasonal variation of optical properties and source apportionment of black and brown carbon in Xi'an, China. Atmospheric Pollution Research, 13(6): 101448, doi: 10.1016/j.apr.2022.101448.
|
|
|
| [78] |
Zhang J, Lance S, Marto J, et al. 2020. Evolution of aerosol under moist and fog conditions in a rural forest environment: insights from high-resolution aerosol mass spectrometry. Geophysical Research Letters, 47(19): e2020GL089714, doi: 10.1029/2020GL089714.
|
|
|
| [79] |
Zhao Y L, Tan L, Liu X X, et al. 2025. Multi-model analyses of spatiotemporal variations of water resources in Central Asia. Water, 17(16): 2423, doi: 10.3390/w17162423.
|
|
|
| [80] |
Zhou G X, Chen Y N, Yao J Q. 2023. Variations in precipitation and temperature in Xinjiang (Northwest China) and their connection to atmospheric circulation. Frontiers in Environmental Science, 10: 1082713, doi: 10.3389/fenvs.2022.1082713.
|
|
|
| [81] |
Zhou Y C, Gao X, Meng X Y, et al. 2022. Characteristics of the spatio-temporal dynamics of aerosols in Central Asia and their influencing factors. Remote Sensing, 4(11): 2684, doi: 10.3390/rs14112684.
|
|
|
| [82] |
Zhu H H, Martin R V, van Donkelaar A, et al. 2024. Importance of aerosol composition and aerosol vertical profiles in global spatial variation in the relationship between PM2.5 and aerosol optical depth. Atmospheric Chemistry and Physics, 24(20): 11565-11584.
|
|
|
|
Viewed |
|
|
|
Full text
|
|
|
|
|
Abstract
|
|
|
|
|
Cited |
|
|
|
|
| |
Shared |
|
|
|
|
| |
Discussed |
|
|
|
|