| Research article |
|


|
|
|
| Lagged surface soil salinization responses to groundwater dynamics in the Yinchuan Plain: Stage dependence and spatial differentiation |
HAN Xu1, ZHOU Jianwei1,2,*( ), GONG Yongfeng3, LI Ran1, LI Jun1, YUE Yanan4 |
1 School of Environmental Studies, China University of Geosciences, Wuhan 430074, China
2 Key Laboratory of Mine Ecological Effects and Systematic Restoration, Ministry of Natural Resources, Beijing 100081, China
3 Ningxia Hui Autonomous Region Land and Resources Survey and Monitoring Institute, Yinchuan 750002, China
4 Institute of Natural Resources Survey, China University of Geosciences, Wuhan 430074, China |
|
|
|
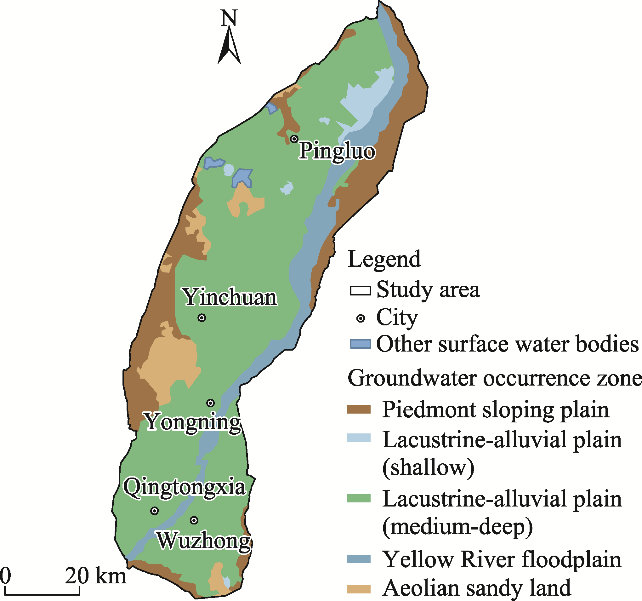
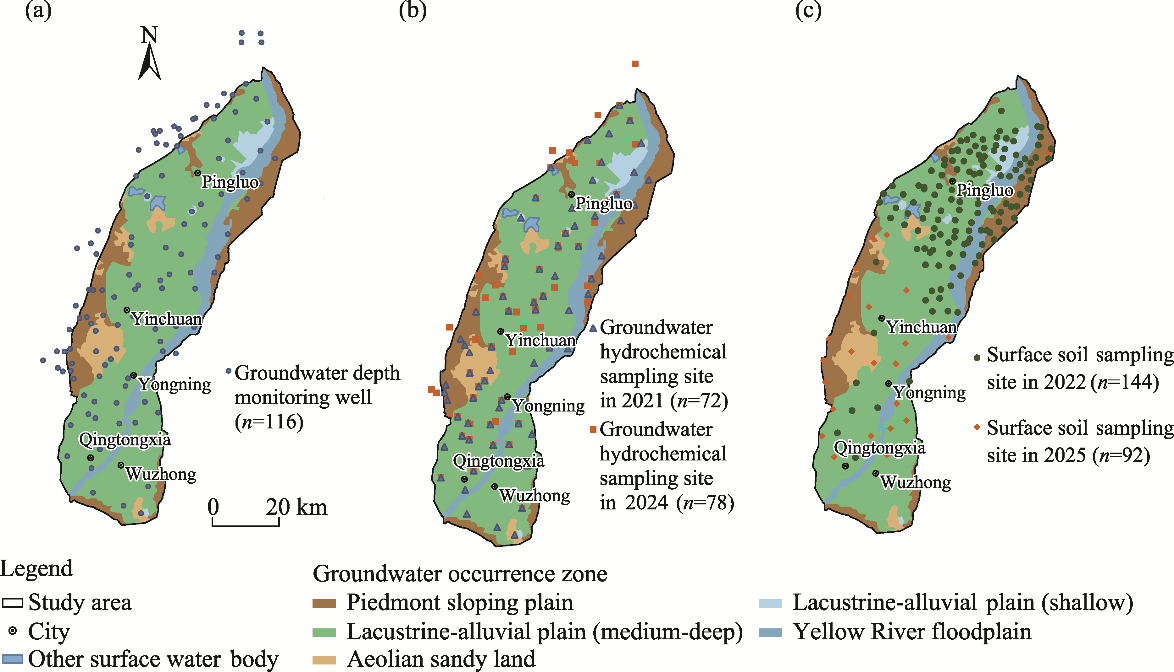
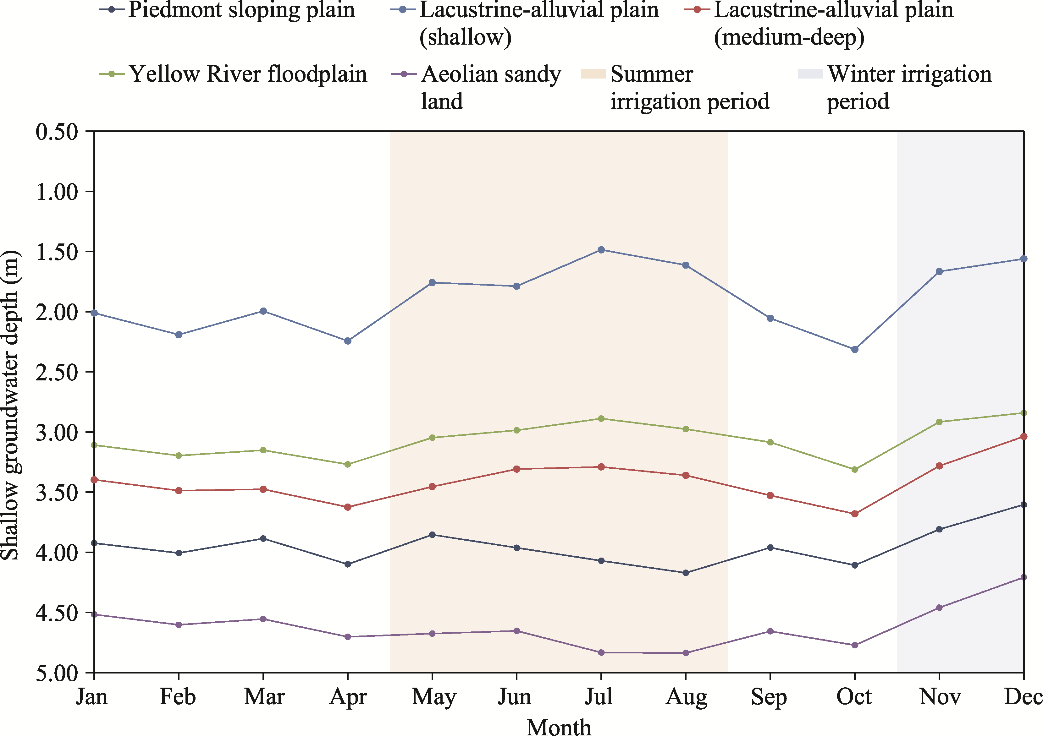
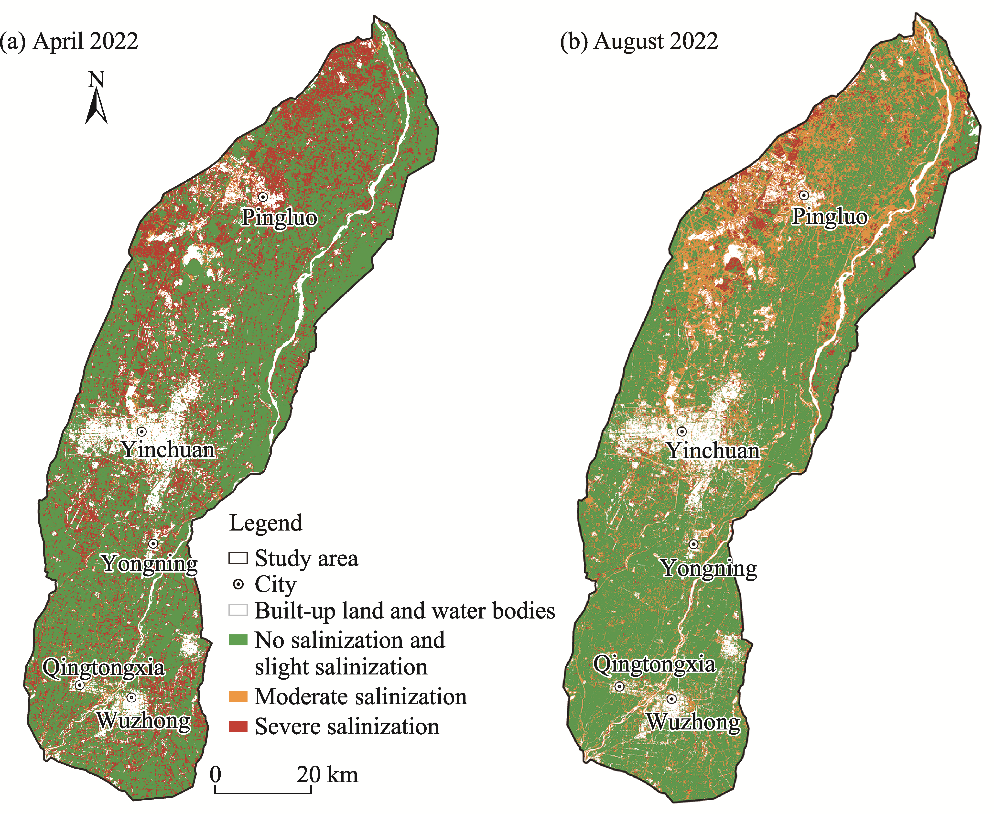
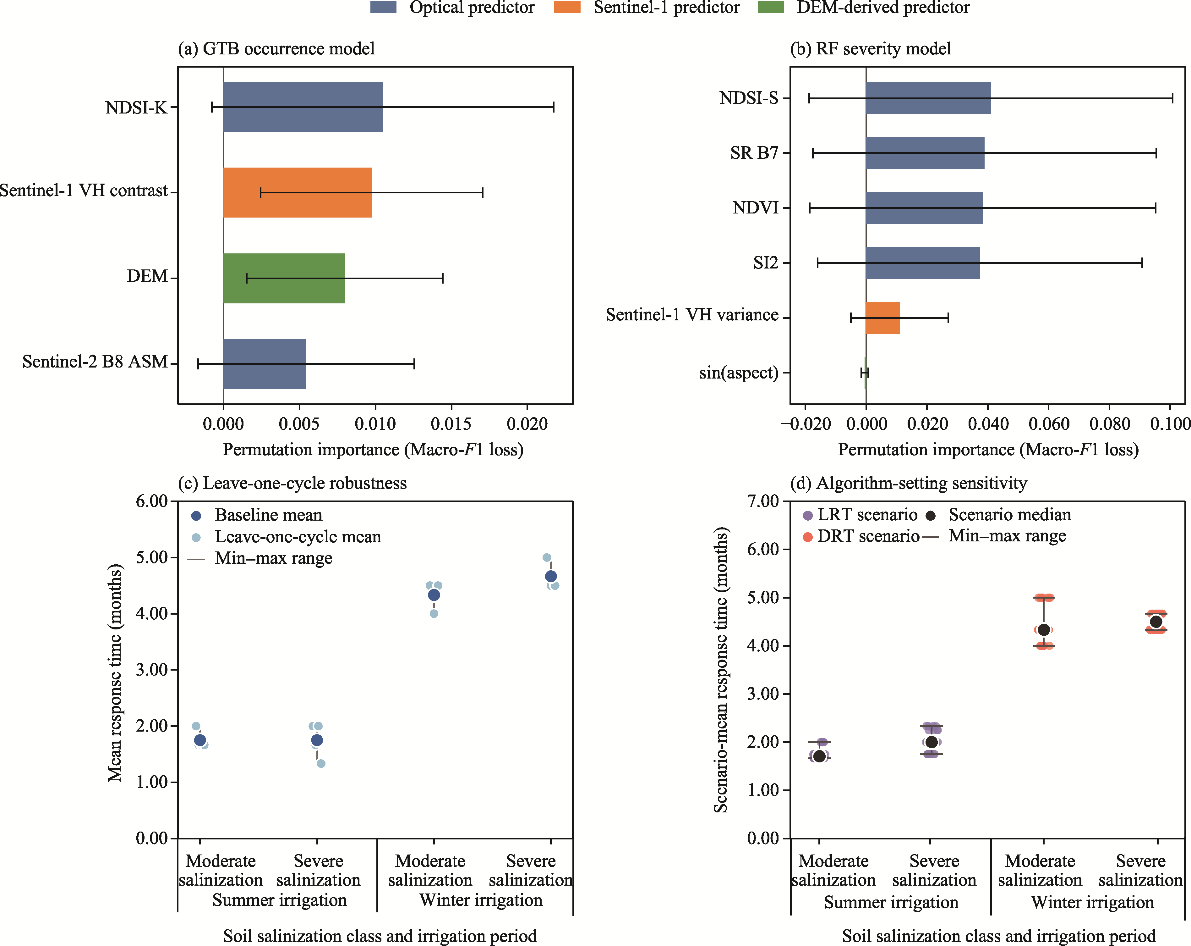
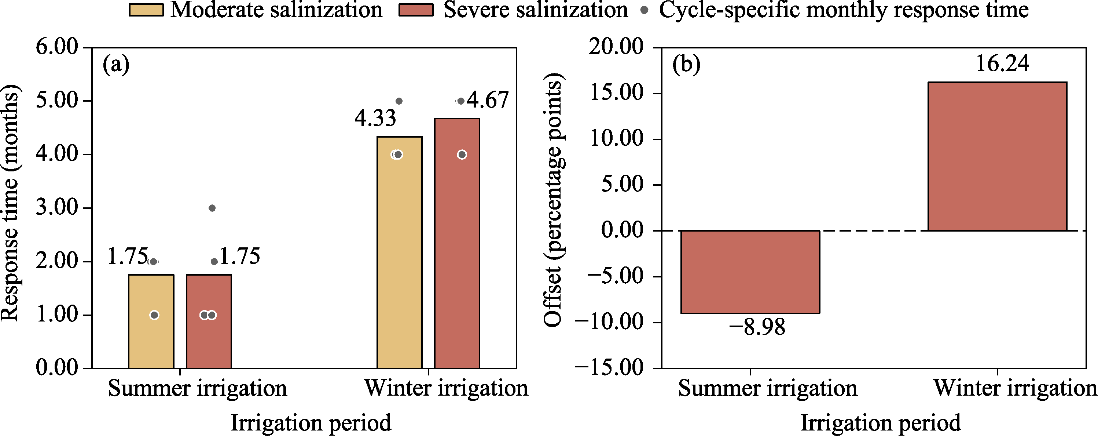
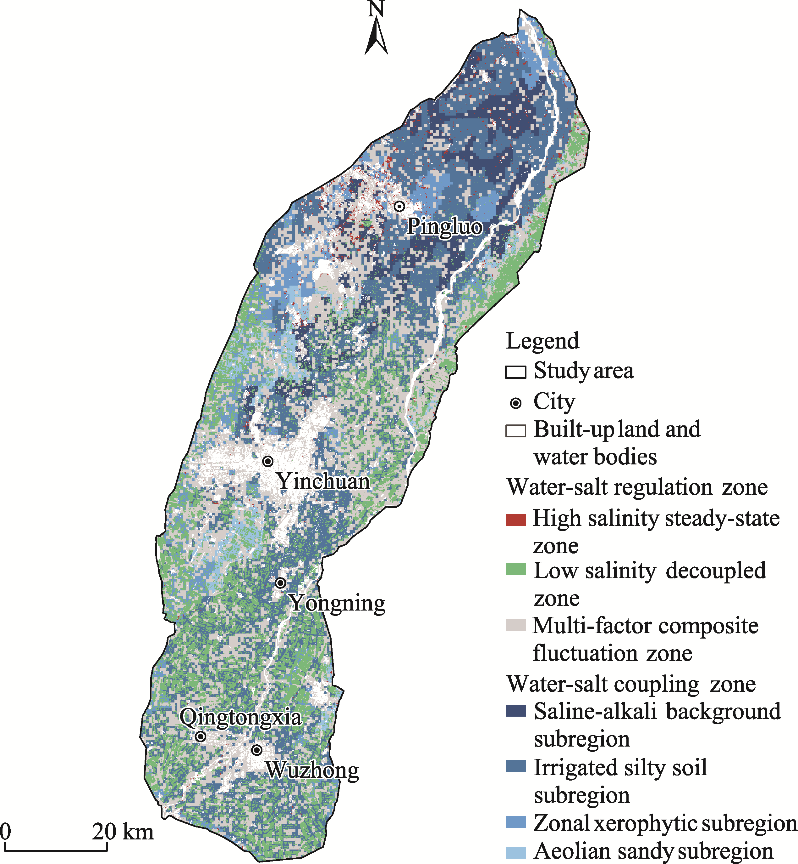
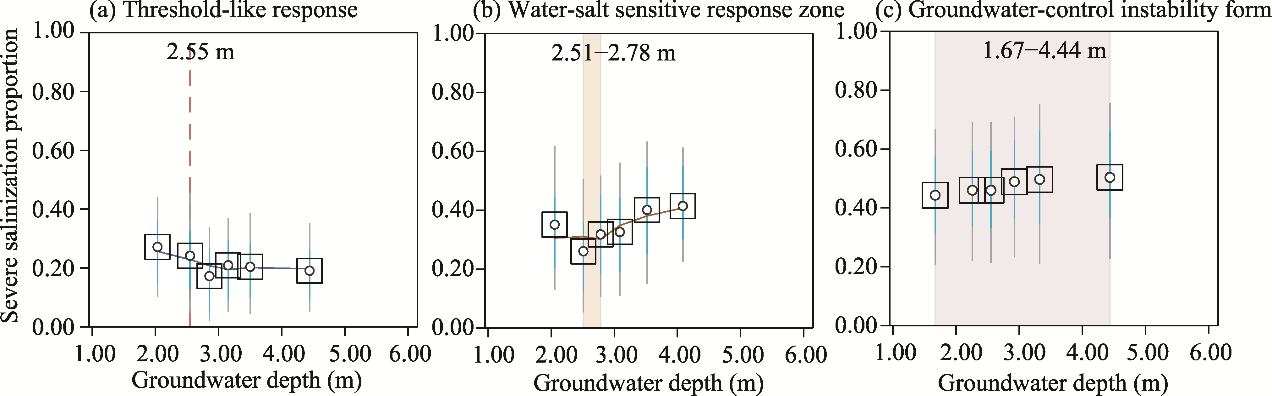
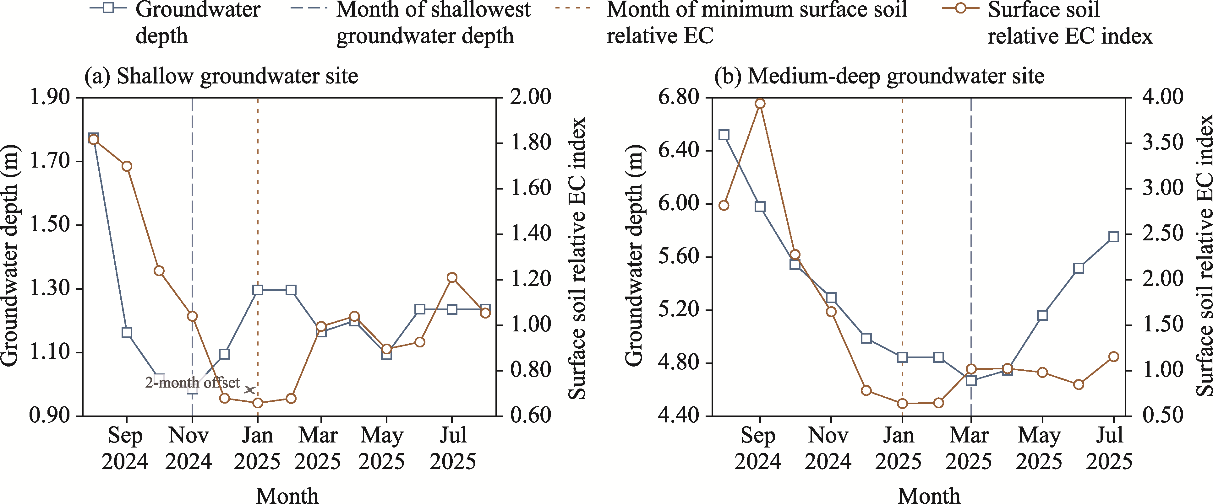
Abstract Shallow groundwater may influence surface soil salinization in arid irrigated plains, but the timing and spatial form of this association remain uncertain. Consequently, this study aimed to identify the monthly timing, seasonal asymmetry, and spatial differentiation of surface soil salinization responses associated with shallow groundwater dynamics. We combined monthly groundwater depth records from 116 monitoring wells (January 2021-August 2024) in the Yinchuan Plain, northwestern China, with multiple other datasets, including groundwater hydrochemical data, surface soil salinity samples, multi-source remote sensing images, model interpretability diagnostics, response-time sensitivity tests, and representative profile observations. A hierarchical classifier was trained using surface soil salinity samples collected in August 2022 and tested externally using independent samples collected in August 2025. The resulting monthly salinization class sequence was used as a model-generated regional indicator. Shallow, relatively saline groundwater was concentrated in the lacustrine-alluvial plain (shallow), whereas severe salinization was mainly found in the localized shallow groundwater areas. A regional class area analysis showed a decrease in the severe salinization area proportion accompanied by an increase in the moderate salinization area proportion within 1.00-3.00 months after the onset of summer irrigation-related groundwater shallowing. Approximately 4.00-5.00 months after the onset of winter irrigation-related groundwater shallowing, a delayed winter-spring resalinization signal was detected. Sensitivity tests showed that the separation between earlier summer responses and later winter responses persisted across the tested cycle subsets and operational settings. The water-salt coupling zone accounted for 56.97% of the classified area, and three response-based groundwater-control forms were identified: threshold-like depth, water-salt sensitive response zone, and groundwater-control instability form. These findings support salinity management that considers both the subregional setting and seasonal stage. The predicted 4.00- to 5.00-month delay in winter-spring resalinization should be understood as an integrated winter-spring resalinization indicator rather than a direct groundwater transit time. More broadly, this response-based paradigm extends regional research on groundwater-related surface soil salinization beyond static depth thresholds by explicitly accounting for temporal lags, seasonal stages, and hydrogeological heterogeneity.
|
|
Received: 24 April 2026
Published: 30 November 2026
|
|
Corresponding Authors:
*ZHOU Jianwei (E-mail: jw.zhou@cug.edu.cn)
|
| About author: Author contributions
Conceptualization: HAN Xu, ZHOU Jianwei; Data curation: HAN Xu, GONG Yongfeng, LI Ran; Formal analysis: HAN Xu; Funding acquisition: ZHOU Jianwei; Investigation: HAN Xu, GONG Yongfeng, LI Ran, LI Jun, YUE Yanan; Methodology: HAN Xu, ZHOU Jianwei; Project administration: ZHOU Jianwei; Resources: GONG Yongfeng, ZHOU Jianwei; Software: HAN Xu; Supervision: ZHOU Jianwei; Validation: HAN Xu, LI Ran, LI Jun; Visualization: HAN Xu; Writing - original draft preparation: HAN Xu; Writing - review and editing: HAN Xu, ZHOU Jianwei, GONG Yongfeng, LI Ran, LI Jun, YUE Yanan. All authors approved the manuscript.
|
|
|
| [1] |
Aihaiti A, Nurmemet I, Yu X R, et al. 2025. An enhanced soil salinity estimation method for arid regions using multisource remote sensing data and advanced feature selection. CATENA, 256: 109116, doi: 10.1016/j.catena.2025.109116.
|
|
|
| [2] |
Aksoy S, Sertel E, Roscher R, et al. 2024. Assessment of soil salinity using explainable machine learning methods and Landsat 8 images. International Journal of Applied Earth Observation and Geoinformation, 130: 103879, doi: 10.1016/j.jag.2024.103879.
|
|
|
| [3] |
Beltrán J M. 1999. Irrigation with saline water: benefits and environmental impact. Agricultural Water Management, 40(2-3): 183-194.
|
|
|
| [4] |
Ben-Hur M, Yolcu G, Uysal H, et al. 2009. Soil structure changes: aggregate size and soil texture effects on hydraulic conductivity under different saline and sodic conditions. Australian Journal of Soil Research, 47(7): 688-696.
|
|
|
| [5] |
Cai Z Z, Wang W K, Zhao M, et al. 2020. Interaction between surface water and groundwater in Yinchuan Plain. Water, 12(9): 2635, doi: 10.3390/w12092635.
|
|
|
| [6] |
Chen S, Mao X M, Shang S H. 2022. Response and contribution of shallow groundwater to soil water/salt budget and crop growth in layered soils. Agricultural Water Management, 266: 107574, doi: 10.1016/j.agwat.2022.107574.
|
|
|
| [7] |
Chen X, Hu Q. 2004. Groundwater influences on soil moisture and surface evaporation. Journal of Hydrology, 297(1-4): 285-300.
|
|
|
| [8] |
Feng Z Z, Wang X K, Feng Z W. 2005. Soil N and salinity leaching after the autumn irrigation and its impact on groundwater in Hetao Irrigation District, China. Agricultural Water Management, 71(2): 131-143.
|
|
|
| [9] |
Forkutsa I, Sommer R, Shirokova Y I, et al. 2009. Modeling irrigated cotton with shallow groundwater in the Aral Sea Basin of Uzbekistan: II. Soil salinity dynamics. Irrigation Science, 27(4): 319-330.
|
|
|
| [10] |
Foster S, Pulido-Bosch A, Vallejos Á, et al. 2018. Impact of irrigated agriculture on groundwater-recharge salinity: a major sustainability concern in semi-arid regions. Hydrogeology Journal, 26(8): 2781-2791.
|
|
|
| [11] |
Fu C, Xue J, Chen J F, et al. 2024. Evaluating spatial and temporal variations of soil water, heat, and salt under autumn irrigation in the Hetao Irrigation District based on distributed SHAW model. Agricultural Water Management, 293: 108707, doi: 10.1016/j.agwat.2024.108707.
|
|
|
| [12] |
Fujimaki H, Shimano T, Inoue M, et al. 2006. Effect of a salt crust on evaporation from a bare saline soil. Vadose Zone Journal, 5(4): 1246-1256.
|
|
|
| [13] |
Gerke H H. 2006. Preferential flow descriptions for structured soils. Journal of Plant Nutrition and Soil Science, 169(3): 382-400.
|
|
|
| [14] |
Gowing J W, Konukcu F, Rose D A. 2006. Evaporative flux from a shallow watertable: the influence of a vapour-liquid phase transition. Journal of Hydrology, 321(1-4): 77-89.
|
|
|
| [15] |
Guo S H, Li X Y, Šimůnek J, et al. 2024. Experimental and numerical evaluation of soil water and salt dynamics in a corn field with shallow saline groundwater and crop-season drip and autumn post-harvest irrigations. Agricultural Water Management, 305: 109119, doi: 10.1016/j.agwat.2024.109119.
|
|
|
| [16] |
Holland K L, Jolly I D, Overton I C, et al. 2009. Analytical model of salinity risk from groundwater discharge in semi-arid, lowland floodplains. Hydrological Processes, 23(24): 3428-3439.
|
|
|
| [17] |
Huang X, Rudolph D L. 2023. Numerical study of coupled water and vapor flow, heat transfer, and solute transport in variably-saturated deformable soil during freeze-thaw cycles. Water Resources Research, 59(10): e2022WR032146, doi: 10.1029/2022WR032146.
|
|
|
| [18] |
Ibrahimi M K, Miyazaki T, Nishimura T, et al. 2014. Contribution of shallow groundwater rapid fluctuation to soil salinization under arid and semiarid climate. Arabian Journal of Geosciences, 7(9): 3901-3911.
|
|
|
| [19] |
Ivushkin K, Bartholomeus H, Bregt A K, et al. 2019. Global mapping of soil salinity change. Remote Sensing of Environment, 231: 111260, doi: 10.1016/j.rse.2019.111260.
|
|
|
| [20] |
Khan N M, Rastoskuev V V, Sato Y, et al. 2005. Assessment of hydrosaline land degradation by using a simple approach of remote sensing indicators. Agricultural Water Management, 77(1-3): 96-109.
|
|
|
| [21] |
Kong J, Xin P, Hua G F, et al. 2015. Effects of vadose zone on groundwater table fluctuations in unconfined aquifers. Journal of Hydrology, 528: 397-407.
|
|
|
| [22] |
Li C C, Gao X B, Li S Q, et al. 2020. A review of the distribution, sources, genesis, and environmental concerns of salinity in groundwater. Environmental Science and Pollution Research, 27(33): 41157-41174.
|
|
|
| [23] |
Li H F, Wang J, Liu H, et al. 2022. Quantitative analysis of temporal and spatial variations of soil salinization and groundwater depth along the Yellow River saline-alkali land. Sustainability, 14(12): 6967, doi: 10.3390/su14126967.
|
|
|
| [24] |
Li H Y, Zhao G Z, Xie S M, et al. 2024. The mechanism of the influence of different irrigation methods on groundwater recharge. Water, 16(11): 1565, doi: 10.3390/w16111565.
|
|
|
| [25] |
Li R P, Shi H B, Flerchinger G N, et al. 2012. Simulation of freezing and thawing soils in Inner Mongolia Hetao Irrigation District, China. Geoderma, 173-174: 28-33.
|
|
|
| [26] |
Liu P F, Zhang G H, Cui S J, et al. 2023. Effects of groundwater level control on soil salinity change in farmland around wetlands in arid areas: a case study of the lower reaches of the Shiyang River Basin, China. Water, 15(7): 1308, doi: 10.3390/w15071308.
|
|
|
| [27] |
Liu S, Huang Q Z, Ren D Y, et al. 2021. Soil evaporation and its impact on salt accumulation in different landscapes under freeze-thaw conditions in an arid seasonal frozen region. Vadose Zone Journal, 20(2): e20098, doi: 10.1002/vzj2.20098.
|
|
|
| [28] |
Liu Y L, Jin M G, Wang J J. 2018. Insights into groundwater salinization from hydrogeochemical and isotopic evidence in an arid inland basin. Hydrological Processes, 32(20): 3108-3127.
|
|
|
| [29] |
Min L L, Shen Y J, Pei H W. 2015. Estimating groundwater recharge using deep vadose zone data under typical irrigated cropland in the piedmont region of the North China Plain. Journal of Hydrology, 527: 305-315.
|
|
|
| [30] |
Moeck C, Collenteur R A, Berghuijs W R, et al. 2024. A global assessment of groundwater recharge response to infiltration variability at monthly to decadal timescales. Water Resources Research, 60(6): e2023WR035828, doi: 10.1029/2023WR035828.
|
|
|
| [31] |
Nick S M, Copty N K, Saygın S D, et al. 2024. Impact of soil compaction and irrigation practices on salt dynamics in the presence of a saline shallow groundwater: an experimental and modelling study. Hydrological Processes, 38(3): e15135, doi: 10.1002/hyp.15135.
|
|
|
| [32] |
Nosetto M D, Jobbágy E G, Jackson R B, et al. 2009. Reciprocal influence of crops and shallow ground water in sandy landscapes of the Inland Pampas. Field Crops Research, 113(2): 138-148.
|
|
|
| [33] |
Nosetto M D, Acosta A M, Jayawickreme D H, et al. 2013. Land-use and topography shape soil and groundwater salinity in central Argentina. Agricultural Water Management, 129: 120-129.
|
|
|
| [34] |
Pulido-Bosch A, Rigol-Sanchez J P, Vallejos A, et al. 2018. Impacts of agricultural irrigation on groundwater salinity. Environmental Earth Sciences, 77(5): 197, doi: 10.1007/s12665-018-7386-6.
|
|
|
| [35] |
Ramos T B, Liu M H, Paredes P, et al. 2023. Salts dynamics in maize irrigation in the Hetao Plateau using static water table lysimeters and HYDRUS-1D with focus on the autumn leaching irrigation. Agricultural Water Management, 283: 108306, doi: 10.1016/j.agwat.2023.108306.
|
|
|
| [36] |
Ren D Y, Wei B Y, Xu X, et al. 2019. Analyzing spatiotemporal characteristics of soil salinity in arid irrigated agro-ecosystems using integrated approaches. Geoderma, 356: 113935, doi: 10.1016/j.geoderma.2019.113935.
|
|
|
| [37] |
Rose D A, Konukcu F, Gowing J W. 2005. Effect of watertable depth on evaporation and salt accumulation from saline groundwater. Australian Journal of Soil Research, 43(5): 565-573.
|
|
|
| [38] |
Salama R B, Otto C J, Fitzpatrick R W. 1999. Contributions of groundwater conditions to soil and water salinization. Hydrogeology Journal, 7(1): 46-64.
|
|
|
| [39] |
Scudiero E, Skaggs T H, Corwin D L. 2015. Regional-scale soil salinity assessment using Landsat ETM+ canopy reflectance. Remote Sensing of Environment, 169: 335-343.
|
|
|
| [40] |
Shen Z T, Bai Y G, Zheng M, et al. 2026. Spatial and temporal variations in soil salinity and groundwater in the downstream Yarkant River Irrigation District. Water, 18(1): 11, doi: 10.3390/w18010011.
|
|
|
| [41] |
Shokri N, Salvucci G D. 2011. Evaporation from porous media in the presence of a water table. Vadose Zone Journal, 10(4): 1309-1318.
|
|
|
| [42] |
Shokri-Kuehni S M S, Raaijmakers B, Kurz T, et al. 2020. Water table depth and soil salinization: from pore-scale processes to field-scale responses. Water Resources Research, 56(2): e2019WR026707, doi: 10.1029/2019WR026707.
|
|
|
| [43] |
Sprenger M, Leistert H, Gimbel K, et al. 2016. Illuminating hydrological processes at the soil-vegetation-atmosphere interface with water stable isotopes. Reviews of Geophysics, 54(3): 674-704.
|
|
|
| [44] |
Sultanov M, Ibrakhimov M, Akramkhanov A, et al. 2018. Modelling end-of-season soil salinity in irrigated agriculture through multi-temporal optical remote sensing, environmental parameters, and in situ information. PFG - Journal of Photogrammetry, Remote Sensing and Geoinformation Science, 86(5-6): 221-233.
|
|
|
| [45] |
Sun G F, Zhu Y, Ye M, et al. 2019. Development and application of long-term root zone salt balance model for predicting soil salinity in arid shallow water table area. Agricultural Water Management, 213: 486-498.
|
|
|
| [46] |
Sun G F, Zhu Y, Gao Z L, et al. 2022. Spatiotemporal patterns and key driving factors of soil salinity in dry and wet years in an arid agricultural area with shallow groundwater table. Agriculture, 12(8): 1243, doi: 10.3390/agriculture12081243.
|
|
|
| [47] |
Sun Y L, Wang L P, Yang S D, et al. 2025. Optimizing irrigation and drainage practices to control soil salinity in arid agroecosystems: a scenario-based modeling approach using SaltMod. Agronomy, 15(9): 2239, doi: 10.3390/agronomy15092239.
|
|
|
| [48] |
Tang S Q, She D L, Wang H D. 2021. Effect of salinity on soil structure and soil hydraulic characteristics. Canadian Journal of Soil Science, 101(1): 62-73.
|
|
|
| [49] |
Tsypkin G G. 2003. Accumulation and precipitation of salts during groundwater evaporation and flow. Fluid Dynamics, 38(6): 900-907.
|
|
|
| [50] |
Tu C W, Wang W R, Wang W H, et al. 2025. Irrigation suitability and interaction between surface water and groundwater influenced by agriculture activities in an arid plain of Central Asia. Agriculture, 15(15): 1704, doi: 10.3390/agriculture15151704.
|
|
|
| [51] |
Wang F, Han L L, Liu L L, et al. 2024. Advancements and perspective in the quantitative assessment of soil salinity utilizing remote sensing and machine learning algorithms: a review. Remote Sensing, 16(24): 4812, doi: 10.3390/rs16244812.
|
|
|
| [52] |
Wang H D, She D L, Cardoso R. 2023. Understanding the effect of seasonal climate variability on the salinity in unsaturated agricultural soil. Agronomy, 13(11): 2802, doi: 10.3390/agronomy13112802.
|
|
|
| [53] |
Wang J Q, Peng J, Li H Y, et al. 2021. Soil salinity mapping using machine learning algorithms with the Sentinel-2 MSI in arid areas, China. Remote Sensing, 13(2): 305, doi: 10.3390/rs13020305.
|
|
|
| [54] |
Wang J Z, Ding J L, Yu D L, et al. 2019. Capability of Sentinel-2 MSI data for monitoring and mapping of soil salinity in dry and wet seasons in the Ebinur Lake region, Xinjiang, China. Geoderma, 353: 172-187.
|
|
|
| [55] |
Wang L F, Hu F S, Yin L H, et al. 2013. Hydrochemical and isotopic study of groundwater in the Yinchuan Plain, China. Environmental Earth Sciences, 69(6): 2037-2057.
|
|
|
| [56] |
Wang W L, Sun J G. 2024. Estimation of soil salinity using satellite-based variables and machine learning methods. Earth Science Informatics, 17(6): 5049-5061.
|
|
|
| [57] |
Wang Y G, Deng C Y, Liu Y, et al. 2018. Identifying change in spatial accumulation of soil salinity in an inland river watershed, China. Science of The Total Environment, 621: 177-185.
|
|
|
| [58] |
Wang Y H, Li S E, Qin S J, et al. 2020. How can drip irrigation save water and reduce evapotranspiration compared to border irrigation in arid regions in Northwest China. Agricultural Water Management, 239: 106256, doi: 10.1016/j.agwat.2020.106256.
|
|
|
| [59] |
Wu M S, Huang J S, Wu J W, et al. 2016. Experimental study on evaporation from seasonally frozen soils under various water, solute and groundwater conditions in Inner Mongolia, China. Journal of Hydrology, 535: 46-53.
|
|
|
| [60] |
Xiao C, Ji Q Y, Chen J Q, et al. 2023. Prediction of soil salinity parameters using machine learning models in an arid region of Northwest China. Computers and Electronics in Agriculture, 204: 107512, doi: 10.1016/j.compag.2022.107512.
|
|
|
| [61] |
Xing X G, Li X W, Ma X Y. 2019. Capillary rise and saliferous groundwater evaporation: effects of various solutes and concentrations. Hydrology Research, 50(2): 517-525.
|
|
|
| [62] |
Xu X, Huang G H, Sun C, et al. 2013. Assessing the effects of water table depth on water use, soil salinity and wheat yield: searching for a target depth for irrigated areas in the upper Yellow River Basin. Agricultural Water Management, 125: 46-60.
|
|
|
| [63] |
Xue Q. 2011. Groundwater circulation properties and their changes in Yinchuan Plain. Journal of Geological Hazards and Environment Preservation, 22(1): 56-62. (in Chinese)
|
|
|
| [64] |
Zhang H R, Fu X, Zhang Y N, et al. 2023. Mapping multi-depth soil salinity using remote sensing-enabled machine learning in the Yellow River Delta, China. Remote Sensing, 15(24): 5640, doi: 10.3390/rs15245640.
|
|
|
| [65] |
Zhang X D, Ye P, Wu Y J, et al. 2022. Experimental study on simultaneous heat-water-salt migration of bare soil subjected to evaporation. Journal of Hydrology, 609: 127710, doi: 10.1016/j.jhydrol.2022.127710.
|
|
|
| [66] |
Zhang Y, Wu H Q, Kang Y L, et al. 2024. Mapping the soil salinity distribution and analyzing its spatial and temporal changes in Bachu County, Xinjiang, based on Google Earth Engine and machine learning. Agriculture, 14(4): 630, doi: 10.3390/agriculture14040630.
|
|
|
| [67] |
Zheng Y H, Yang M Z, Liu H J. 2022. The effects of truncating the capillary fringe on water-table dynamics during periodic forcing. Water Resources Research, 58(1): e2021WR031112, doi: 10.1029/2021WR031112.
|
|
|
| [68] |
Zhong C H, Yang Q C, Ma H Y, et al. 2019. Application of environmental isotopes to identify recharge source, age, and renewability of phreatic water in Yinchuan Basin. Hydrological Processes, 33(16): 2166-2173.
|
|
|
|
Viewed |
|
|
|
Full text
|
|
|
|
|
Abstract
|
|
|
|
|
Cited |
|
|
|
|
| |
Shared |
|
|
|
|
| |
Discussed |
|
|
|
|