| Research article |
|


|
|
|
| A CMIP6-based assessment of regional climate change in the Chinese Tianshan Mountains |
LIU Xinyu1,2,3, LI Xuemei1,2,3,*( ), ZHANG Zhengrong1,2,3, ZHAO Kaixin1,2,3, LI Lanhai4,5 ), ZHANG Zhengrong1,2,3, ZHAO Kaixin1,2,3, LI Lanhai4,5 |
1Faculty of Geomatics, Lanzhou Jiaotong University, Lanzhou 730070, China
2National-Local Joint Engineering Research Center of Technologies and Applications for National Geographic State Monitoring, Lanzhou 730070, China
3Gansu Provincial Engineering Laboratory for National Geographic State Monitoring, Lanzhou 730070, China
4State Key Laboratory of Desert and Oasis Ecology, Xinjiang Institute of Ecology and Geography, Chinese Academy of Sciences, Urumqi 830011, China
5Research Center for Ecology and Environment of Central Asia, Chinese Academy of Sciences, Urumqi 830011, China |
|
|
|
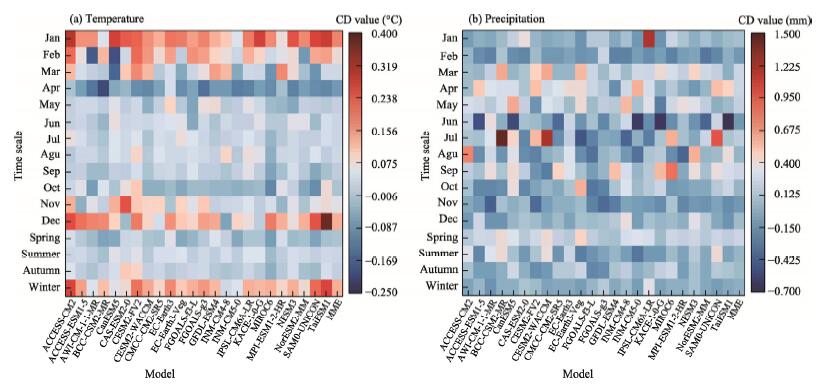
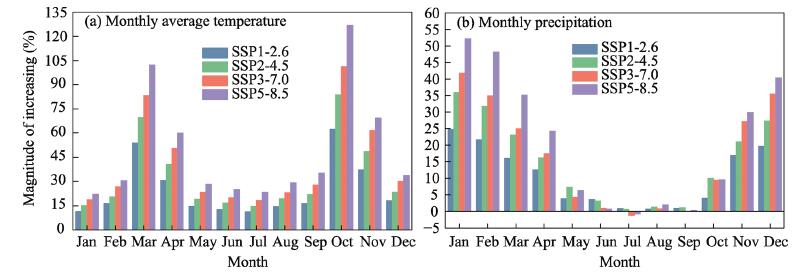
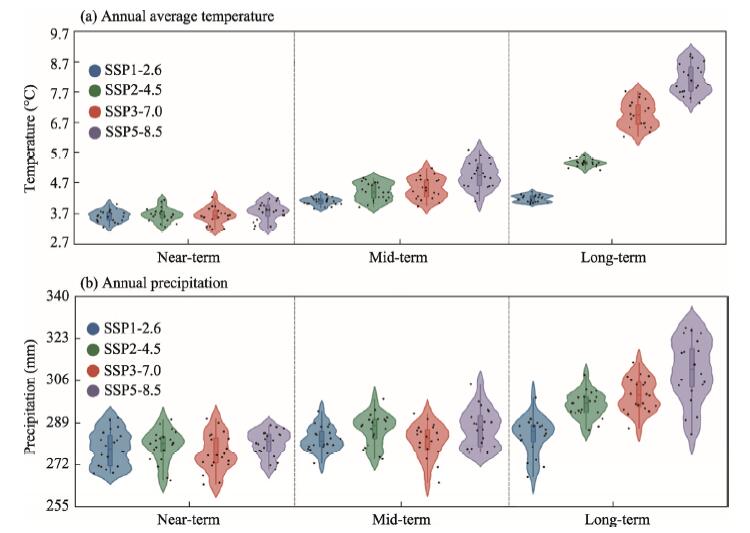
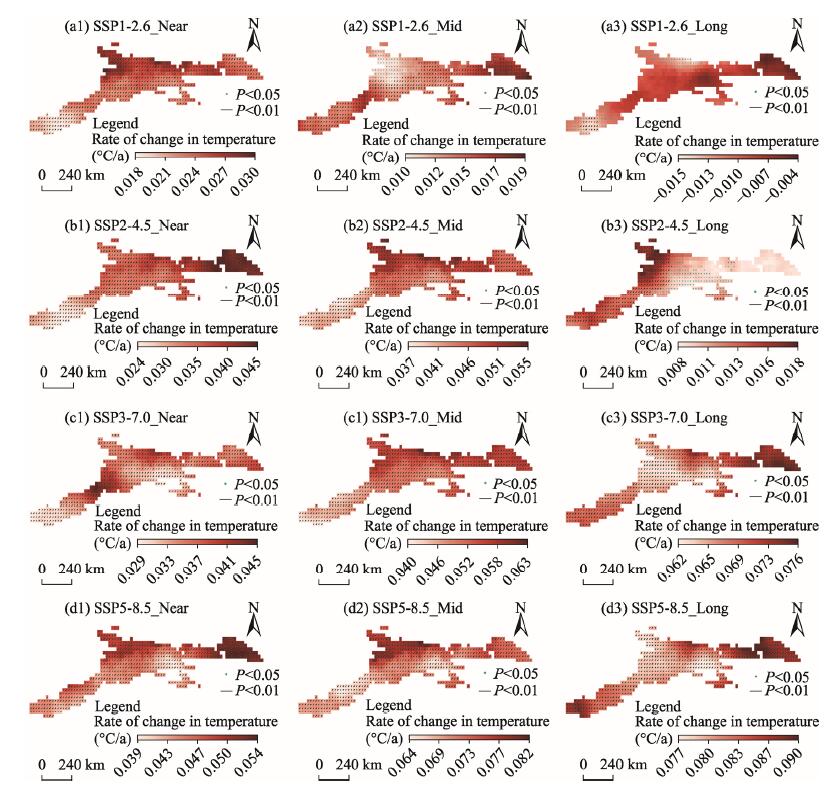
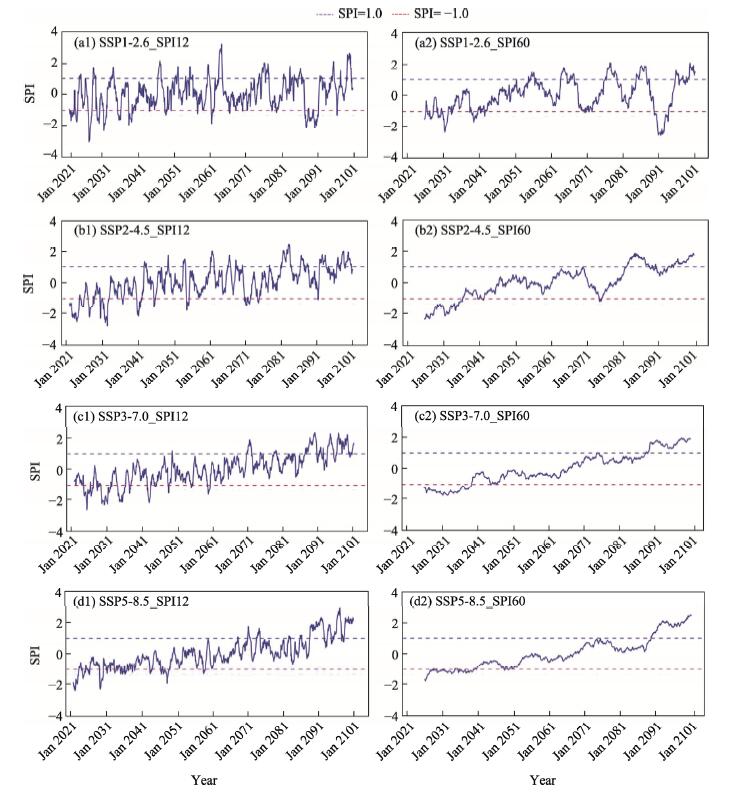
Abstract Climate warming profoundly affects hydrological changes, agricultural production, and human society. Arid and semi-arid areas of China are currently displaying a marked trend of warming and wetting. The Chinese Tianshan Mountains (CTM) have a high climate sensitivity, rendering the region particularly vulnerable to the effects of climate warming. In this study, we used monthly average temperature and monthly precipitation data from the CN05.1 gridded dataset (1961-2014) and 24 global climate models (GCMs) of the Coupled Model Intercomparison Project Phase 6 (CMIP6) to assess the applicability of the CMIP6 GCMs in the CTM at the regional scale. Based on this, we conducted a systematic review of the interannual trends, dry-wet transitions (based on the standardized precipitation index (SPI)), and spatial distribution patterns of climate change in the CTM during 1961-2014. We further projected future temperature and precipitation changes over three terms (near-term (2021-2040), mid-term (2041-2060), and long-term (2081-2100)) relative to the historical period (1961-2014) under four shared socio-economic pathway (SSP) scenarios (i.e., SSP1-2.6, SSP2-4.5, SSP3-7.0, and SSP5-8.5). It was found that the CTM had experienced significant warming and wetting from 1961 to 2014, and will also experience warming in the future (2021-2100). Substantial warming in 1997 was captured by both the CN05.1 derived from interpolating meteorological station data and the multi-model ensemble (MME) from the CMIP6 GCMs. The MME simulation results indicated an apparent wetting in 2008, which occurred later than the wetting observed from the CN05.1 in 1989. The GCMs generally underestimated spring temperature and overestimated both winter temperature and spring precipitation in the CTM. Warming and wetting are more rapid in the northern part of the CTM. By the end of the 21st century, all the four SSP scenarios project warmer and wetter conditions in the CTM with multiple dry-wet transitions. However, the rise in precipitation fails to counterbalance the drought induced by escalating temperature in the future, so the nature of the drought in the CTM will not change at all. Additionally, the projected summer precipitation shows negative correlation with the radiative forcing. This study holds practical implications for the awareness of climate change and subsequent research in the CTM.
|
|
Received: 31 August 2023
Published: 29 February 2024
|
|
Corresponding Authors:
*LI Xuemei (E-mail: lixuemei@mail.lzjtu.cn)
|
|
|
| [1] |
Aizizi Y, Kasimu A, Liang H W, et al. 2023. Evaluation of ecological quality status and changing trend in arid land based on the remote sensing ecological index: a case study in Xinjiang, China. Forests, 14(9): 1830, doi: 10.3390/f14091830.
|
|
|
| [2] |
Arora V K, Katavouta A, Williams R G, et al. 2020. Carbon-concentration and carbon-climate feedbacks in CMIP6 models and their comparison to CMIP5 models. Biogeosciences, 17(16): 4173-4222.
doi: 10.5194/bg-17-4173-2020
|
|
|
| [3] |
Charvet J, Liang S S, Laurent-Charvet S, et al. 2011. Palaeozoic tectonic evolution of the Tianshan belt, NW China. Science China Earth Sciences, 54(2): 166-184.
doi: 10.1007/s11430-010-4138-1
|
|
|
| [4] |
Chen F H, Xie T T, Yang Y J, et al. 2023. Discussion of the ''warming and wetting'' trend and its future variation in the drylands of Northwest China under global warming. Science China Earth Sciences, 66(6): 1241-1257.
doi: 10.1007/s11430-022-1098-x
|
|
|
| [5] |
Chen H P, Sun J Q, Lin W Q, et al. 2020. Comparison of CMIP6 and CMIP 5 models in simulating climate extremes. Science Bulletin, 65(17): 1415-1418.
doi: 10.1016/j.scib.2020.05.015
|
|
|
| [6] |
Chen X G, Li Y, Yao N, et al. 2022. Projected dry/wet regimes in China using SPEI under four SSP-RCPs based on statistically downscaled CMIP6 data. International Journal of Climatology, 42(16): 9357-9384.
doi: 10.1002/joc.v42.16
|
|
|
| [7] |
Chen Y L, Wang S S, Ren Z G, et al. 2019. Increased evapotranspiration from land cover changes intensified water crisis in an arid river basin in Northwest China. Journal of Hydrology, 574: 383-397.
doi: 10.1016/j.jhydrol.2019.04.045
|
|
|
| [8] |
Christensen J H, Krishna Kumar K, Aldrian E, et al. 2013. Climate phenomena and their relevance for future regional climate change. In: Stocker T F, Qin D, Plattner G K, et al. Climate Change 2013: The Physical Science Basis. Contribution of Working Group I to the Fifth Assessment Report of the Intergovernmental Panel on Climate Change. Cambridge: Cambridge University Press, 1217-1308.
|
|
|
| [9] |
Collins M, Chandler R E, Cox P M, et al. 2012. Quantifying future climate change. Nature Climate Change, 2(6): 403-409.
doi: 10.1038/nclimate1414
|
|
|
| [10] |
Deng H J, Chen Y N, Shi X, et al. 2014. Dynamics of temperature and precipitation extremes and their spatial variation in the arid region of Northwest China. Atmospheric Research, 138: 346-355.
doi: 10.1016/j.atmosres.2013.12.001
|
|
|
| [11] |
Dey P, Mishra A. 2017. Separating the impacts of climate change and human activities on streamflow: A review of methodologies and critical assumptions. Journal of Hydrology, 548: 278-290.
doi: 10.1016/j.jhydrol.2017.03.014
|
|
|
| [12] |
Dogan S, Berktay A, Singh V P. 2012. Comparison of multi-monthly rainfall-based drought severity indices, with application to semi-arid Konya closed basin, Turkey. Journal of Hydrology, 470-471: 255-268.
doi: 10.1016/j.jhydrol.2012.09.003
|
|
|
| [13] |
Du Y D, Wang J, Zhu D, et al. 2022. Comprehensive assessment of CMIP5 and CMIP 6 models in simulating and projecting precipitation over the global land. International Journal of Climatology, 42(13): 6859-6875.
doi: 10.1002/joc.v42.13
|
|
|
| [14] |
Ge S L, Jiang C, Wang J, et al. 2023. Analyzing temperature and precipitation extremes in China using multiple gridded datasets: A comparative evaluation. Weather and Climate Extremes, 42: 100614, doi: 10.1016/j.wace.2023.100614.
|
|
|
| [15] |
General Administration of Quality Supervision, Inspection and Quarantine of the People's Republic of China. 2017. Grades of Meteorological Drought (GB/T 20481-2017). Beijing: Standardization Administration of the People's Republic of China, (in Chinese)
|
|
|
| [16] |
Ghil M, Lucarini V. 2020. The physics of climate variability and climate change. Reviews of Modern Physics, 92(3): 035002, doi: 10.1103/RevModPhys.92.035002.
|
|
|
| [17] |
Greenwood M S. 2022. Geometry and the cause of the seasons: the changing hours of daylight and elevation angle of the sun at noon. The Physics Teacher, 60(8): 694-698.
doi: 10.1119/5.0038965
|
|
|
| [18] |
Hawkins E, Sutton R. 2011. The potential to narrow uncertainty in projections of regional precipitation change. Climate Dynamics, 37(1): 407-418.
doi: 10.1007/s00382-010-0810-6
|
|
|
| [19] |
Hu Y Y, Xu Y, Li J, et al. 2021. Evaluation on the performance of CMIP 6 global climate models with different horizontal resolution in simulating the precipitation over China. Climate Change Research, 17(6): 730-743. (in Chinese)
|
|
|
| [20] |
Javadinejad S, Dara R, Jafary F. 2020. Climate change scenarios and effects on snow-melt runoff. Civil Engineering Journal, 6(9): 1715-1725.
doi: 10.28991/cej-2020-03091577
|
|
|
| [21] |
Jiang D, Hu D, Tian Z P, et al. 2020. Differences between CMIP6 and CMIP 5 models in simulating climate over China and the East Asian monsoon. Advances in Atmospheric Sciences, 37(10): 1102-1118.
doi: 10.1007/s00376-020-2034-y
|
|
|
| [22] |
Jiang D B, Tian Z P, Lang X M. 2016. Reliability of climate models for China through the IPCC Third to Fifth Assessment Reports. International Journal of Climatology, 36(3): 1114-1133.
doi: 10.1002/joc.2016.36.issue-3
|
|
|
| [23] |
Jiang L W, O'Neill B C. 2017. Global urbanization projections for the Shared Socioeconomic Pathways. Global Environmental Change, 42: 193-199.
doi: 10.1016/j.gloenvcha.2015.03.008
|
|
|
| [24] |
Jiang T L, Su X L, Singh V P, et al. 2022. Spatio-temporal pattern of ecological droughts and their impacts on health of vegetation in Northwestern China. Journal of Environmental Management, 305: 114356, doi: 10.1016/j.jenvman.2021.114356.
|
|
|
| [25] |
Kc S, Lutz W. 2017. The human core of the shared socioeconomic pathways: Population scenarios by age, sex and level of education for all countries to 2100. Global Environmental Change, 42: 181-192.
doi: 10.1016/j.gloenvcha.2014.06.004
|
|
|
| [26] |
Kendall M G, Stuart A. 1979. The Advanced Theory of Statistics (2nd ed.). London: Charles Griffin and Co., Ltd.
|
|
|
| [27] |
Kharin V V, Zwiers F W, Zhang X B, et al. 2013. Changes in temperature and precipitation extremes in the CMIP5 ensemble. Climate Change, 119: 345-357.
|
|
|
| [28] |
Kim W Y, Jang M, Ko Y G, et al. 2018. Long-term trend assessment in environmental radioactivity around nuclear facilities in Daedeok site. 17-18 May, 2018. Transactions of the Korean Nuclear Society Spring Meeting. Jeju, Korea.
|
|
|
| [29] |
Kim Y H, Min S K, Zhang X, et al. 2020. Evaluation of the CMIP 6 multi-model ensemble for climate extreme indices. Weather and Climate Extremes, 29: 100269, doi: 10.1016/j.wace.2020.100269.
|
|
|
| [30] |
Knutti R. 2008. Should we believe model predictions of future climate change? Philosophical Transactions of the Royal Society A: Mathematical, Physical and Engineering Sciences, 366(1885): 4647-4664.
|
|
|
| [31] |
Kundzewicz Z W, Krysanova V, Benestad R E, et al. 2018. Uncertainty in climate change impacts on water resources. Environmental Science & Policy, 79: 1-8.
|
|
|
| [32] |
Lafon T, Dadson S, Buys G, et al. 2013. Bias correction of daily precipitation simulated by a regional climate model: A comparison of methods. International Journal of Climatology, 33(6): 1367-1381.
doi: 10.1002/joc.v33.6
|
|
|
| [33] |
Lei X N, Xu C C, Liu F, et al. 2023. Evaluation of CMIP 6 models and multi-model ensemble for extreme precipitation over arid Central Asia. Remote Sensing, 15(9): 2376, doi: 10.3390/rs15092376.
|
|
|
| [34] |
Li B F, Chen Y N, Chen Z S, et al. 2012. Trends in runoff versus climate change in typical rivers in the arid region of northwest China. Quaternary International, 282: 87-95.
doi: 10.1016/j.quaint.2012.06.005
|
|
|
| [35] |
Li F R, Liu J L, Ren W, et al. 2018. Land-use change alters patterns of soil biodiversity in arid lands of northwestern China. Plant and Soil, 428(1): 371-388.
doi: 10.1007/s11104-018-3673-y
|
|
|
| [36] |
Li H, Hou E, Deng J W. 2022a. Spatio-temporal differentiation characteristic and evolution process of meteorological drought in Northwest China from 1960 to 2018. Frontiers in Earth Science, 10: 857953, doi: 10.3389/feart.2022.857953.
|
|
|
| [37] |
Li H B, Sheffield J, Wood E F. 2010. Bias correction of monthly precipitation and temperature fields from Intergovernmental Panel on Climate Change AR4 models using equidistant quantile matching. Journal of Geophysical Research: Atmosphere, 115(D10): D10101, doi: 10.1029/2009JD012882.
|
|
|
| [38] |
Li X M, Gao P, Li Q, et al. 2016. Muti-paths impact from climate change on snow cover in Tianshan mountainous area of China. Climate Change Research, 12(4): 303-312. (in Chinese)
|
|
|
| [39] |
Li X M, Simonovic S P, Li L H, et al. 2020. Performance and uncertainty analysis of a short-term climate reconstruction based on multi-source data in the Tianshan Mountains region, China. Journal of Arid Land, 12(3): 374-396.
doi: 10.1007/s40333-020-0065-y
|
|
|
| [40] |
Li X M, Liu X Y, Zhao K X, et al. 2023. Change in the potential snowfall phenology: past, present, and future in the Chinese Tianshan mountainous region, Central Asia. The Cryosphere, 17(6): 2437-2453.
doi: 10.5194/tc-17-2437-2023
|
|
|
| [41] |
Li X Q, He X X, Li X L, et al. 2022b. Spatiotemporal evaluation and estimation of precipitation of multi-source precipitation products in arid areas of northwest China—a case study of Tianshan Mountains. Water, 14(16): 2566, doi: 10.3390/w14162566.
|
|
|
| [42] |
Liu F, Qin T L, Yan D H, et al. 2020. Classification of instream ecological water demand and crucial values in a semi-arid river basin. Science of the Total Environment, 712: 136409, doi: 10.1016/j.scitotenv.2019.136409.
|
|
|
| [43] |
Luo M, Liu T, Meng F H, et al. 2019. Identifying climate change impacts on water resources in Xinjiang, China. Science of the Total Environment, 676: 613-626.
doi: 10.1016/j.scitotenv.2019.04.297
|
|
|
| [44] |
Mathew M. 2022. Nuclear energy: A pathway towards mitigation of global warming. Progress in Nuclear Energy, 143: 104080, doi: 10.1016/j.pnucene.2021.104080.
|
|
|
| [45] |
McKee T, Doesken N, Kleist J. 1993. The relationship of drought frequency and duration to time scales. Eighth Conference on Applied Climatology, 17(22): 179-183.
|
|
|
| [46] |
Muhtar M N, Wu C Z, Brzozowski M J, et al. 2022. Timing and spatial variation of deformation along the Kanggur-Huangshan shear zone in the Chinese Tianshan: Implications for regional differential uplift and mineralization. GSA Bulletin, 135(5-6): 1429-1442.
|
|
|
| [47] |
O'Neill B C, Tebaldi C, Vuuren D, et al. 2016. The Scenario Model Intercomparison Project (ScenarioMIP) for CMIP6. Geoscientific Model Development, 9(9): 3461-3482.
doi: 10.5194/gmd-9-3461-2016
|
|
|
| [48] |
Pi Y Y, Yu Y, Zhang Y, et al. 2020. Extreme temperature events during 1960-2017 in the arid region of Northwest China: spatiotemporal dynamics and associated large-scale atmospheric circulation. Sustainability, 12(3): 1198, doi: 10.3390/su12031198.
|
|
|
| [49] |
Qin J C, Su B D, Wang Y J, et al. 2021. Projection of temperature and precipitation under SSPs-RCPs scenarios over northwest China. Frontiers of Earth Science, 15: 23-37.
doi: 10.1007/s11707-020-0847-8
|
|
|
| [50] |
Randall D A, Wood R A, Bony S, et al. 2007. Climate models and their evaluation. In: Solomon S, Qin D, Manning M, et al. Climate Change 2007: The Physical Science Basis. Contribution of Working Group I to the Fourth Assessment Report of the IPCC (FAR). Cambridge: Cambridge University Press, 589-662.
|
|
|
| [51] |
Salehnia N, Alizadeh A, Sanaeinejad H, et al. 2017. Estimation of meteorological drought indices based on AgMERRA precipitation data and station-observed precipitation data. Journal of Arid Land, 9(6): 797-809.
doi: 10.1007/s40333-017-0070-y
|
|
|
| [52] |
Salehnia N, Ahn J. 2022. Modelling and reconstructing tree ring growth index with climate variables through artificial intelligence and statistical methods. Ecological Indicators, 134: 108496, doi: 10.1016/j.ecolind.2021.108496.
|
|
|
| [53] |
Schaller N, Mahlstein I, Cermak J, et al. 2011. Analyzing precipitation projections: A comparison of different approaches to climate model evaluation. Journal of Geophysical Research: Atmospheres, 116(D10): D10118, doi: 10.1029/2010JD014963.
|
|
|
| [54] |
Scherrer S C. 2011. Present-day interannual variability of surface climate in CMIP 3 models and its relation to future warming. International Journal of Climatology, 31(10): 1518-1529.
doi: 10.1002/joc.v31.10
|
|
|
| [55] |
Shen Y J, Shen Y J, Guo Y, et al. 2020. Review of historical and projected future climatic and hydrological changes in mountainous semiarid Xinjiang (northwestern China), Central Asia. Catena, 187: 104343, doi: 10.1016/j.catena.2019.104343.
|
|
|
| [56] |
Shi L, Halik Ü, Mamat Z, et al. 2020. Spatio-temporal variation of ecosystem services value in the Northern Tianshan Mountain Economic zone from 1980 to 2030. PeerJ, 8: e9582, doi: 10.7717/peerj.9582.
|
|
|
| [57] |
Shi Y F, Shen Y P, Kang E, et al. 2007. Recent and future climate change in Northwest China. Climate Change, 80(3): 379-393.
|
|
|
| [58] |
Sun X T, Ding Q H, Wang S, et al. 2022a. Enhanced jet stream waviness induced by suppressed tropical Pacific convection during boreal summer. Nature Communications, 13(1): 1288, doi: 10.1038/s41467-022-28911-7.
|
|
|
| [59] |
Sun Y, Zhang X B, Ding Y H, et al. 2022b. Understanding human influence on climate change in China. National Science Review, 9(3): nwab113, doi: 10.1093/nsr/nwab113.
|
|
|
| [60] |
Tang Q H, Liu X C, Zhou Y Y, et al. 2022. Climate change and water security in the northern slope of the Tianshan Mountains. Geography and Sustainability, 3(3): 246-257.
doi: 10.1016/j.geosus.2022.08.004
|
|
|
| [61] |
Tang X L, Lv X, He Y. 2013. Features of climate change and their effects on glacier snow melting in Xinjiang, China. Comptes Rendus Geoscience, 345(2): 93-100.
|
|
|
| [62] |
Taylor K E. 2001. Summarizing multiple aspects of model performance in a single diagram. Journal of Geophysical Research: Atmospheres, 106(D7): 7183-7192.
doi: 10.1029/2000JD900719
|
|
|
| [63] |
Tebaldi C, Knutti R. 2007. The use of the multi-model ensemble in probabilistic climate projections. Philosophical Transactions of the Royal Society A: Mathematical, Physical and Engineering Sciences, 365(1857): 2053-2075.
doi: 10.1098/rsta.2007.2076
|
|
|
| [64] |
Tian J X, Zhang Z X, Ahmed Z S, et al. 2021. Projections of precipitation over China based on CMIP 6 models. Stochastic Environmental Research and Risk Assessment, 35: 831-848.
doi: 10.1007/s00477-020-01948-0
|
|
|
| [65] |
Tokarska K B, Stolpe M B, Sippel S, et al. 2020. Past warming trend constrains future warming in CMIP6 models. Science Advances, 6(12): 14, doi: 10.1126/sciadv.aaz9549.
|
|
|
| [66] |
Tu J Q, Lu E. 2021. Understanding the uncertainty of the long-term precipitation trend under global warming through the water cycle. International Journal of Climatology, 42(8): 4273-4288.
doi: 10.1002/joc.v42.8
|
|
|
| [67] |
Visser H, Folkert R J M, Hoekstra J, et al. 2000. Identifying key sources of uncertainty in climate change projections. Climatic Change, 45(3-4): 421-457.
doi: 10.1023/A:1005516020996
|
|
|
| [68] |
Wang C, Li J, Li X, et al. 2012. Analysis on quasi-periodic characteristics of precipitation in recent 50 years and trend in next 20 years in China. Arid Zone Research, 29(1): 1-10. (in Chinese)
|
|
|
| [69] |
Wang L, Chen W. 2014. Equiratio cumulative distribution function matching as an improvement to the equidistant approach in bias correction of precipitation. Atmospheric Science Letters, 15(1): 1-6.
doi: 10.1002/asl2.2014.15.issue-1
|
|
|
| [70] |
Wang Q, Zhai P M, Qin D H. 2020. New perspectives on 'warming-wetting' trend in Xinjiang, China. Advances in Climate Change Research, 11(3): 252-260.
doi: 10.1016/j.accre.2020.09.004
|
|
|
| [71] |
Wang S J, Zhang M J, Li Z Q, et al. 2011. Glacier area variation and climate change in the Chinese Tianshan Mountains since 1960. Journal of Geographical Sciences, 21(2): 263-273.
doi: 10.1007/s11442-011-0843-8
|
|
|
| [72] |
Wang Y J, Qin D H. 2017. Influence of climate change and human activity on water resources in arid region of Northwest China: An overview. Advances in Climate Change Research, 8(4): 268-278.
doi: 10.1016/j.accre.2017.08.004
|
|
|
| [73] |
Weigel A P, Liniger M A, Appenzeller C. 2008. Can multi-model combination really enhance the prediction skill of probabilistic ensemble forecasts? Quarterly Journal of the Royal Meteorological Society, 134(630): 241-260.
doi: 10.1002/qj.v134:630
|
|
|
| [74] |
WMO (World Meteorological Organization). 2006. Drought Monitoring and Early Warning: Concepts, Progress and Future Challenges. Geneva: WMO.
|
|
|
| [75] |
Wu J, Gao X J. 2013. A gridded daily observation dataset over China region and comparison with the other datasets. Chinese Journal of Geophysics, 56(4): 1102-1111. (in Chinese)
|
|
|
| [76] |
Xiang J, Zhang L, Deng Y, et al. 2021. Projection and evaluation if extreme temperature and precipitation in major regions of China by CMIP6 models. Engineering Journal of Wuhan University, 54(1): 46-57, 81. (in Chinese)
|
|
|
| [77] |
Xu J H, Chen Y N, Li W H, et al. 2016. Understanding temporal and spatial complexity of precipitation distribution in Xinjiang, China. Theoretical and Applied Climatology, 123: 321-333.
doi: 10.1007/s00704-014-1364-z
|
|
|
| [78] |
Xu L, Zheng C L, Ma Y. 2021. Variations in precipitation extremes in the arid and semi-arid regions of China. International Journal of Climatology, 41(3): 1542-1554.
doi: 10.1002/joc.v41.3
|
|
|
| [79] |
Xu L L, Wang A H. 2019. Application of the bias correction and spatial downscaling algorithm on the temperature extremes from CMIP 5 multimodel ensembles in China. Earth and Space Science, 6(12): 2508-2524.
doi: 10.1029/2019EA000995
|
|
|
| [80] |
Xu Y, Gao X, Shen Y, et al. 2009. A daily temperature dataset over China and its application in validating a RCM simulation. Advances in Atmospheric Sciences, 26(4): 763-772.
doi: 10.1007/s00376-009-9029-z
|
|
|
| [81] |
Yang F, Lu H, Yang K, et al. 2017a. Evaluation of multiple forcing data sets for precipitation and shortwave radiation over major land areas of China. Hydrology and Earth System Sciences, 21(11): 5805-5821.
doi: 10.5194/hess-21-5805-2017
|
|
|
| [82] |
Yang P, Xia J, Zhang Y Y, et al. 2017b. Temporal and spatial variations of precipitation in Northwest China during 1960-2013. Atmospheric Research, 183: 283-295.
doi: 10.1016/j.atmosres.2016.09.014
|
|
|
| [83] |
Yang X L, Zhou B T, Xu Y, et al. 2021. CMIP 6 evaluation and projection of temperature and precipitation over China. Advances in Atmospheric Sciences, 38(5): 817-830.
doi: 10.1007/s00376-021-0351-4
|
|
|
| [84] |
Yang X Y, Li D W, Yang Z, et al. 2023. Revealing historical observations and future projections of precipitation over Northwest China based on dynamic downscaled CMIP6 simulations. Frontiers in Earth Science, 10: 1090221, doi: 10.3389/feart.2022.1090221.
|
|
|
| [85] |
Yao J Q, Chen Y N, Guan X F, et al. 2022. Recent climate and hydrological changes in a mountain-basin system in Xinjiang, China. Earth-Science Reviews, 226: 103957, doi: 10.1016/j.earscirev.2022.103957.
|
|
|
| [86] |
Yu X, Lei J Q, Gao X. 2022. An over review of desertification in Xinjiang, Northwest China. Journal of Arid Land, 14(11): 1181-1195.
doi: 10.1007/s40333-022-0077-x
|
|
|
| [87] |
Yu Y, Pi Y Y, Yu X, et al. 2019. Climate change, water resources and sustainable development in the arid and semi-arid lands of Central Asia in the past 30 years. Journal of Arid Land, 11(1): 1-14.
doi: 10.1007/s40333-018-0073-3
|
|
|
| [88] |
Zarrin A, Dadashi-Roudbari A. 2021. Projection of future extreme precipitation in Iran based on CMIP6 multi-model ensemble. Theoretical and Applied Climatology, 144: 643-660.
doi: 10.1007/s00704-021-03568-2
|
|
|
| [89] |
Zhang Q, Sun P, Li J F, et al. 2014. Spatiotemporal properties of droughts and related impacts on agriculture in Xinjiang, China. International Journal of Climatology, 35(7): 1254-1266.
doi: 10.1002/joc.2015.35.issue-7
|
|
|
| [90] |
Zhang Q, Zhu B, Yang J, et al. 2021a. New characteristics about the climate humidification trend in Northwest China. Chinese Science Bulletin, 66(28-29): 3757-3771. (in Chinese)
|
|
|
| [91] |
Zhang W X, Furtado K, Wu P L, et al. 2021b. Increasing precipitation variability on daily-to-multiyear time scales in a warmer world. Science Advances, 7(31): eabf8021, doi: 10.1126/sciadv.abf8021.
|
|
|
| [92] |
Zheng C L, Wang Q. 2014. Spatiotemporal variations of reference evapotranspiration in recent five decades in the arid land of northwestern China. Hydrological Processes, 28(25): 6124-6134.
doi: 10.1002/hyp.v28.25
|
|
|
| [93] |
Zhou T J, Chen Z M, Chen X L, et al. 2021. Interpreting IPCC AR6: future global climate based on projection under scenarios and on near-term information. Climate Change Research, 17(6): 652-663. (in Chinese)
|
|
|
| [94] |
Zhu B, Xue L Q, Wei G H, et al. 2019. CMIP 5 projected changes in temperature and precipitation in arid and humid basins. Theoretical and Applied Climatology, 136(3): 1133-1144.
doi: 10.1007/s00704-018-2542-1
|
|
|
| [95] |
Zhu H H, Jiang Z H, Li L. 2021. Projection of climate extremes in China, an incremental exercise from CMIP 5 to CMIP6. Science Bulletin, 66(24): 2528-2537.
doi: 10.1016/j.scib.2021.07.026
|
|
|
|
Viewed |
|
|
|
Full text
|
|
|
|
|
Abstract
|
|
|
|
|
Cited |
|
|
|
|
| |
Shared |
|
|
|
|
| |
Discussed |
|
|
|
|