| Research article |
|

|
|
|
| Impact of urban sprawl on land surface temperature in the Mashhad City, Iran: A deep learning and cloud- based remote sensing analysis |
Komeh ZINAT1, Hamzeh SAEID1, Memarian HADI2, Attarchi SARA1, LU Linlin3,4, Naboureh AMIN5,6, Alavipanah KAZEM SEYED1,*( ) ) |
1Department of Remote Sensing and GIS (Geographic Information System), University of Tehran, Tehran 14178-53933, Iran
2Department of Watershed Management, University of Birjand, Birjand 97174-34765, Iran
3Key Laboratory of Digital Earth Science, Aerospace Information Research Institute, Chinese Academy of Sciences, Beijing 100094, China
4International Research Center of Big Data for Sustainable Development Goals, Beijing 100094, China
5Research Center for Digital Mountain and Remote Sensing Application, Institute of Mountain Hazards and Environment, Chinese Academy of Sciences, Chengdu 610041, China
6University of Chinese Academy of Sciences, Beijing 100049, China |
|
|
|
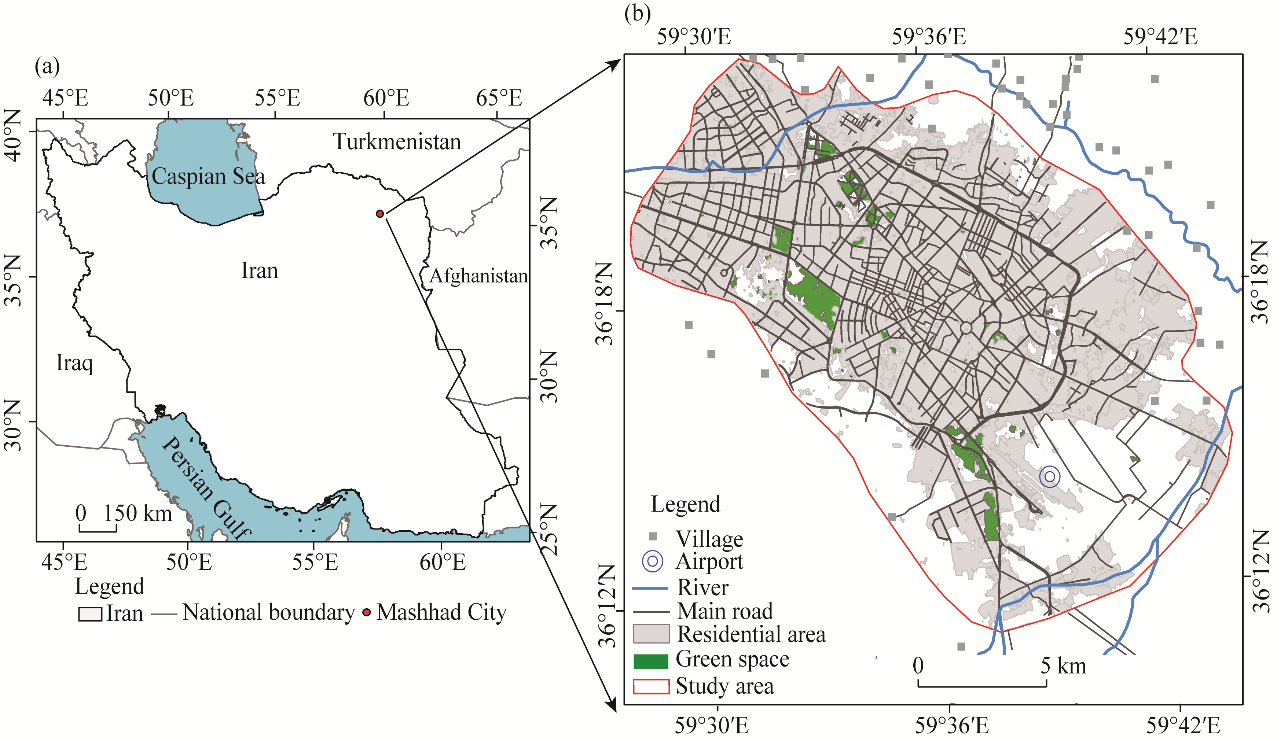
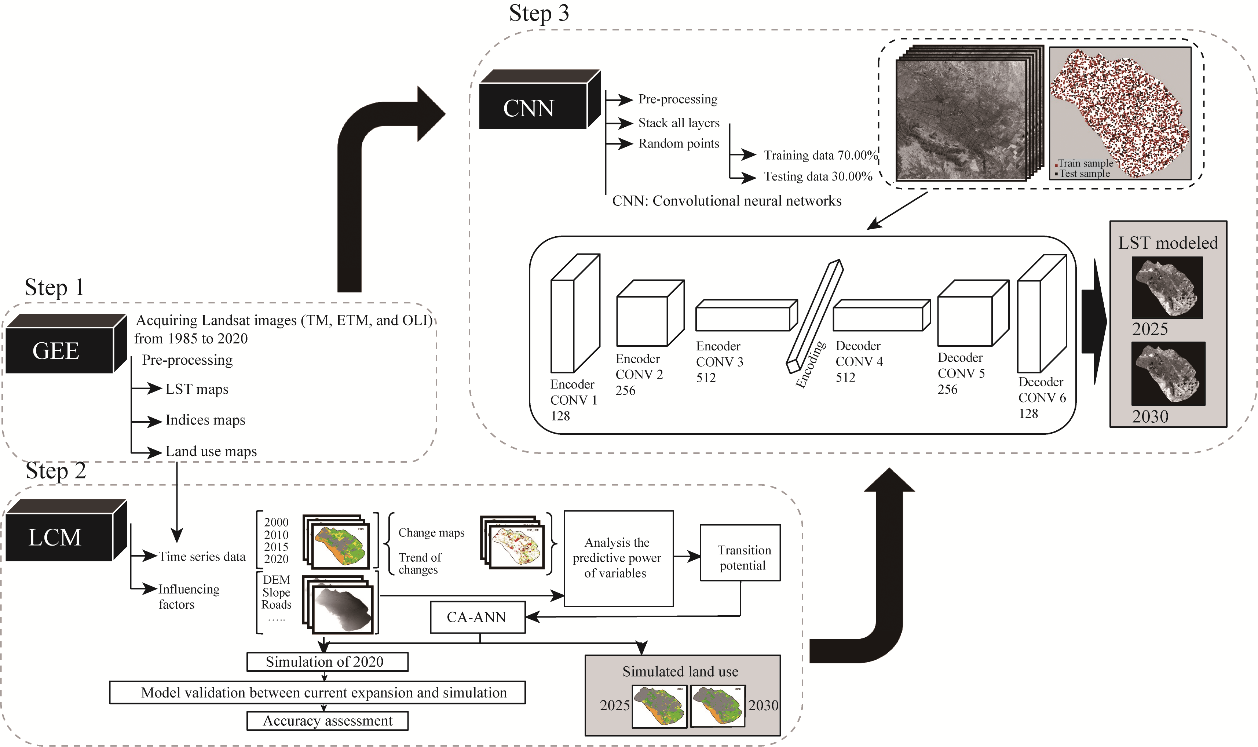
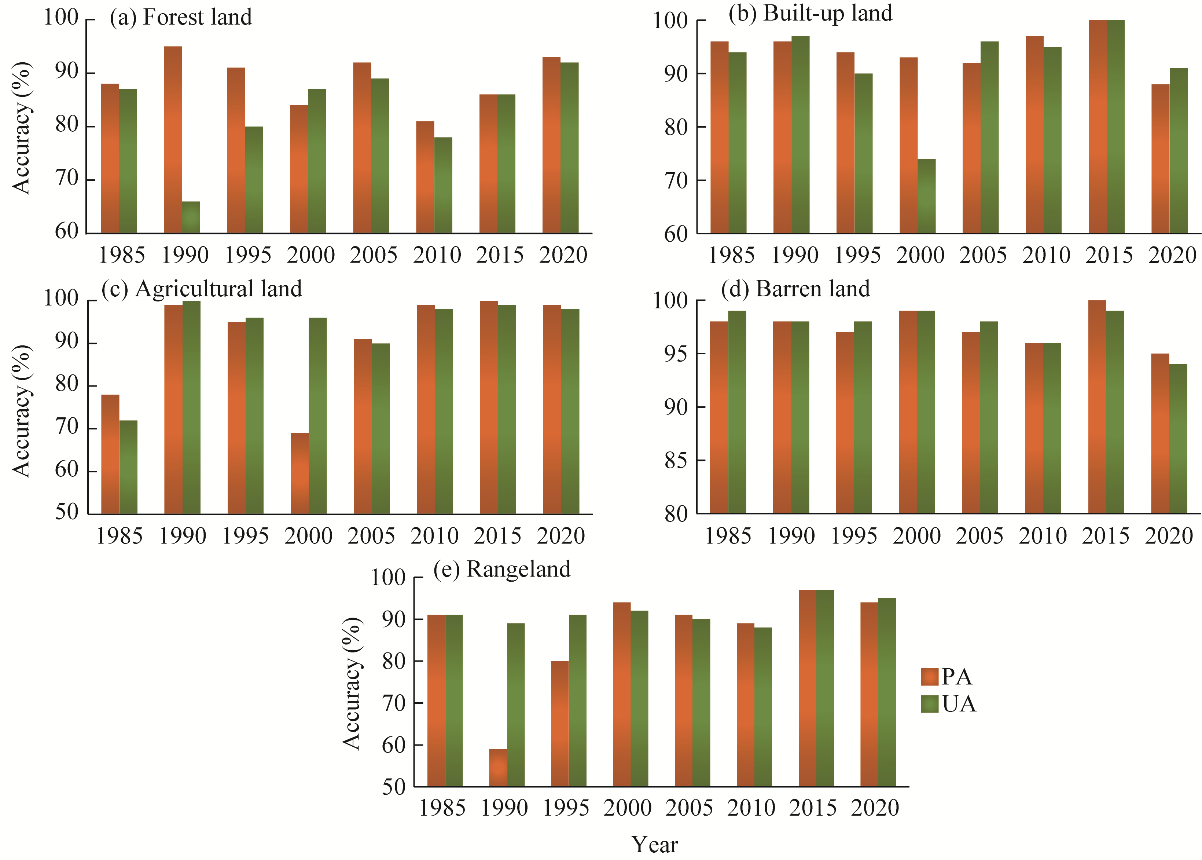
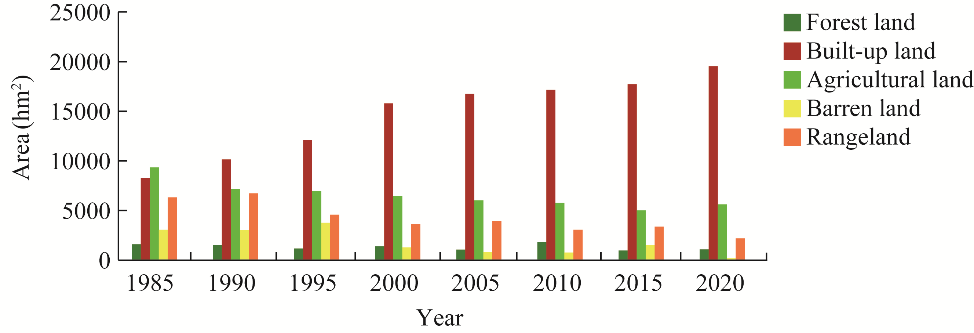
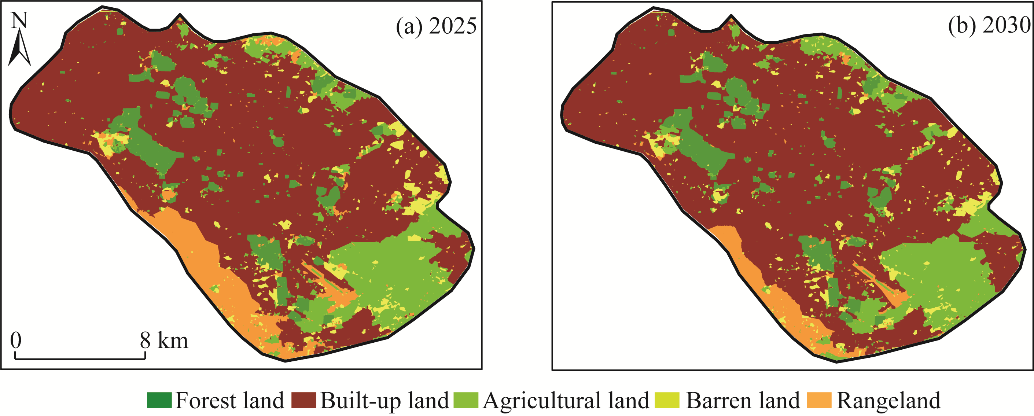
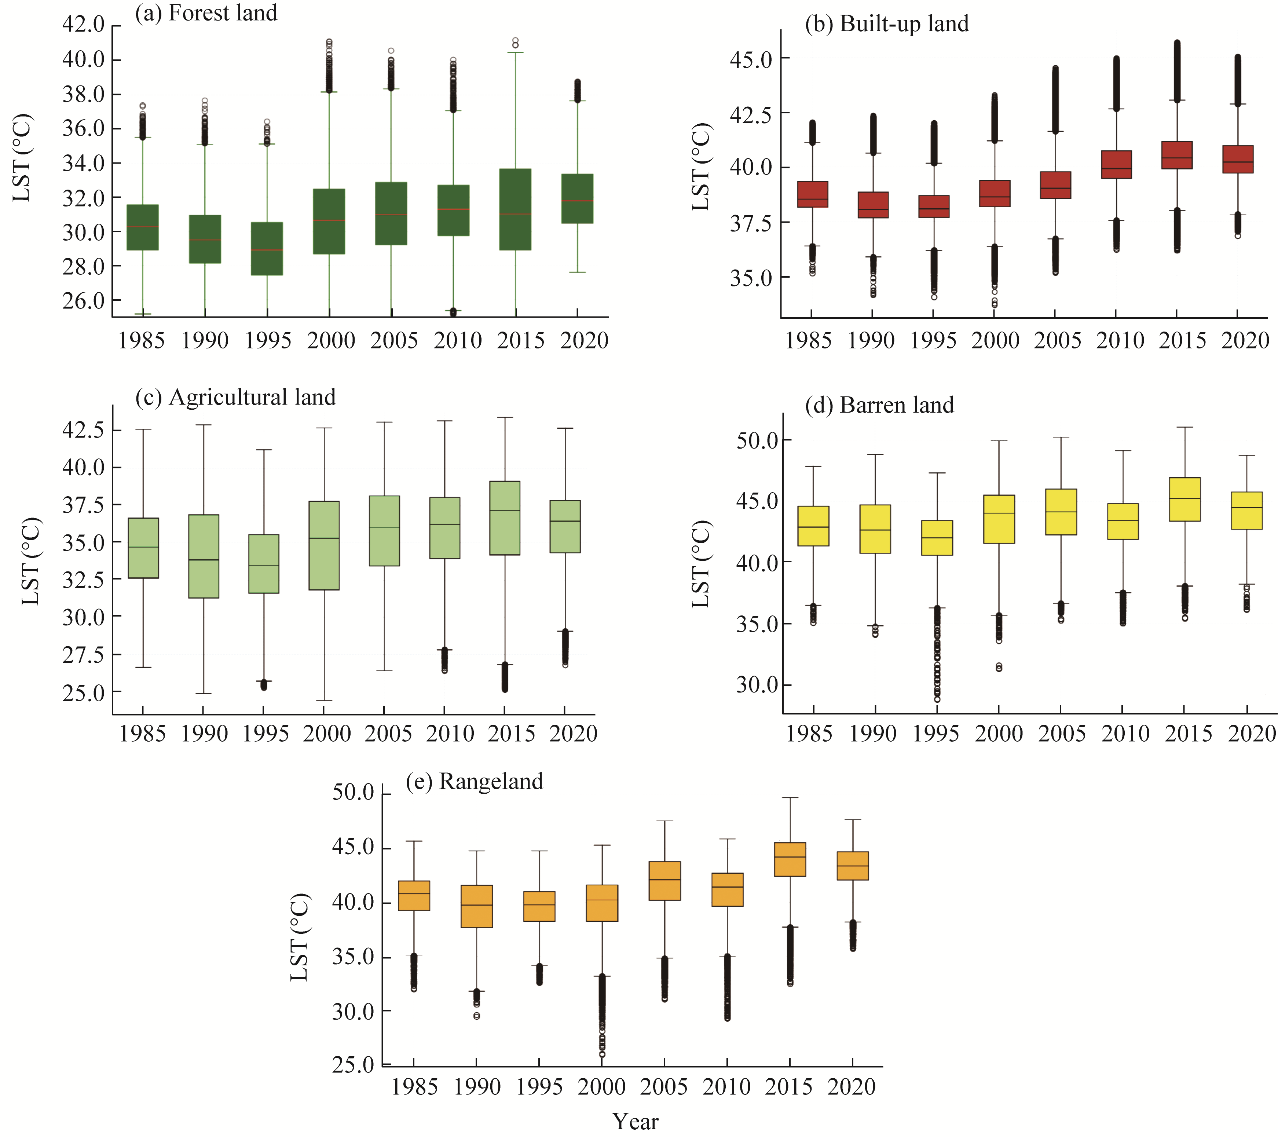
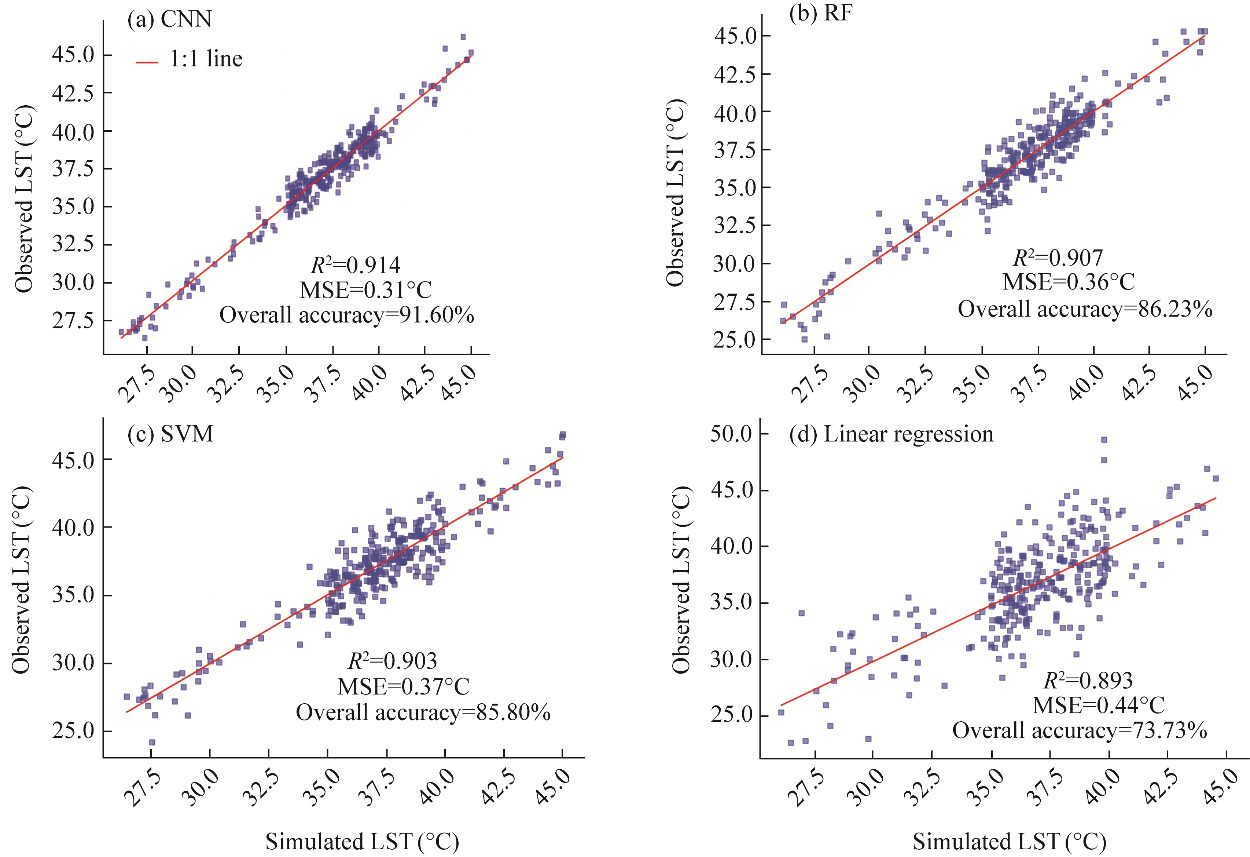
Abstract The evolution of land use patterns and the emergence of urban heat islands (UHI) over time are critical issues in city development strategies. This study aims to establish a model that maps the correlation between changes in land use and land surface temperature (LST) in the Mashhad City, northeastern Iran. Employing the Google Earth Engine (GEE) platform, we calculated the LST and extracted land use maps from 1985 to 2020. The convolutional neural network (CNN) approach was utilized to deeply explore the relationship between the LST and land use. The obtained results were compared with the standard machine learning (ML) methods such as support vector machine (SVM), random forest (RF), and linear regression. The results revealed a 1.00°C-2.00°C increase in the LST across various land use categories. This variation in temperature increases across different land use types suggested that, in addition to global warming and climatic changes, temperature rise was strongly influenced by land use changes. The LST surge in built-up lands in the Mashhad City was estimated to be 1.75°C, while forest lands experienced the smallest increase of 1.19°C. The developed CNN demonstrated an overall prediction accuracy of 91.60%, significantly outperforming linear regression and standard ML methods, due to the ability to extract higher level features. Furthermore, the deep neural network (DNN) modeling indicated that the urban lands, comprising 69.57% and 71.34% of the studied area, were projected to experience extreme temperatures above 41.00°C and 42.00°C in the years 2025 and 2030, respectively. In conclusion, the LST predictioin framework, combining the GEE platform and CNN method, provided an effective approach to inform urban planning and to mitigate the impacts of UHI.
|
|
Received: 19 September 2024
Published: 31 March 2025
|
|
Corresponding Authors:
*Alavipanah KAZEM SEYED (E-mail: salavipa@ut.ac.ir)
|
|
|
| [1] |
Abutaleb K, Ngie A, Darwish A, et al. 2015. Assessment of urban heat island using remotely sensed imagery over Greater Cairo, Egypt. Advances in Remote Sensing, 4(1): 35-47.
|
|
|
| [2] |
Adam E, Mutanga O, Odindi J, et al. 2014. Land-use/cover classification in a heterogeneous coastal landscape using RapidEye imagery: Evaluating the performance of random forest and support vector machines classifiers. International Journal of Remote Sensing, 35(10): 3440-3458.
|
|
|
| [3] |
Agarwal S, Vailshery L S, Jaganmohan M, et al. 2013. Mapping urban tree species using very high resolution satellite imagery: Comparing pixel-based and object-based approaches. ISPRS International Journal of Geo-Information, 2(1): 220-236.
|
|
|
| [4] |
Alademomi A S, Okolie C J, Daramola O E, et al. 2022. The interrelationship between LST, NDVI, NDBI, and land cover change in a section of Lagos metropolis, Nigeria. Applied Geomatics, 14(2): 299-314.
|
|
|
| [5] |
Alavipanah S K, Darrehbadami S H, Kazemzadeh A. 2014. Spatial-temporal analysis of urban heat-island of Mashhad City due to land use/cover changes and expansion. Geographical Urban Planning Research, 3(1): 1-17. (in Persian)
|
|
|
| [6] |
Alavipanah S K, Mansourmoghaddam M, Gomeh Z, et al. 2022. The reciprocal effect of global warming and climatic change (new perspective): A review. Desert, 27(2): 291-305.
|
|
|
| [7] |
Amiri R, Weng Q H, Alimohammadi A, et al. 2009. Spatial-temporal dynamics of land surface temperature in relation to fractional vegetation cover and land use/cover in the Tabriz urban area, Iran. Remote Sensing of Environment, 113(12): 2606-2617.
|
|
|
| [8] |
Arekhi M, Goksel C, Balik Sanli F, et al. 2019. Comparative evaluation of the spectral and spatial consistency of Sentinel-2 and Landsat-8 OLI data for Igneada longos forest. ISPRS International Journal of Geo-Information, 8(2): 56, doi: 10.3390/ijgi8020056.
|
|
|
| [9] |
Aslan N, Koc-San D. 2023. The effects of land cover changes on land surface temperatures. The International Archives of the Photogrammetry, Remote Sensing and Spatial Information Sciences, 48: 1311-1318.
|
|
|
| [10] |
Axelsson C, Skidmore A K, Schlerf M, et al. 2013. Hyperspectral analysis of mangrove foliar chemistry using PLSR and support vector regression. International Journal of Remote Sensing, 34(5): 1724-1743.
|
|
|
| [11] |
Boulze H, Korosov A, Brajard J. 2020. Classification of sea ice types in Sentinel-1 SAR data using convolutional neural networks. Remote Sensing, 12(13): 2165, doi: 10.3390/rs12132165.
|
|
|
| [12] |
Breiman L. 2001. Random forests. Machine Learning, 45: 5-32.
|
|
|
| [13] |
Camps-Valls G, Gómez-Chova L, Muñoz-Marí J, et al. 2006. Retrieval of oceanic chlorophyll concentration with relevance vector machines. Remote Sensing of Environment, 105(1): 23-33.
|
|
|
| [14] |
Carranza-García M, García-Gutiérrez J, Riquelme J C. 2019. A framework for evaluating land use and land cover classification using convolutional neural networks. Remote Sensing, 11(3): 274, doi: 10.3390/rs11030274.
|
|
|
| [15] |
Chen X L, Zhao H M, Li P X, et al. 2006. Remote sensing image-based analysis of the relationship between urban heat island and land use/cover changes. Remote Sensing of Environment, 104(2): 133-146.
|
|
|
| [16] |
Christensen M, Jokar Arsanjani J. 2020. Stimulating implementation of sustainable development goals and conservation action: Predicting future land use/cover change in Virunga National Park, Congo. Sustainability, 12(4): 1570, doi: 10.3390/su12041570.
|
|
|
| [17] |
Du H Q, Mao F J, Zhou G M, et al. 2018. Estimating and analyzing the spatiotemporal pattern of aboveground carbon in bamboo forest by combining remote sensing data and improved biome-bgc model. IEEE Journal of Selected Topics in Applied Earth Observations and Remote Sensing, 11(7): 2282-2295.
|
|
|
| [18] |
Eastman J R. 2009. IDRISI Taiga Guide to GIS and Image Processing. Worcester: Clark University.
|
|
|
| [19] |
Essa W, Verbeiren B, van der Kwast J, et al. 2012. Evaluation of the DisTrad thermal sharpening methodology for urban areas. International Journal of Applied Earth Observation and Geoinformation, 19: 163-172.
|
|
|
| [20] |
Fang Z C, Wang Y, Peng L, et al. 2020. Integration of convolutional neural network and conventional machine learning classifiers for landslide susceptibility mapping. Computers & Geosciences, 139: 104470, doi: 10.1016/j.cageo.2020.104470.
|
|
|
| [21] |
Feng Y J, Gao C, Tong X H, et al. 2019. Spatial patterns of land surface temperature and their influencing factors: A case study in Suzhou, China. Remote Sensing, 11(2): 182, doi: 10.3390/rs11020182.
|
|
|
| [22] |
Fu P, Weng Q H. 2018. Responses of urban heat island in Atlanta to different land-use scenarios. Theoretical and Applied Climatology, 133: 123-135.
|
|
|
| [23] |
Gascon M, Cirach M, Martínez D, et al. 2016. Normalized difference vegetation index (NDVI) as a marker of surrounding greenness in epidemiological studies: The case of Barcelona city. Urban Forestry & Urban Greening, 19: 88-94.
|
|
|
| [24] |
Gharbia R, Khalifa N E M, Hassanien A E. 2020. Land cover classification using deep convolutional neural networks. In: Abraham A, Piuri V, Gandhi N, et al. Advances in Intelligent Systems and Computing. Switzerland: Springer, 911-920.
|
|
|
| [25] |
Grimmond S. 2007. Urbanization and global environmental change: local effects of urban warming. The Geographical Journal, 173(1): 83-88.
|
|
|
| [26] |
Guha S, Govil H, Gill N, et al. 2020. Analytical study on the relationship between land surface temperature and land use/land cover indices. Annals of GIS, 26(2): 201-216.
|
|
|
| [27] |
Guidici D, Clark M L. 2017. One-dimensional convolutional neural network land-cover classification of multi-seasonal hyperspectral imagery in the San Francisco Bay Area, California. Remote Sensing, 9(6): 629, doi: 10.3390/rs9060629.
|
|
|
| [28] |
Günen M A. 2022. Performance comparison of deep learning and machine learning methods in determining wetland water areas using EuroSAT dataset. Environmental Science and Pollution Research, 29(14): 21092-21106.
|
|
|
| [29] |
Hao X J, Liu L, Yang R J, et al. 2023. A review of data augmentation methods of remote sensing image target recognition. Remote Sensing, 15(3): 827, doi: 10.3390/rs15030827.
|
|
|
| [30] |
He J L, Zhao W, Li A N, et al. 2019. The impact of the terrain effect on land surface temperature variation based on Landsat-8 observations in mountainous areas. International Journal of Remote Sensing, 40(5-6): 1808-1827.
|
|
|
| [31] |
Hinton G E, Salakhutdinov R R. 2006. Reducing the dimensionality of data with neural networks. Science, 313(5786): 504-507.
doi: 10.1126/science.1127647
pmid: 16873662
|
|
|
| [32] |
Ioffe S, Szegedy C. 2015. Batch normalization:Accelerating deep network training by reducing internal covariate shift. In: Bach F, Blei D. Proceedings of the 32nd International Conference on International Conference on Machine Learning. France: PMLR, 448-456.
|
|
|
| [33] |
IPCC (Intergovernmental Panel on Climate Change). 2014. Mitigation of climate change. Contribution of working group III to the fifth assessment report of the intergovernmental panel on climate change, 1454: 147, doi: 10.1017/CBO9781107415416.
|
|
|
| [34] |
Jibitha J B, Achu A L, Joseph S, et al. 2024. Assessment of changes in land use/land cover and land surface temperature in a fast-growing urban agglomeration of Southern India. Environment, Development and Sustainability, doi: 10.1007/s10668-024-04494-9.
|
|
|
| [35] |
Kafy A A, Dey N N, Al Rakib A, et al. 2021a. Modeling the relationship between land use/land cover and land surface temperature in Dhaka, Bangladesh using CA-ANN algorithm. Environmental Challenges, 4: 100190, doi: 10.1016/j.envc. 2021.100190.
|
|
|
| [36] |
Kafy A A, Rahman M S, Islam M, et al. 2021b. Prediction of seasonal urban thermal field variance index using machine learning algorithms in Cumilla, Bangladesh. Sustainable Cities and Society, 64: 102542, doi: 10.1016/j.scs.2020.102542.
|
|
|
| [37] |
Khan R, Aribam B, Alam W. 2023. Estimation of impacts of land use and land cover (LULC) changes on land surface temperature (LST) within greater Imphal urban area using geospatial technique. Acta Geophysica, 71(6): 2811-2823.
|
|
|
| [38] |
Komeh Z, Hamzeh S, Memarian H, et al. 2023. Monitoring the spatial autocorrelation of land surface temperature with land use in different climatic regions (case study: The metropolitans of Mashhad and Sari). Desert, 28(2): 329-351.
|
|
|
| [39] |
Krizhevsky A, Sutskever I, Hinton G E. 2012. Imagenet classification with deep convolutional neural networks. Advances in Neural Information Processing Systems, 25: 1097-1105.
|
|
|
| [40] |
Kumar L, Mutanga O. 2018. Google Earth Engine applications since inception: Usage, trends, and potential. Remote Sensing, 10(10): 1509, doi: 10.3390/rs10101509.
|
|
|
| [41] |
Kussul N, Lavreniuk M, Skakun S, et al. 2017. Deep learning classification of land cover and crop types using remote sensing data. IEEE Geoscience and Remote Sensing Letters, 14(5): 778-782.
|
|
|
| [42] |
Lausch A, Erasmi S, King D J, et al. 2017. Understanding forest health with remote sensing-part II-A review of approaches and data models. Remote Sensing, 9(2): 129, doi: 10.3390/rs9020129.
|
|
|
| [43] |
Lazzarini M, Marpu P R, Ghedira H. 2013. Temperature-land cover interactions: The inversion of urban heat island phenomenon in desert city areas. Remote Sensing of Environment, 130: 136-152.
|
|
|
| [44] |
Li M C, Ma L, Blaschke T, et al. 2016. A systematic comparison of different object-based classification techniques using high spatial resolution imagery in agricultural environments. International Journal of Applied Earth Observation and Geoinformation, 49: 87-98.
|
|
|
| [45] |
Li Y, Zhang H K, Shen Q. 2017. Spectral-spatial classification of hyperspectral imagery with 3D convolutional neural network. Remote Sensing, 9(1): 67, doi: 10.3390/rs9010067.
|
|
|
| [46] |
Li Z M, Chen B, Wu S B, et al. 2024. Deep learning for urban land use category classification: A review and experimental assessment. Remote Sensing of Environment, 311: 114290, doi: 10.1016/j.rse.2024.114290.
|
|
|
| [47] |
Liu J L, Liu S W, Tang X G, et al. 2022. The response of land surface temperature changes to the vegetation dynamics in the Yangtze River Basin. Remote Sensing, 14(20): 5093, doi: 10.3390/rs14205093.
|
|
|
| [48] |
Liu L, Zhang Y Z. 2011. Urban heat island analysis using the Landsat TM data and ASTER data: A case study in Hong Kong. Remote Sensing, 3(7): 1535-1552.
|
|
|
| [49] |
Ma L, Liu Y, Zhang X L, et al. 2019. Deep learning in remote sensing applications: A meta-analysis and review. ISPRS Journal of Photogrammetry and Remote Sensing, 152: 166-177.
doi: 10.1016/j.isprsjprs.2019.04.015
|
|
|
| [50] |
Malik M S, Shukla J P, Mishra S. 2019. Relationship of LST, NDBI and NDVI using landsat-8 data in Kandaihimmat Watershed, Hoshangabad, India. Indian Journal of Geo-Marine Sciences, 48(1): 25-31.
|
|
|
| [51] |
Maxwell A E, Warner T A, Fang F. 2018. Implementation of machine-learning classification in remote sensing: An applied review. International Journal of Remote Sensing, 39(9): 2784-2817.
|
|
|
| [52] |
Mazzia V, Khaliq A, Chiaberge M. 2019. Improvement in land cover and crop classification based on temporal features learning from Sentinel-2 data using recurrent-convolutional neural network (R-CNN). Applied Sciences, 10(1): 238, doi: 10.3390/app10010238.
|
|
|
| [53] |
Memarian H, Balasundram S K, Khosla R. 2013. Comparison between pixel-and object-based image classification of a tropical landscape using Système Pour l'Observation de la Terre-5 imagery. Journal of Applied Remote Sensing, 7(1): 073512, 10.1117/1.JRS.7.073512.
|
|
|
| [54] |
Munawar M, Prasetya T A E, McNeil R, et al. 2023. Spatio and temporal analysis of Indonesia land surface temperature variation during 2001-2020. Journal of the Indian Society of Remote Sensing, 51(7): 1393-1407.
|
|
|
| [55] |
Naidoo L, Van Deventer H, Ramoelo A, et al. 2019. Estimating above ground biomass as an indicator of carbon storage in vegetated wetlands of the grassland biome of South Africa. International Journal of Applied Earth Observation and Geoinformation, 78: 118-129.
|
|
|
| [56] |
Naushad R, Kaur T, Ghaderpour E. 2021. Deep transfer learning for land use and land cover classification: A comparative study. Sensors, 21(23): 8083, doi: 10.3390/s21238083.
|
|
|
| [57] |
Nega W, Balew A. 2022. The relationship between land use land cover and land surface temperature using remote sensing: Systematic reviews of studies globally over the past 5 years. Environmental Science and Pollution Research, 29(28): 42493-42508.
|
|
|
| [58] |
Patel S, Indraganti M, Jawarneh R N. 2023. A comprehensive systematic review: Impact of Land Use/Land Cover (LULC) on Land Surface Temperatures (LST) and outdoor thermal comfort. Building and Environment, 246: 111130, doi: 10.1016/j.buildenv.2023.111130.
|
|
|
| [59] |
Pérez G, Coma J, Sol S, et al. 2017. Green facade for energy savings in buildings: The influence of leaf area index and facade orientation on the shadow effect. Applied Energy, 187: 424-437.
|
|
|
| [60] |
Puissant A, Rougier S, Stumpf A. 2014. Object-oriented mapping of urban trees using Random Forest classifiers. International Journal of Applied Earth Observation and Geoinformation, 26: 235-245.
|
|
|
| [61] |
Qin Q, Dou J, Tu Z. 2020. Deep ResNet based remote sensing image super-resolution reconstruction in discrete wavelet domain. Pattern Recognition and Image Analysis, 30: 541-550.
|
|
|
| [62] |
Rahimpour M, Tajbakhsh M, Memarian H, et al. 2021. Impact assessment of climate change on hydro-climatic conditions of arid and semi-arid watersheds (case study: Zoshk-Abardeh watershed, Iran). Journal of Water and Climate Change, 12(2): 580-595.
doi: 10.2166/wcc.2020.224
|
|
|
| [63] |
Rasul A, Balzter H, Smith C. 2015. Spatial variation of the daytime surface urban cool island during the dry season in Erbil, Iraqi Kurdistan, from Landsat 8. Urban Climate, 14(2): 176-186.
|
|
|
| [64] |
Ravanelli R, Nascetti A, Cirigliano R V, et al. 2018. Monitoring the impact of land cover change on surface urban heat island through Google Earth Engine: Proposal of a global methodology, first applications and problems. Remote Sensing, 10(9): 1488, doi: 10.3390/rs10091488.
|
|
|
| [65] |
Rezaee M, Mahdianpari M, Zhang Y, et al. 2018. Deep convolutional neural network for complex wetland classification using optical remote sensing imagery. IEEE Journal of Selected Topics in Applied Earth Observations and Remote Sensing, 11(9): 3030-3039.
|
|
|
| [66] |
Rongali G, Keshari A K, Gosain A K, et al. 2018. A mono-window algorithm for land surface temperature estimation from Landsat 8 thermal infrared sensor data: A case study of the Beas River Basin, India. Pertanika Journal of Science & Technology, 26(2): 829-840.
|
|
|
| [67] |
Rosenzweig C, Karoly D, Vicarelli M, et al. 2008. Attributing physical and biological impacts to anthropogenic climate change. Nature, 453(7193): 353-357.
|
|
|
| [68] |
Schmidhuber J. 2015. Deep learning in neural networks: An overview. Neural Networks, 61: 85-117.
pmid: 25462637
|
|
|
| [69] |
Shahfahad Kumari B, Tayyab M, Ahmed I A, et al. 2020. Longitudinal study of land surface temperature (LST) using mono-and split-window algorithms and its relationship with NDVI and NDBI over selected metro cities of India. Arabian Journal of Geosciences, 13: 1040, doi: 10.1007/s12517-020-06068-1.
|
|
|
| [70] |
Shin H C, Roth H R, Gao M C, et al. 2016. Deep convolutional neural networks for computer-aided detection: CNN architectures, dataset characteristics and transfer learning. IEEE Transactions on Medical Imaging, 35(5): 1285-1298.
|
|
|
| [71] |
Sidhu N, Pebesma E, Câmara G. 2018. Using Google Earth Engine to detect land cover change: Singapore as a use case. European Journal of Remote Sensing, 51(1): 486-500.
|
|
|
| [72] |
Tajbakhsh M, Memarian H, Shahrokhi Y. 2016. Analyzing and modeling urban sprawl and land use changes in a developing city using a CA-Markovian approach. Global Journal of Environmental Science and Management, 2(4): 397-410.
|
|
|
| [73] |
Tajbakhsh S, Memarian H, Moradi K, et al. 2018. Performance comparison of land change modeling techniques for land use projection of arid watersheds. Global Journal of Environmental Science and Management, 4(3): 263-280.
|
|
|
| [74] |
Taloor A K, Manhas D S, Kothyari G C. 2021. Retrieval of land surface temperature, normalized difference moisture index, normalized difference water index of the Ravi basin using Landsat data. Applied Computing and Geosciences, 9: 100051, doi: 10.1016/j.acags.2020.100051.
|
|
|
| [75] |
Tran D X, Pla F, Latorre-Carmona P, et al. 2017. Characterizing the relationship between land use land cover change and land surface temperature. ISPRS Journal of Photogrammetry and Remote Sensing, 124: 119-132.
|
|
|
| [76] |
Tzotsos A, Argialas D. 2008. Support vector machine classification for object-based image analysis. In: Blaschke T, Lang S, Hay G. Object-Based Image Analysis:Spatial Concepts for Knowledge-Driven Remote Sensing Applications. Berlin:Springer, 663-677.
|
|
|
| [77] |
Vaglio Laurin G, Pirotti F, Callegari M, et al. 2016. Potential of ALOS2 and NDVI to estimate forest above-ground biomass, and comparison with lidar-derived estimates. Remote Sensing, 9(1): 18, doi: 10.3390/rs9010018.
|
|
|
| [78] |
Wang F, Qin Z H, Song C Y, et al. 2015. An improved mono-window algorithm for land surface temperature retrieval from Landsat 8 thermal infrared sensor data. Remote Sensing, 7(4): 4268-4289.
|
|
|
| [79] |
Wang J, Bretz M, Dewan M A A, et al. 2022. Machine learning in modelling land-use and land cover-change (LULCC): Current status, challenges and prospects. Science of the Total Environment, 822: 153559, doi: 10.1016/j.scitotenv.2022.153559.
|
|
|
| [80] |
Wang M M, Zhang Z J, Hu T, et al. 2019a. A practical single-channel algorithm for land surface temperature retrieval: application to landsat series data. Journal of Geophysical Research: Atmospheres, 124(1): 299-316.
|
|
|
| [81] |
Wang R, Cai M, Ren C, et al. 2019b. Detecting multi-temporal land cover change and land surface temperature in Pearl River Delta by adopting local climate zone. Urban Climate, 28: 100455, doi: 10.1016/j.uclim.2019.100455.
|
|
|
| [82] |
Wang Y, Fang Z C, Hong H Y. 2019c. Comparison of convolutional neural networks for landslide susceptibility mapping in Yanshan County, China. Science of the Total Environment, 666: 975-993.
|
|
|
| [83] |
Wang Y C, Hu B K, Myint S W, et al. 2018. Patterns of land change and their potential impacts on land surface temperature change in Yangon, Myanmar. Science of the Total Environment, 643: 738-750.
|
|
|
| [84] |
Xiong Y Z, Huang S P, Chen F, et al. 2012. The impacts of rapid urbanization on the thermal environment: A remote sensing study of Guangzhou, South China. Remote Sensing, 4(7): 2033-2056.
|
|
|
| [85] |
Yan G. 2003. Pixel Based and Object Oriented Image Analysis for Coal Fire Research. Enschede: ITC (Faculty of Geo-Information Science and Earth Observation).
|
|
|
| [86] |
Yengoh G T, Dent D, Olsson L, et al. 2015. Use of the Normalized Difference Vegetation Index (NDVI) to Assess Land Degradation at Multiple Scales: Current Status, Future Trends, and Practical Considerations. Berlin: Springer.
|
|
|
| [87] |
Zeraatkar Z, Shahidi A, Memarian Khalilabad H. 2021. Comparison of the accuracy of pixel-based and object-oriented methods in land use classification (case study: Samalghan Watershed). Journal of Natural Environment, 73(4): 687-700.
|
|
|
| [88] |
Zhan Q, Meng F, Xiao Y. 2015. Exploring the relationships of between land surface temperature, ground coverage ratio and building volume density in an urbanized environment. The International Archives of the Photogrammetry, Remote Sensing and Spatial Information Sciences, 40: 255-260.
|
|
|
| [89] |
Zhang L P, Zhang L F, Du B. 2016. Deep learning for remote sensing data: A technical tutorial on the state of the art. IEEE Geoscience and Remote Sensing Magazine, 4(2): 22-40.
|
|
|
| [90] |
Zhao H W, Chen Z X, Jiang H, et al. 2019. Evaluation of three deep learning models for early crop classification using sentinel-1A imagery time series-A case study in Zhanjiang, China. Remote Sensing, 11(22): 2673, doi: 10.3390/rs11222673.
|
|
|
|
Viewed |
|
|
|
Full text
|
|
|
|
|
Abstract
|
|
|
|
|
Cited |
|
|
|
|
| |
Shared |
|
|
|
|
| |
Discussed |
|
|
|
|