| Research article |
|


|
|
|
| Evaluation of ecological environmental quality and its driving factors in a mountain basin: A case study of the Manas River Basin, China |
QI Wenwen1,2, LI Yuanyuan1,2,*( ), SHI Xiang1,2 ), SHI Xiang1,2 |
1 Department of Forestry and Ecological Environment, College of Urban and Environmental Sciences, Shihezi University, Shihezi 832000, China
2 Department of Forestry, Agricultural College, Shihezi University, Shihezi 832000, China |
|
|
|
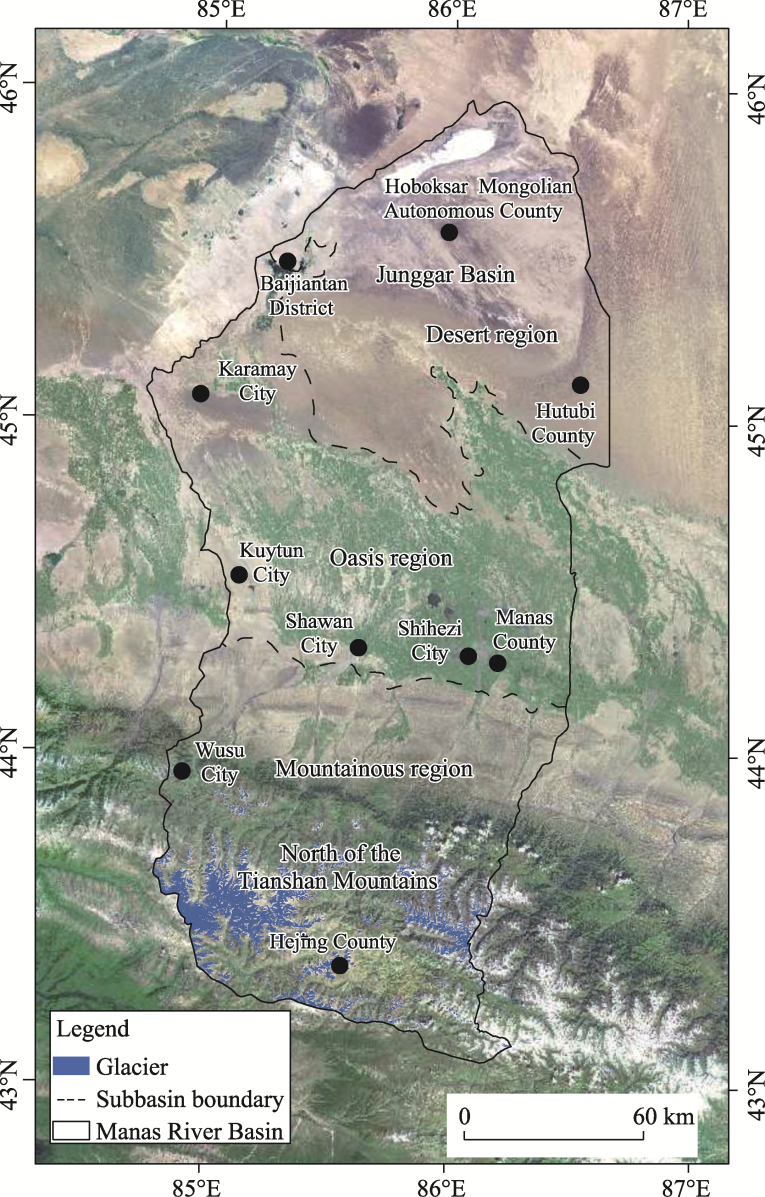
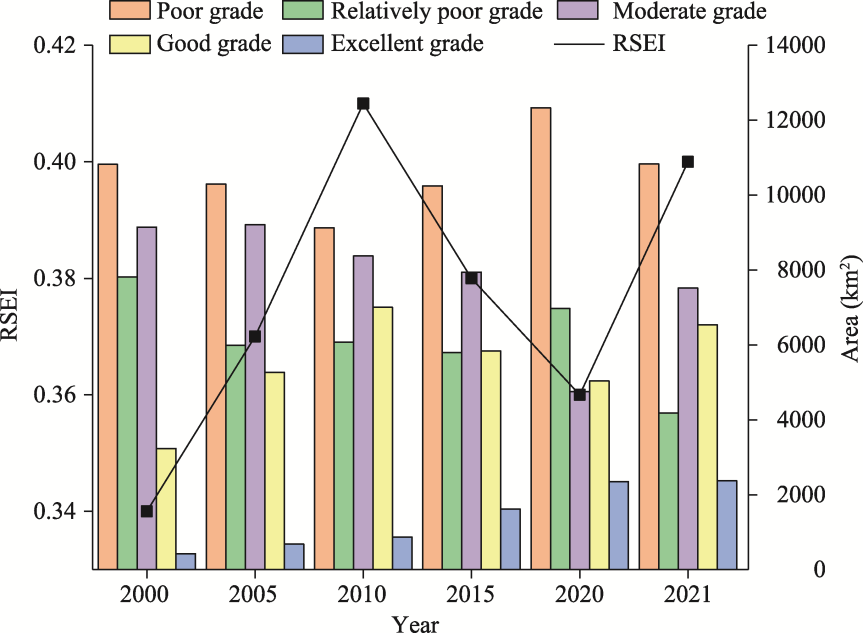
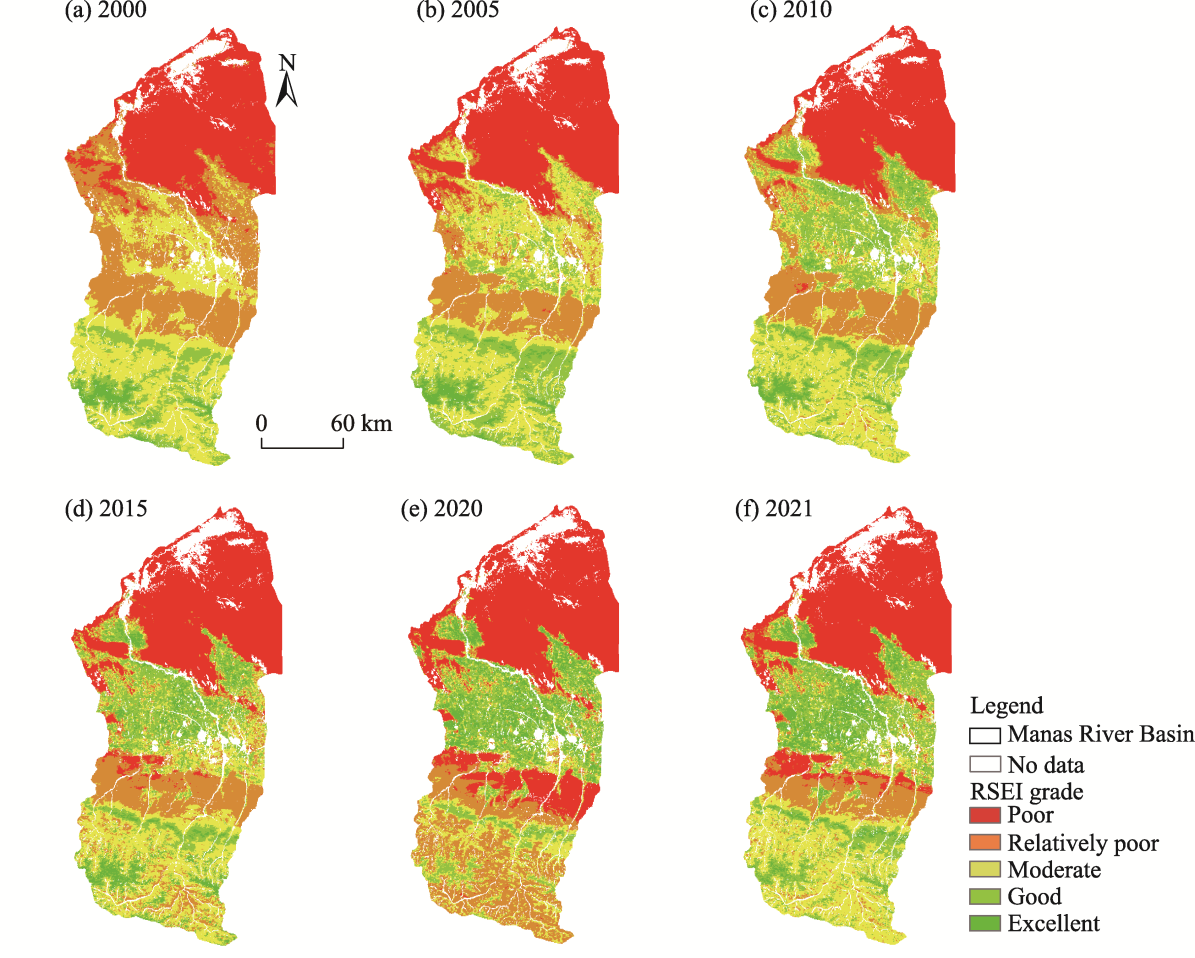
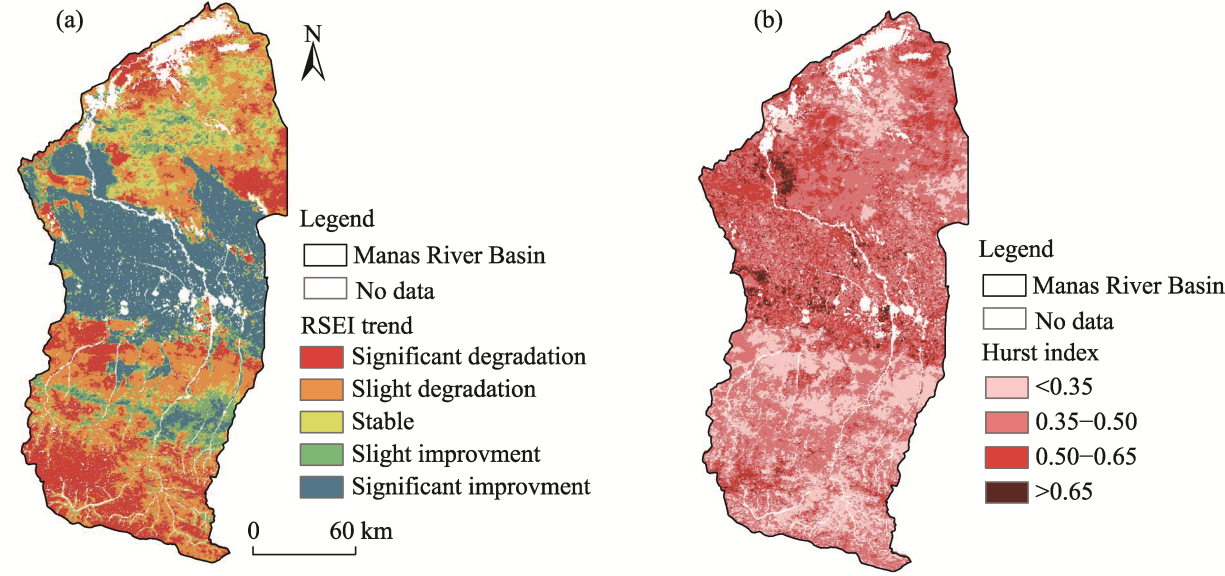
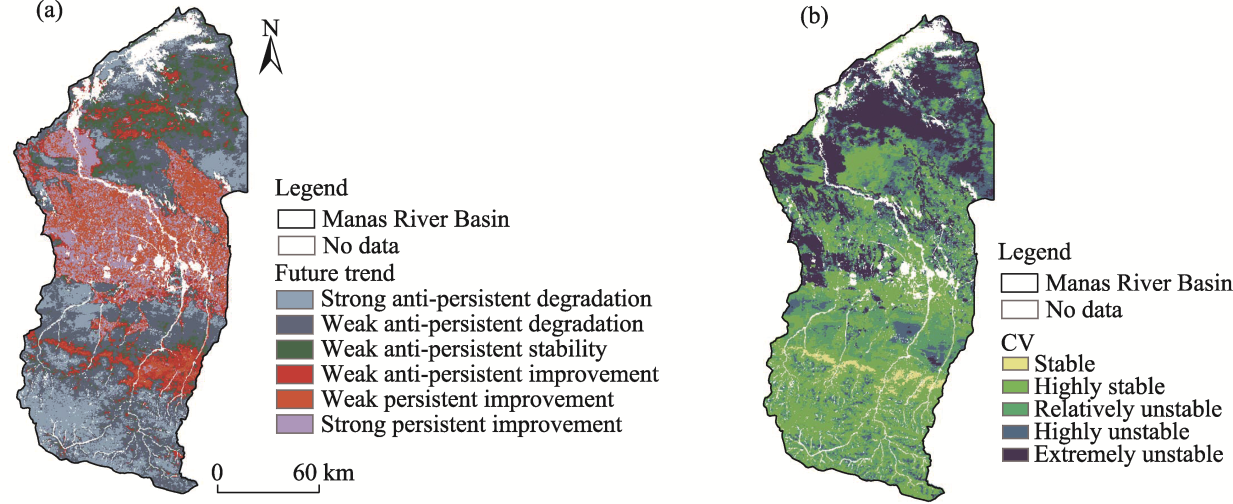
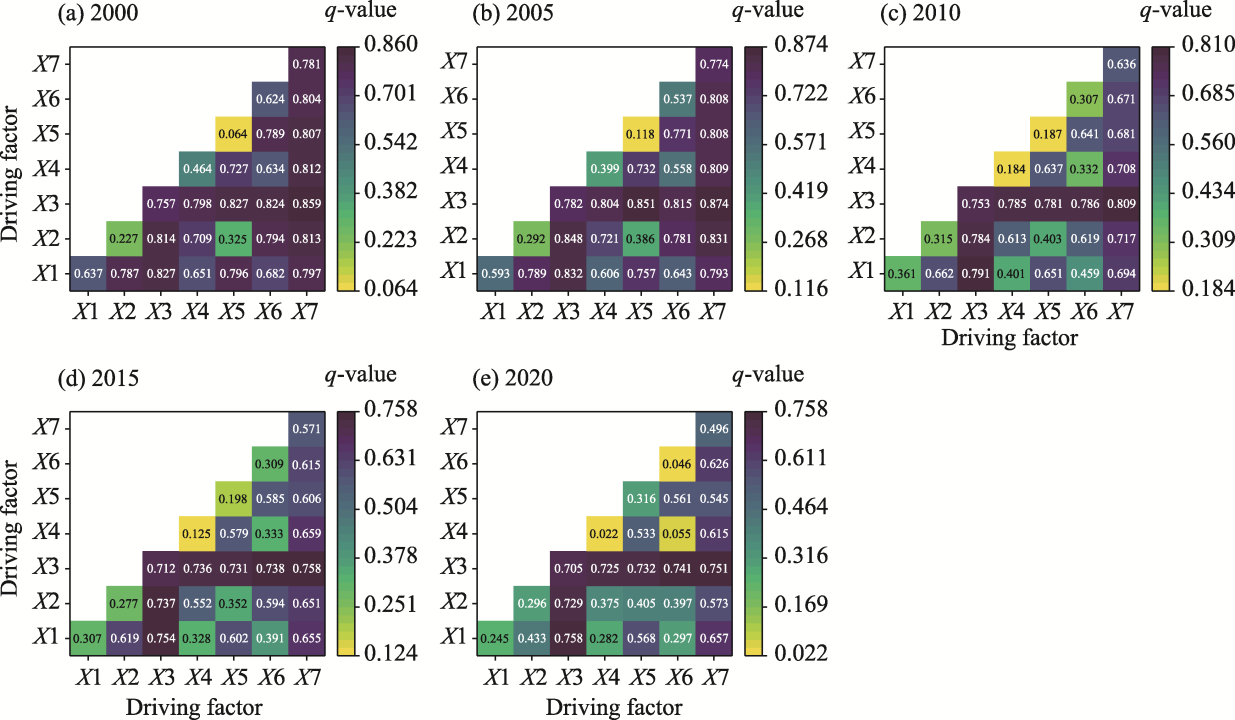
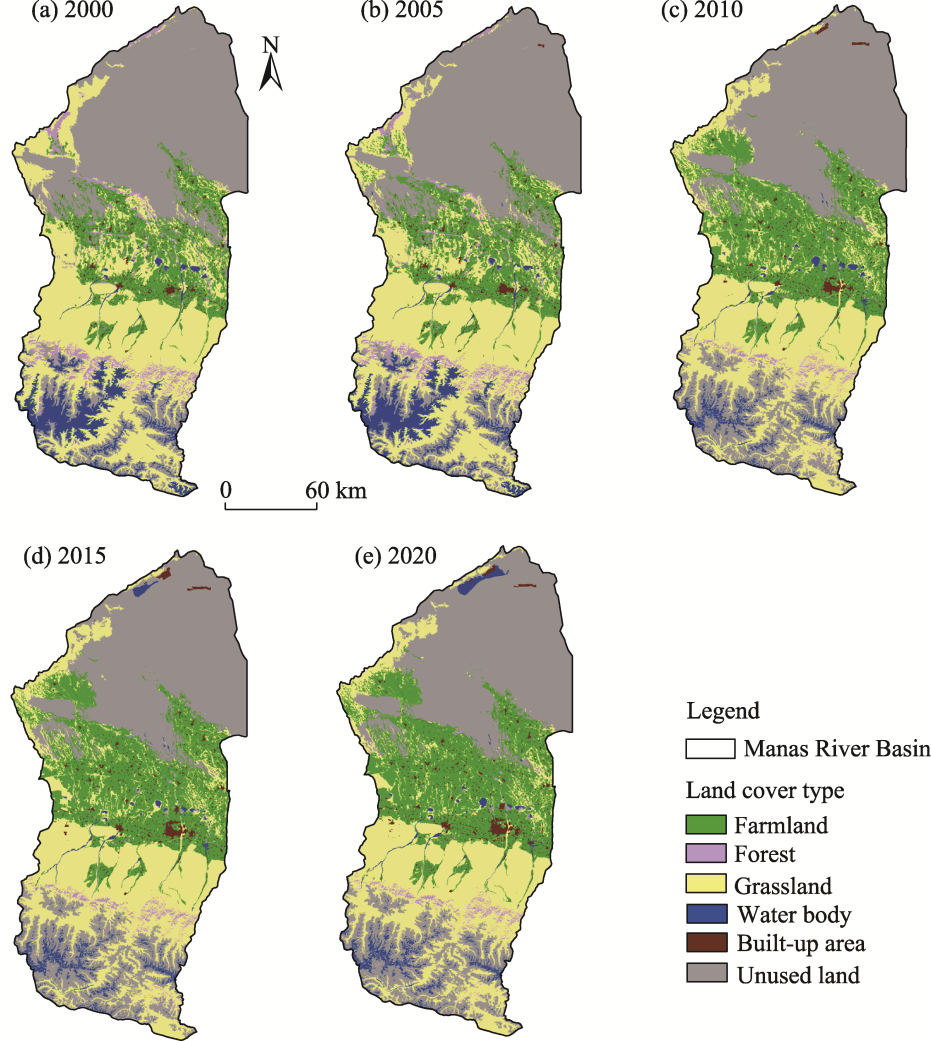
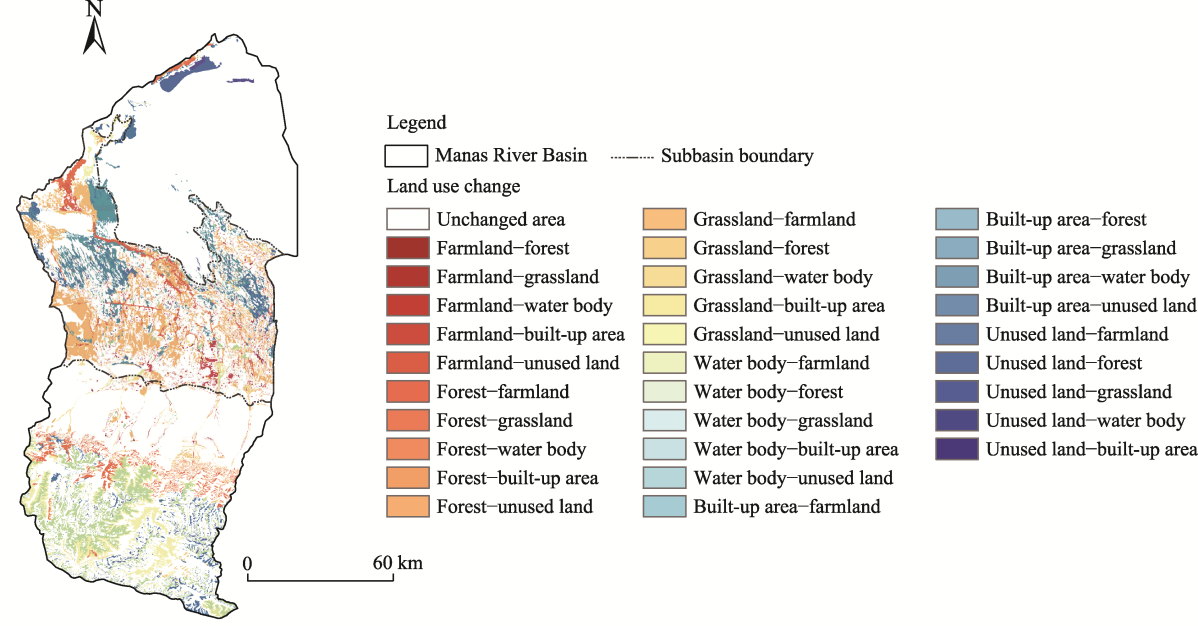
Abstract In recent years, intensified land use change driven by climate change and human activities have markedly impacted the ecological environmental quality of the arid inland river basins. The implementation of forestry projects, coupled with continuous population growth, has increased the need for systematic assessments of ecological effects to ensure sustainable development in arid inland river basins. This study generated a 22-a (2000-2021) remote sensing ecological index (RSEI) data series for the Manas River Basin, a typical arid inland river basin in China, utilizing Moderate Resolution Imaging Spectroradiometer (MODIS) data and the Google Earth Engine (GEE) platform. We examined the spatiotemporal patterns of ecological environmental quality in the Manas River Basin through the Theil-Sen estimator, Mann-Kendall trend test, coefficient of variation (CV), and Hurst index. Furthermore, we employed the Optimal Parameter-based Geographical Detector (OPGD) method to quantify the influence of seven key drivers: elevation, slope, temperature, precipitation, gross domestic product (GDP), population density, and land use change. The key findings revealed that the basin's ecological environmental quality showed significant improvement (mean RSEI of 0.38, with a range of 0.34-0.41), with areas exhibiting good and excellent grades increasing by 16.71%, particularly in the midstream oasis region and upstream mountainous region, while areas exhibiting poor and relatively poor grades decreased by 11.52% in the downstream desert region. Spatial heterogeneity of ecological environmental quality was pronounced, with 32.23% of the areas showing localized degradation, the midstream oasis region exhibiting sustainable recovery potential (Hurst index>0.50), and only 36.67% of the areas maintaining stable and highly stable conditions (primarily in the upstream mountainous region). The OPGD analysis revealed that temperature (q-value=0.496-0.780), land use change (q-value=0.705-0.782), and elevation (q-value=0.245-0.637) were dominant factors, with the influence of land use change increasing during 2000-2020. Strong interaction effects emerged between land use change and temperature (q-value>0.705) and between land use change and elevation (q-value=0.751 in 2020), highlighting intensified human-nature coupling. These findings provide vital perspectives for ecosystem management in arid inland river basins under both climate and anthropogenic pressures.
|
|
Received: 26 August 2025
Published: 30 April 2026
|
|
Corresponding Authors:
*LI Yuanyuan (E-mail: 2004liyy@163.com)
|
|
|
| [1] |
An M, Xie P, He W J, et al. 2022. Spatiotemporal change of ecologic environment quality and human interaction factors in three gorges ecologic economic corridor, based on RSEI. Ecological Indicators, 141: 109090, doi: 10.1016/j.ecolind.2022.109090.
|
|
|
| [2] |
Aplin P. 2005. Remote sensing: Ecology. Progress in Physical Geography, 29(1): 104-113.
|
|
|
| [3] |
Cao Y, Zhang J Y, Zhang Z Y, et al. 2025. The difference in ecological environmental quality impact factors between human activity zone and non-human activity zone in arid regions: A case study of the northern slope of the Tianshan Mountains. Ecological Indicators, 171: 113226, doi: 10.1016/j.ecolind.2025.113226.
|
|
|
| [4] |
Chen S F, Zhang Q F, Chen Y N, et al. 2023. Vegetation change and eco-environmental quality evaluation in the Loess Plateau of China from 2000 to 2020. Remote Sensing, 15(2): 424, doi: 10.3390/rs15020424.
|
|
|
| [5] |
Cheng P G, Tong C Z, Chen X Y, et al. 2015. Urban ecological environment monitoring and evaluation based on remote sensing ecological index. Proceedings of SPIE, 9808: 98083 Z, doi: 10.1117/12.2207385.
|
|
|
| [6] |
Ding Z, Peng J, Qiu S, et al. 2020. Nearly half of global vegetated area experienced inconsistent vegetation growth in terms of greenness, cover, and productivity. Earth's Future, 8(10): e2020EF001618, doi: 10.1029/2020EF001618.
|
|
|
| [7] |
Du Y J, He X L, Li X L, et al. 2022. Changes in landscape pattern and ecological service value as land use evolves in the Manas River Basin. Open Geosciences, 14(1): 1092-1112.
doi: 10.1515/geo-2022-0414
|
|
|
| [8] |
Feng L, Yue D P, Guo X. 2009. A review on application of normal different vegetation index. Forest Inventory and Planning, 34(2): 48-52. (in Chinese)
|
|
|
| [9] |
Geng J W, Yu K Y, Xie Z, et al. 2022. Analysis of spatiotemporal variation and drivers of ecological quality in Fuzhou based on RSEI. Remote Sensing, 14(19): 4900, doi: 10.3390/rs14194900.
|
|
|
| [10] |
Gong C, Lyu F N, Wang Y L. 2023. Spatiotemporal change and drivers of ecosystem quality in the Loess Plateau based on RSEI: A case study of Shanxi, China. Ecological Indicators, 155: 111060, doi: 10.1016/j.ecolind.2023.111060.
|
|
|
| [11] |
Gou R K, Zhao J. 2020. Eco-environmental quality monitoring in Beijing, China, using an RSEI-based approach combined with random forest algorithms. IEEE Access, 8: 196657-196666.
doi: 10.1109/Access.6287639
|
|
|
| [12] |
He Y D, Ma S S, Zhang L Q, et al. 2023. Spatio-temporal change of net primary productivity and the evaluation of the importance of biodiversity maintenance functions in Manas River Basin. Acta Ecologica Sinica, 43(11): 4664-4673. (in Chinese)
|
|
|
| [13] |
Hurst H E. 1951. Long-term storage capacity of reservoirs. Transactions of the American Society of Civil Engineers, 116(1): 770-799.
doi: 10.1061/TACEAT.0006518
|
|
|
| [14] |
Jing Y Q, Zhang F, He Y F, et al. 2020. Assessment of spatial and temporal variation of ecological environment quality in Ebinur Lake Wetland National Nature Reserve, Xinjiang, China. Ecological Indicators, 110: 105874, doi: 10.1016/j.ecolind.2019.105874.
|
|
|
| [15] |
Kendall M G, Gibbons J D. 1990. Rank Correlation Methods (5th ed.). Oxford: Oxford University Press.
|
|
|
| [16] |
Lee J H, Kim J Y, Kim J I, et al. 2020. Plant thermomorphogenic adaptation to global warming. Journal of Plant Biology, 63(1): 1-9.
doi: 10.1007/s12374-020-09232-y
|
|
|
| [17] |
Lee J M, Yin X J, Zhu H H, et al. 2023. Geographical detector-based research of spatiotemporal evolution and driving factors of oasification and desertification in Manas River Basin, China. Land, 12(8): 1487, doi: 10.3390/land12081487.
|
|
|
| [18] |
Li G W, Zhang N C, Cao Y X, et al. 2024a. Analysis of the temporal and spatial changes of ecological environment quality using the optimization remote sensing ecological index in the middle Yellow River Basin, China. Earth Science Informatics, 17: 5107-5122.
doi: 10.1007/s12145-024-01441-0
|
|
|
| [19] |
Li J J, Wang J X, Du Y Z, et al. 2025. Assessing landscape fragmentation and its driving factors in arid regions: A case study of the Manas River, China. Ecological Indicators, 171: 113253, doi: 10.1016/j.ecolind.2025.113253.
|
|
|
| [20] |
Li J R, Ji M, Jin F X, et al. 2024b. Spatial-temporal variation and driving force analysis of NDVI in the Yellow River estuary area from 2010 to 2023. Science of Surveying and Mapping, 49(9): 81-91. (in Chinese)
|
|
|
| [21] |
Liang L W, Wang Z B, Li J X. 2019. The effect of urbanization on environmental pollution in rapidly developing urban agglomerations. Journal of Cleaner Production, 237: 117649, doi: 10.1016/j.jclepro.2019.117649.
|
|
|
| [22] |
Lin Q Y, Yu S. 2018. Losses of natural coastal wetlands by land conversion and ecological degradation in the urbanizing Chinese coast. Scientific Reports, 8: 15046, doi: 10.1038/s41598-018-33406-x.
pmid: 30301927
|
|
|
| [23] |
Ling H B, Yan J J, Xu H L, et al. 2019. Estimates of shifts in ecosystem service values due to changes in key factors in the Manas River Basin, northwest China. Science of The Total Environment, 659: 177-187.
doi: 10.1016/j.scitotenv.2018.12.309
|
|
|
| [24] |
Liu S H, Huang J C. 2025. Spatio-temporal evolution and driving forces of habitat quality in China's arid and semi-arid regions: an interpretable machine learning perspective for ecological management. Land, 14(10): 1937, doi: 10.3390/land14101937.
|
|
|
| [25] |
Lobser S E, Cohen W B. 2007. MODIS tasselled cap: Land cover characteristics expressed through transformed MODIS data. International Journal of Remote Sensing, 28(22): 5079-5101.
doi: 10.1080/01431160701253303
|
|
|
| [26] |
Lu D D, Chen M X. 2015. Several viewpoints on the background of compiling the "National New Urbanization Planning (2014-2020)". Acta Geographica Sinica, 70(2): 179-185. (in Chinese)
doi: 10.11821/dlxb201502001
|
|
|
| [27] |
Ma D L, Huang Q J, Zhang Q, et al. 2024. Evaluation of eco-environmental quality and analysis of driving forces in the Yellow River delta based on improved remote sensing ecological indices. Stochastic Environmental Research and Risk Assessment, 38(8): 3199-3220.
doi: 10.1007/s00477-024-02740-0
|
|
|
| [28] |
Maimaitituersun A, Yang H, Aobuliaisan N, et al. 2025. Assessing subtle changes in arid land river basin ecological quality: a study utilizing the pie engine platform and RSEI. Ecological Indicators, 170: 113226, doi: 10.1016/j.ecolind.2025.113226.
|
|
|
| [29] |
Mann H B. 1945. Nonparametric tests against trend. Econometrica, 13(3): 245-259.
doi: 10.2307/1907187
|
|
|
| [30] |
McFeeters S K. 1996. The use of the Normalized Difference Water Index (NDWI) in the delineation of open water features. International Journal of Remote Sensing, 17(7): 1425-1432.
doi: 10.1080/01431169608948714
|
|
|
| [31] |
Nasir M A, Canh N P, Lan Le T N. 2021. Environmental degradation & role of financialisation, economic development, industrialisation and trade liberalisation. Journal of Environmental Management, 277: 111471, doi: 10.1016/j.jenvman.2020.111471.
|
|
|
| [32] |
Ozcan B, Tzeremes P G, Tzeremes N G. 2020. Energy consumption, economic growth and environmental degradation in OECD countries. Economic Modelling, 84: 203-213.
doi: 10.1016/j.econmod.2019.04.010
|
|
|
| [33] |
Peng L, Wu H W, Li Z H. 2023. Spatial-temporal evolutions of ecological environment quality and ecological resilience pattern in the middle and lower reaches of the Yangtze River Economic Belt. Remote Sensing, 15(2): 430, doi: 10.3390/rs15020430.
|
|
|
| [34] |
Rees G, Hebryn-Baidy L, Belenok V. 2024. Temporal variations in land surface temperature within an urban ecosystem: A comprehensive assessment of land use and land cover change in Kharkiv, Ukraine. Remote Sensing, 16(9): 1637, doi: 10.3390/rs16091637.
|
|
|
| [35] |
Rouse J W, Haas R H, Schell J A, et al. 1974. Monitoring vegetation systems in the Great Plains with ERTS. In:Proceedings of the 3rd Earth Resources Technology Satellite Symposium. Washington: National Aeronautics and Space Administration (NASA), 309-317.
|
|
|
| [36] |
Sandholt I, Rasmussen K, Andersen J. 2002. A simple interpretation of the surface temperature/vegetation index space for assessment of surface moisture status. Remote Sensing of Environment, 79(2-3): 213-224.
doi: 10.1016/S0034-4257(01)00274-7
|
|
|
| [37] |
Sen P K. 1968. Estimates of the regression coefficient based on Kendall's Tau. Journal of the American Statistical Association, 63(324): 1379-1389.
doi: 10.1080/01621459.1968.10480934
|
|
|
| [38] |
Shen L Q, Hao J X, Cui L L, et al. 2025. Assessing the impact of agricultural land consolidation on ecological environment quality in arid areas based on an improved water benefit-based ecological index. Remote Sensing, 17(17): 2987, doi: 10.3390/rs17172987.
|
|
|
| [39] |
Song H S, Xue L. 2016. Dynamic monitoring and analysis of ecological environment in Weinan City, Northwest China based on RSEI model. Chinese Journal of Applied Ecology, 27(12): 3913-3919. (in Chinese)
|
|
|
| [40] |
Song Y Z, Wang J F, Ge Y, et al. 2020. An optimal parameters-based geographical detector model enhances geographic characteristics of explanatory variables for spatial heterogeneity analysis: Cases with different types of spatial data. GIScience & Remote Sensing, 57(5): 593-610.
|
|
|
| [41] |
Sowińska-Świerkosz B. 2017. Application of surrogate measures of ecological quality assessment: The introduction of the Indicator of Ecological Landscape Quality (IELQ). Ecological Indicators, 73: 224-234.
doi: 10.1016/j.ecolind.2016.09.019
|
|
|
| [42] |
Sun Z X, Liu Y, Sang H B. 2023. Spatial-temporal variation and driving factors of ecological vulnerability in Nansi Lake Basin, China. International Journal of Environmental Research and Public Health, 20(3): 2653, doi: 10.3390/ijerph20032653.
|
|
|
| [43] |
Tang C C, Li Q, Tao H F, et al. 2025. Evaluating the ecological environment quality in the Tarim River Basin based on the modified remote sensing ecological index model. Environmental Science, 46(7): 4485-4497. (in Chinese)
|
|
|
| [44] |
Tang H, Fang J W, Xie R J, et al. 2022. Impact of land cover change on a typical mining region and its ecological environment quality evaluation using remote sensing based ecological index (RSEI). Sustainability, 14(19): 12694, doi: 10.3390/su141912694.
|
|
|
| [45] |
Wang J D, Xu C W. 2017. Geodetector: Principle and prospective. Acta Geographica Sinica, 72(1): 116-134. (in Chinese)
doi: 10.11821/dlxb201701010
|
|
|
| [46] |
Wang J Y, Wang S J, Li S J, et al. 2019a. Coupling analysis of urbanization and energy-environment efficiency: Evidence from Guangdong Province. Applied Energy, 254: 113650, doi: 10.1016/j.apenergy.2019.113650.
|
|
|
| [47] |
Wang K L, Meng X R, Cheng Y H. 2015. Heterogeneous technology, energy saving and emission reduction, and regional eco-efficiency—An empirical analysis based on China's provincial panel data over the period 2004-2012. Journal of Shanxi University of Finance and Economics, 37(2): 69-80. (in Chinese)
|
|
|
| [48] |
Wang L C, Jiao L, Lai F B, et al. 2019b. Evaluation of ecological changes in the Manas Lake Wetland of Xinjiang based on remote sensing ecological index. Acta Ecologica Sinica, 39(8): 2963-2972. (in Chinese)
|
|
|
| [49] |
Wang L H, Zhang J M, Chen W H, et al. 2019c. Spatiotemporal differentiation of ecological environment quality in the Manas River Basin. Arid Zone Research, 36(4): 1015-1023. (in Chinese)
|
|
|
| [50] |
Wang T X, Chen F L, Long A H, et al. 2024. Glacier area change and its impact on runoff in the Manas River Basin, Northwest China from 2000 to 2020. Journal of Arid Land, 16(7): 877-894.
doi: 10.1007/s40333-024-0080-5
|
|
|
| [51] |
Wei H J, Xu Z H, Liu H M, et al. 2018. Evaluation on dynamic change and interrelations of ecosystem services in a typical mountain-oasis-desert region. Ecological Indicators, 93: 917-929.
doi: 10.1016/j.ecolind.2018.05.051
|
|
|
| [52] |
Wen X L, Ming Y L, Gao Y G, et al. 2019. Dynamic monitoring and analysis of ecological quality of Pingtan Comprehensive Experimental Zone, a new type of sea island city, based on RSEI. Sustainability, 12(1): 21, doi: 10.3390/su12010021.
|
|
|
| [53] |
Wu S P, Guo X, Lei J Q, et al. 2022. Ecological environment quality evaluation of the Sahel region in Africa based on remote sensing ecological index. Journal of Arid Land, 14(1): 33-47.
|
|
|
| [54] |
Xiao W, Guo J X, He T T, et al. 2023. Assessing the ecological impacts of opencast coal mining in Qinghai-Tibet Plateau—A case study in Muli coal field, China. Ecological Indicators, 153: 110454, doi: 10.1016/j.ecolind.2023.110454.
|
|
|
| [55] |
Xiong Y, Xu W H, Lu N, et al. 2021. Assessment of spatial-temporal changes of ecological environment quality based on RSEI and GEE: A case study in Erhai Lake Basin, Yunnan Province, China. Ecological Indicators, 125: 107518, doi: 10.1016/j.ecolind.2021.107518.
|
|
|
| [56] |
Xu H. 2008. A new index for delineating built-up land features in satellite imagery. International Journal of Remote Sensing, 29(14): 4269-4276.
doi: 10.1080/01431160802039957
|
|
|
| [57] |
Xu H Q. 2013. A remote sensing index for assessment of regional ecological changes. China Environmental Science, 33(5): 889-897. (in Chinese)
|
|
|
| [58] |
Xu W J, Song J X, Long Y Q, et al. 2023. Analysis and simulation of the driving mechanism and ecological effects of land cover change in the Weihe River basin, China. Journal of Environmental Management, 344: 118320, doi: 10.1016/j.jenvman.2023.118320.
|
|
|
| [59] |
Xu Y, Zhou H R. 2003. A preliminary study on advances in assessment of eco-environmental quality in China. Arid Land Geography, 26(2): 166-172. (in Chinese)
doi: 10.13826/j.cnki.cn65-1103/x.2003.02.013
|
|
|
| [60] |
Yang P, Peng Y, Liu X, et al. 2016. Urban development suitability evaluations based on ecological assessments—A case study of Manasi County, Xinjiang. Journal of Tsinghua University (Science and Technology), 56(8): 865-870. (in Chinese)
|
|
|
| [61] |
Yang X, Xue H Z, Dong G T, et al. 2024. Vegetation changes and driving factors in the Qilian Mountains during 1982-2022. Chinese Journal of Ecology, 43(6): 1576-1586. (in Chinese)
doi: 10.13292/j.1000-4890.202406.015
|
|
|
| [62] |
Yang Z K, Tian J, Li W Y, et al. 2021. Spatio-temporal pattern and evolution trend of ecological environment quality in the Yellow River Basin. Acta Ecologica Sinica, 41(19): 7627-7636. (in Chinese)
|
|
|
| [63] |
Yu B B. 2021. Ecological effects of new-type urbanization in China. Renewable and Sustainable Energy Reviews, 135: 110239, doi: 10.1016/j.rser.2020.110239.
|
|
|
| [64] |
Yu J B, Li X H, Guan X B, et al. 2024. A remote sensing assessment index for urban ecological livability and its application. Geo-spatial Information Science, 27(2): 289-310.
doi: 10.1080/10095020.2022.2072775
|
|
|
| [65] |
Yuan B D, Fu L N, Zou Y A, et al. 2021. Spatiotemporal change detection of ecological quality and the associated affecting factors in Dongting Lake Basin, based on RSEI. Journal of Cleaner Production, 321: 126995, doi: 10.1016/j.jclepro.2021.126995.
|
|
|
| [66] |
Zeng L L, Wardlow B D, Hu S, et al. 2021. A novel strategy to reconstruct NDVI time-series with high temporal resolution from MODIS multi-temporal composite products. Remote Sensing, 13(7): 1397, doi: 10.3390/rs13071397.
|
|
|
| [67] |
Zhang H B, Wang W, Song Y J, et al. 2024. Ecological index evaluation of arid inflow area based on the modified remote sensing ecological index: A case study of Tabu River Basin at the northern foot of the Yin Mountains. Acta Ecologica Sinica, 44(2): 523-543. (in Chinese)
|
|
|
| [68] |
Zhang J L, Wang Y J, Ding W Q, et al. 2010. Evaluation of ecological environment quality in the Manas River Basin in recent 30 years. Journal of Anhui Agricultural Sciences, 38(14): 7446-7448. (in Chinese)
|
|
|
| [69] |
Zhang K L, Feng R R, Zhang Z C, et al. 2022. Exploring the driving factors of remote sensing ecological index changes from the perspective of geospatial differentiation: A case study of the Weihe River Basin, China. International Journal of Environmental Research and Public Health, 19(17): 10930, doi: 10.3390/ijerph191710930.
|
|
|
| [70] |
Zhang Q Q, Xu H L, Li Y, et al. 2012. Oasis evolution and water resource utilization of a typical area in the inland river basin of an arid area: A case study of the Manas River valley. Environmental Earth Sciences, 66: 683-692.
doi: 10.1007/s12665-011-1276-5
|
|
|
| [71] |
Zhang Y R, Liu X T, Gao W Q, et al. 2021. Dynamic changes of forest vegetation carbon storage and the characteristics of carbon sink (source) in the Natural Forest Protection Project region for the past 20 years. Acta Ecologica Sinica, 41(13): 5093-5105. (in Chinese)
|
|
|
| [72] |
Zhao X Y, Tan S C, Li Y P, et al. 2024b. Quantitative analysis of fractional vegetation cover in southern Sichuan urban agglomeration using optimal parameter geographic detector model, China. Ecological Indicators, 158: 111529, doi: 10.1016/j.ecolind.2023.111529.
|
|
|
| [73] |
Zhou M L, Li Z H, Gao M L, et al. 2024. Revealing the eco-environmental quality of the Yellow River Basin: Trends and drivers. Remote Sensing, 16(11): 2018, doi: 10.3390/rs16112018.
|
|
|
|
Viewed |
|
|
|
Full text
|
|
|
|
|
Abstract
|
|
|
|
|
Cited |
|
|
|
|
| |
Shared |
|
|
|
|
| |
Discussed |
|
|
|
|