|
|
|
| Spatial-temporal variations of ecological vulnerability in the Tarim River Basin, Northwest China |
BAI Jie1,2,3, LI Junli1,2,3,*( ), BAO Anmin1,2,3, CHANG Cun1,2,3 ), BAO Anmin1,2,3, CHANG Cun1,2,3 |
1 State Key Laboratory of Desert and Oasis Ecology, Xinjiang Institute of Ecology and Geography, Chinese Academy of Sciences, Urumqi 830011, China
2 Key Laboratory of GIS & RS Application Xinjiang Uygur Autonomous Region, Urumqi 830011, China
3 University of Chinese Academy of Sciences, Beijing 100049, China |
|
|
|
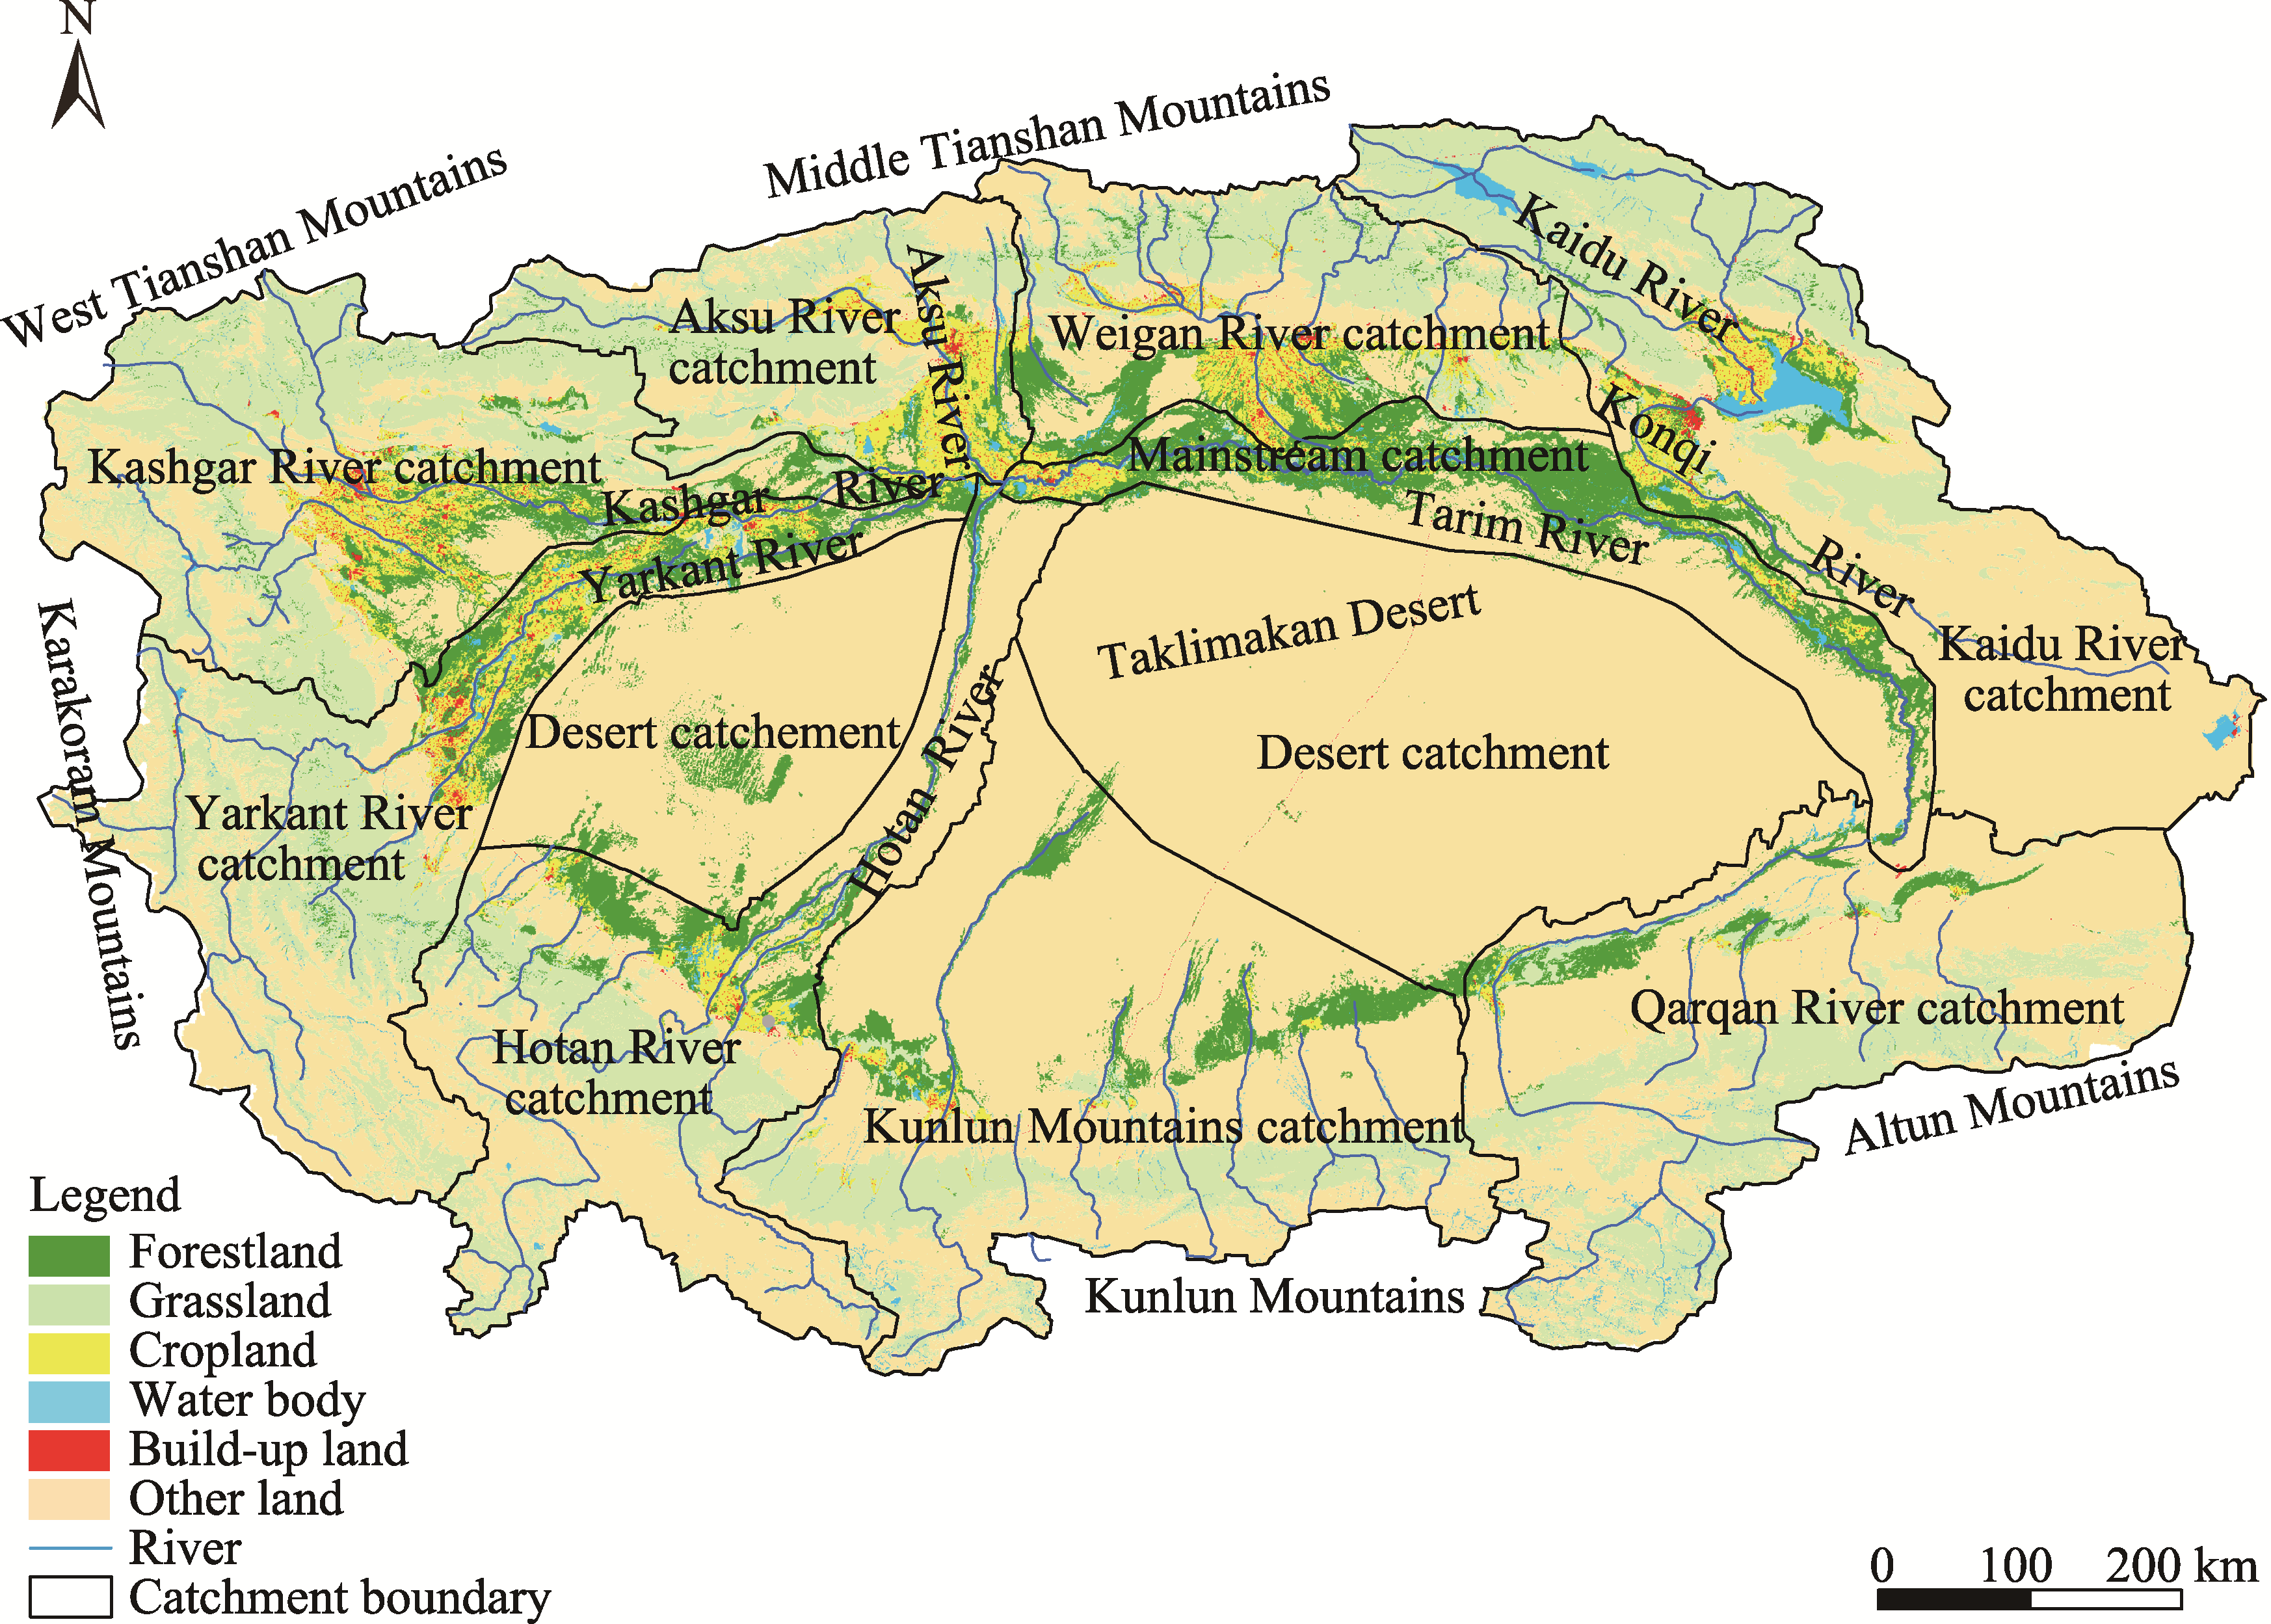
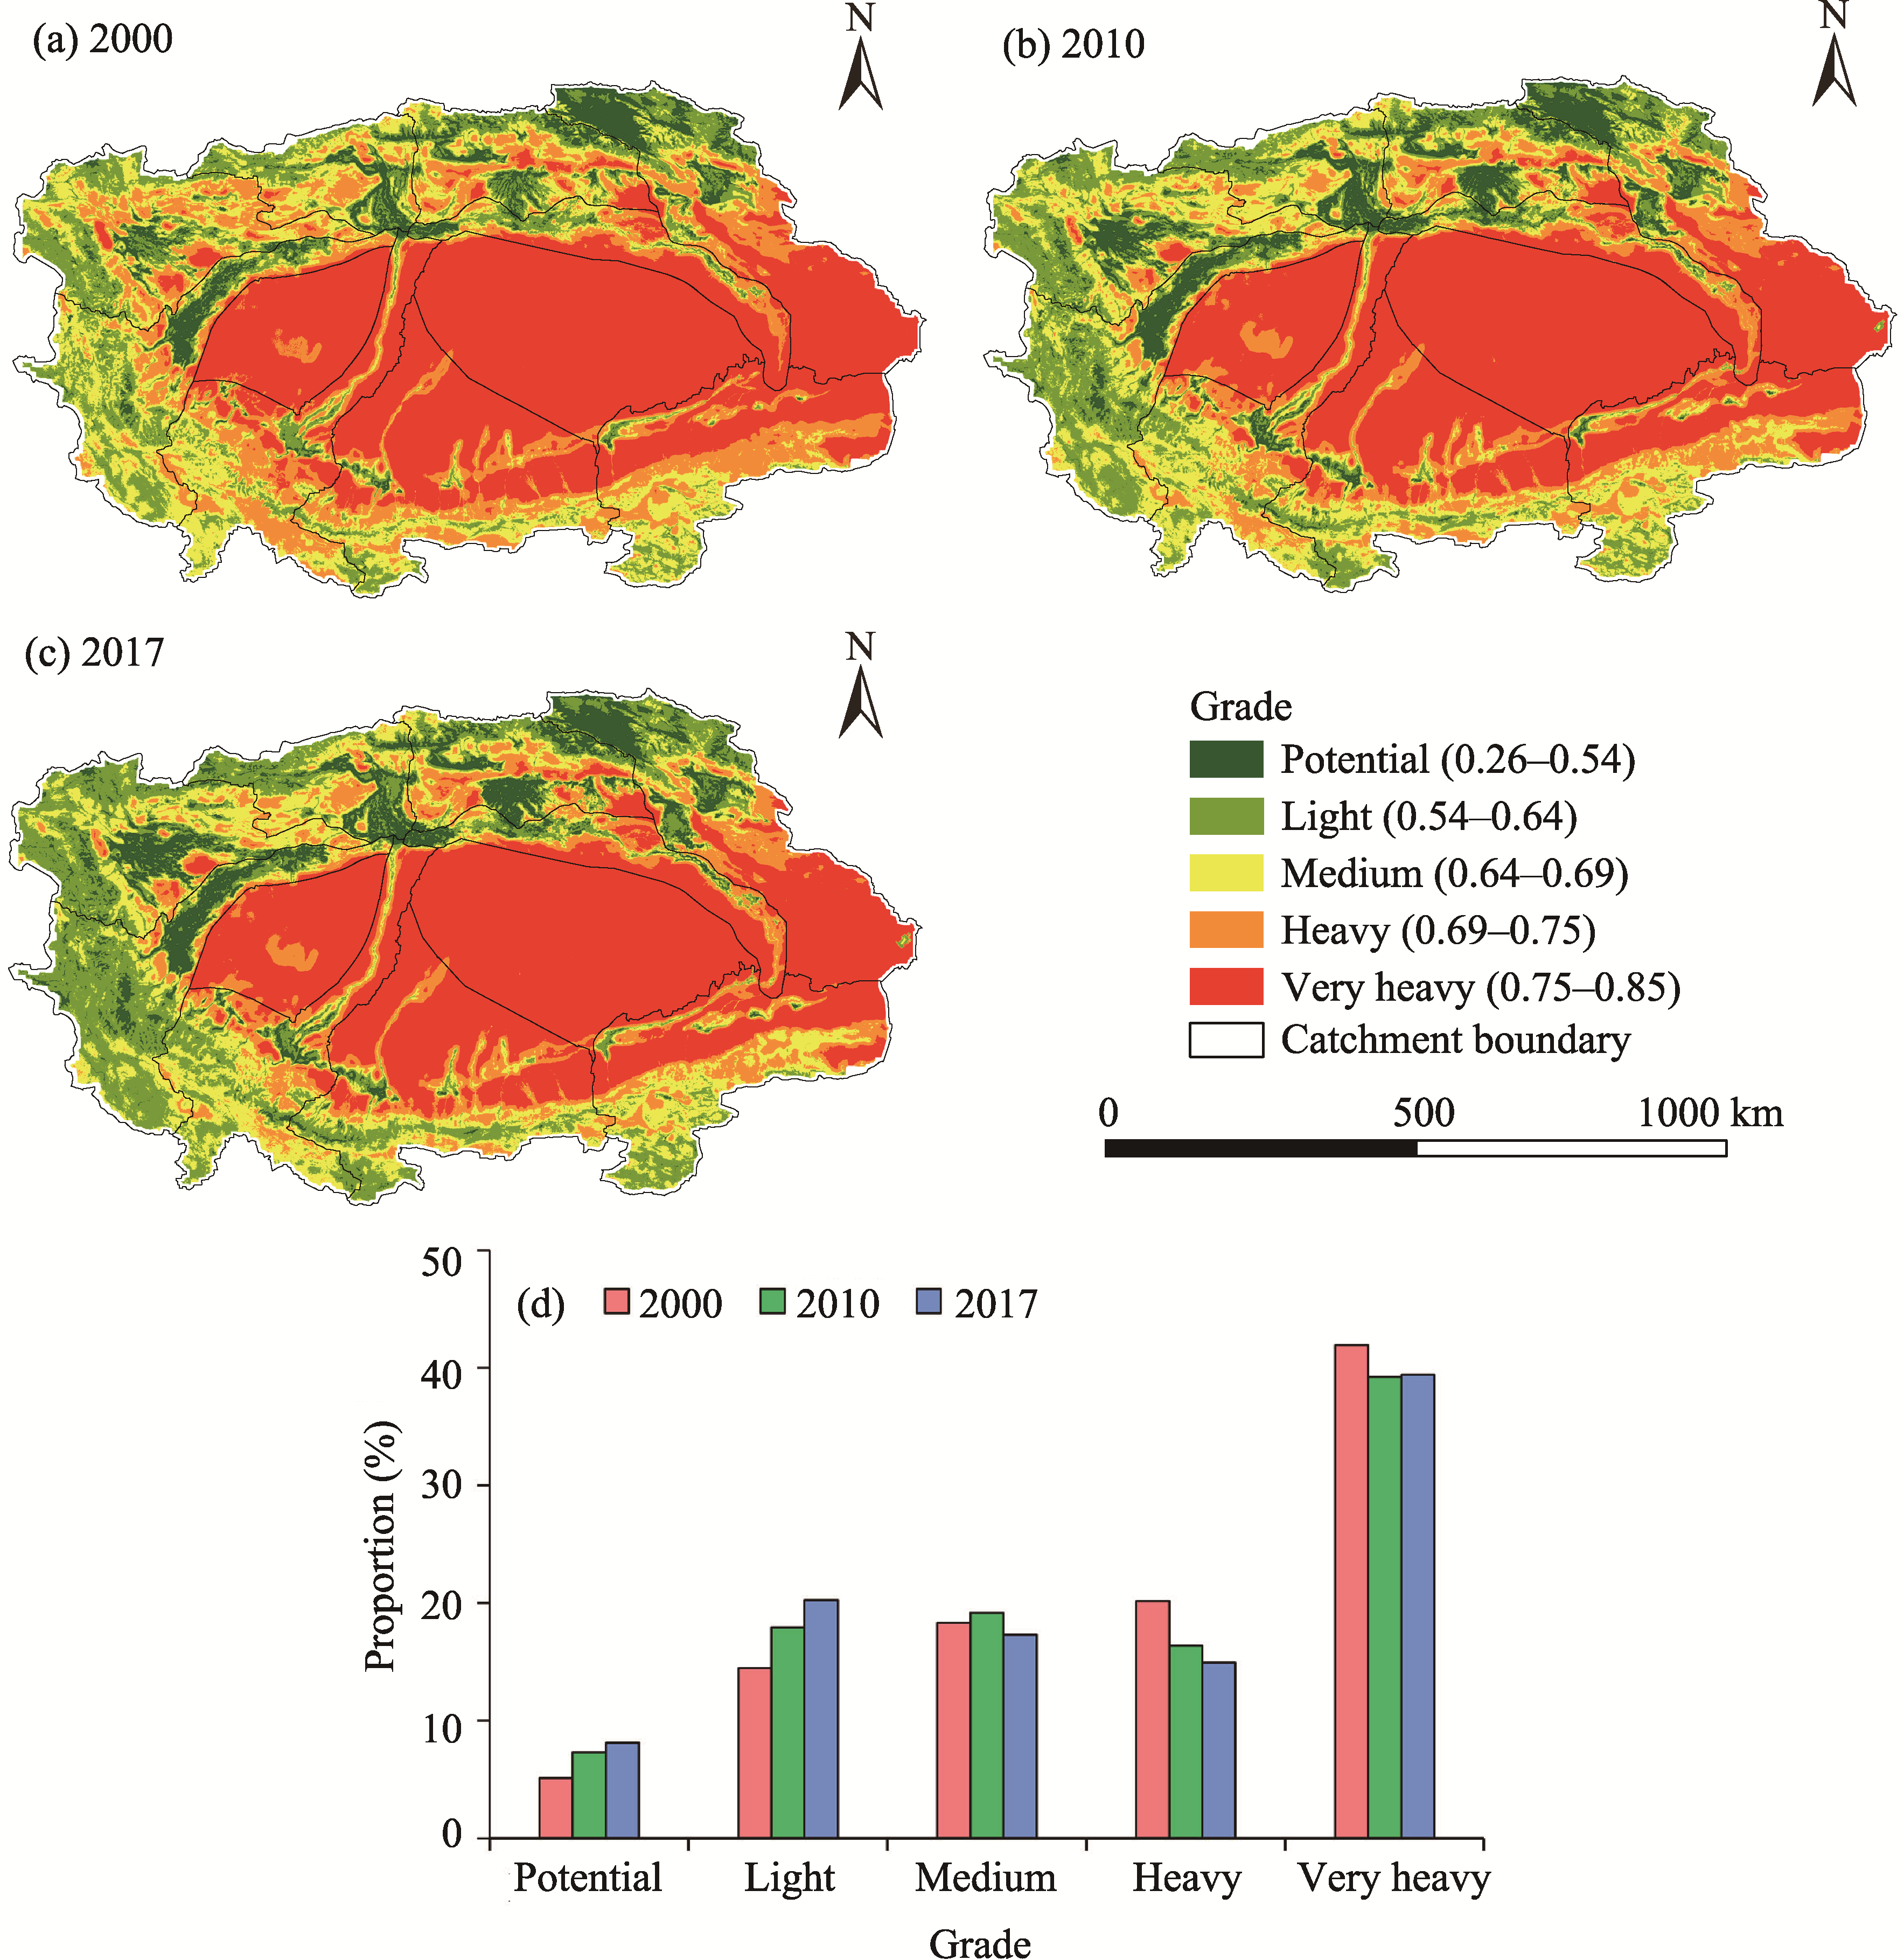
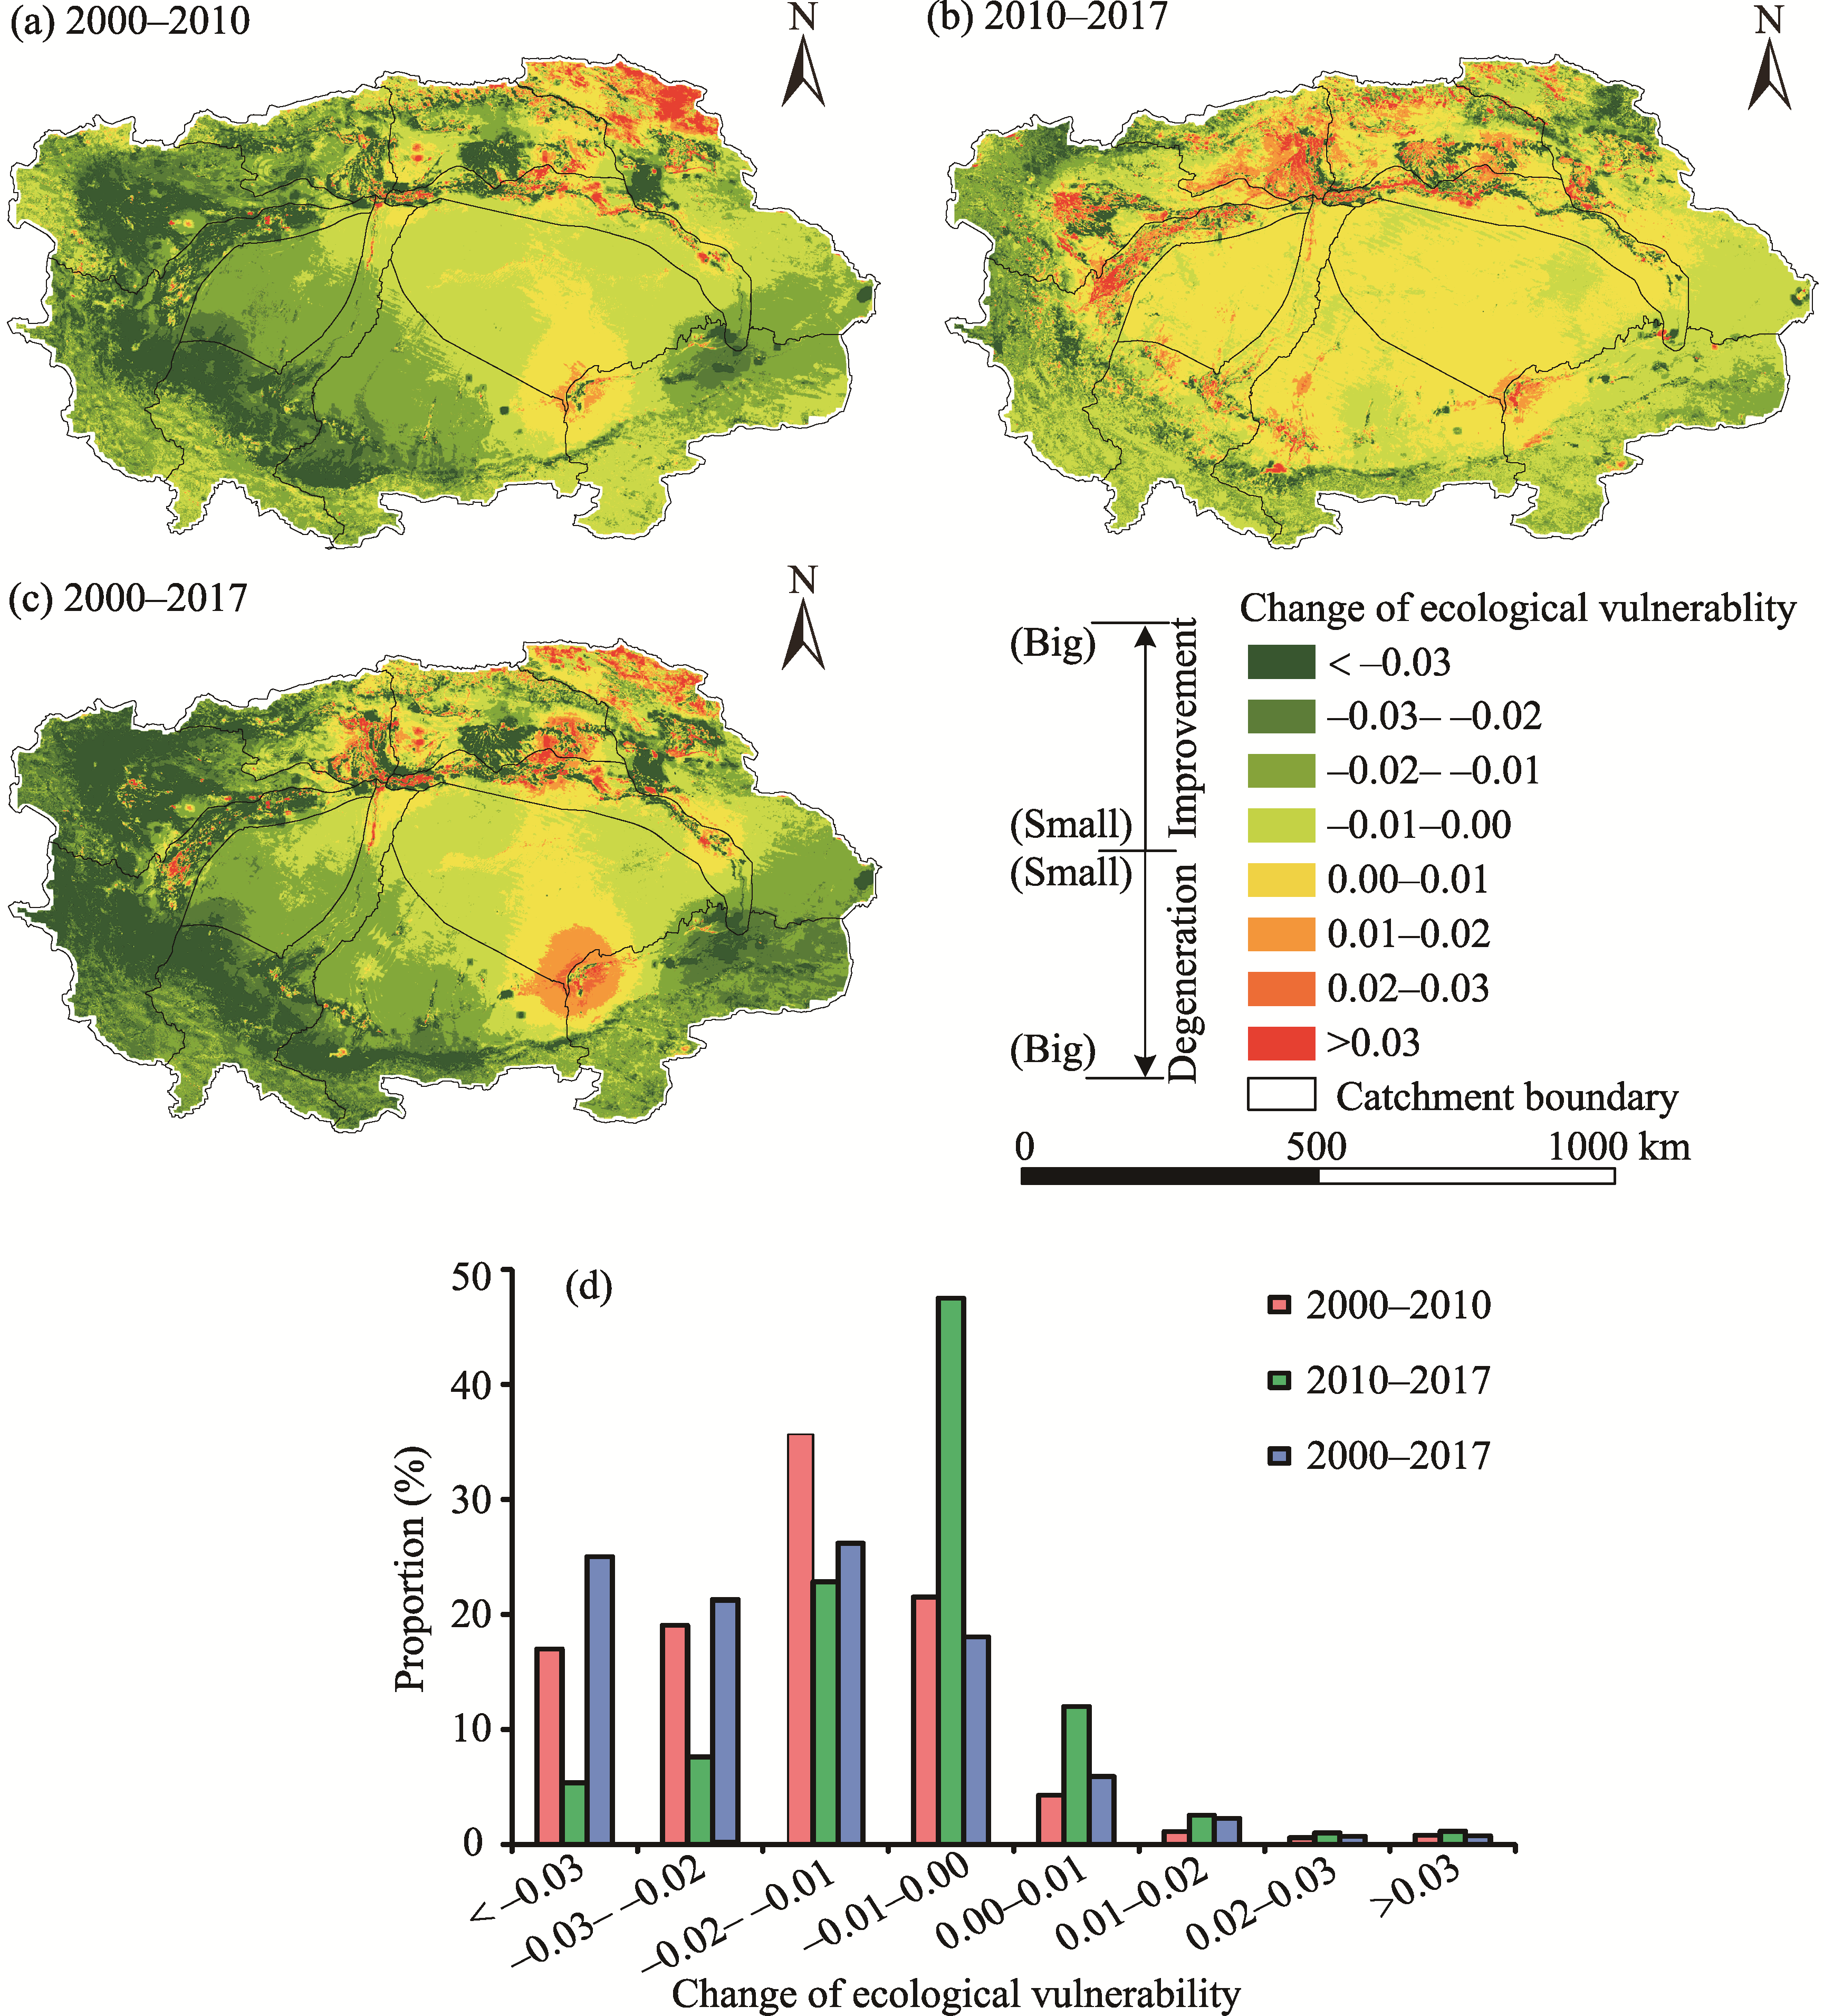
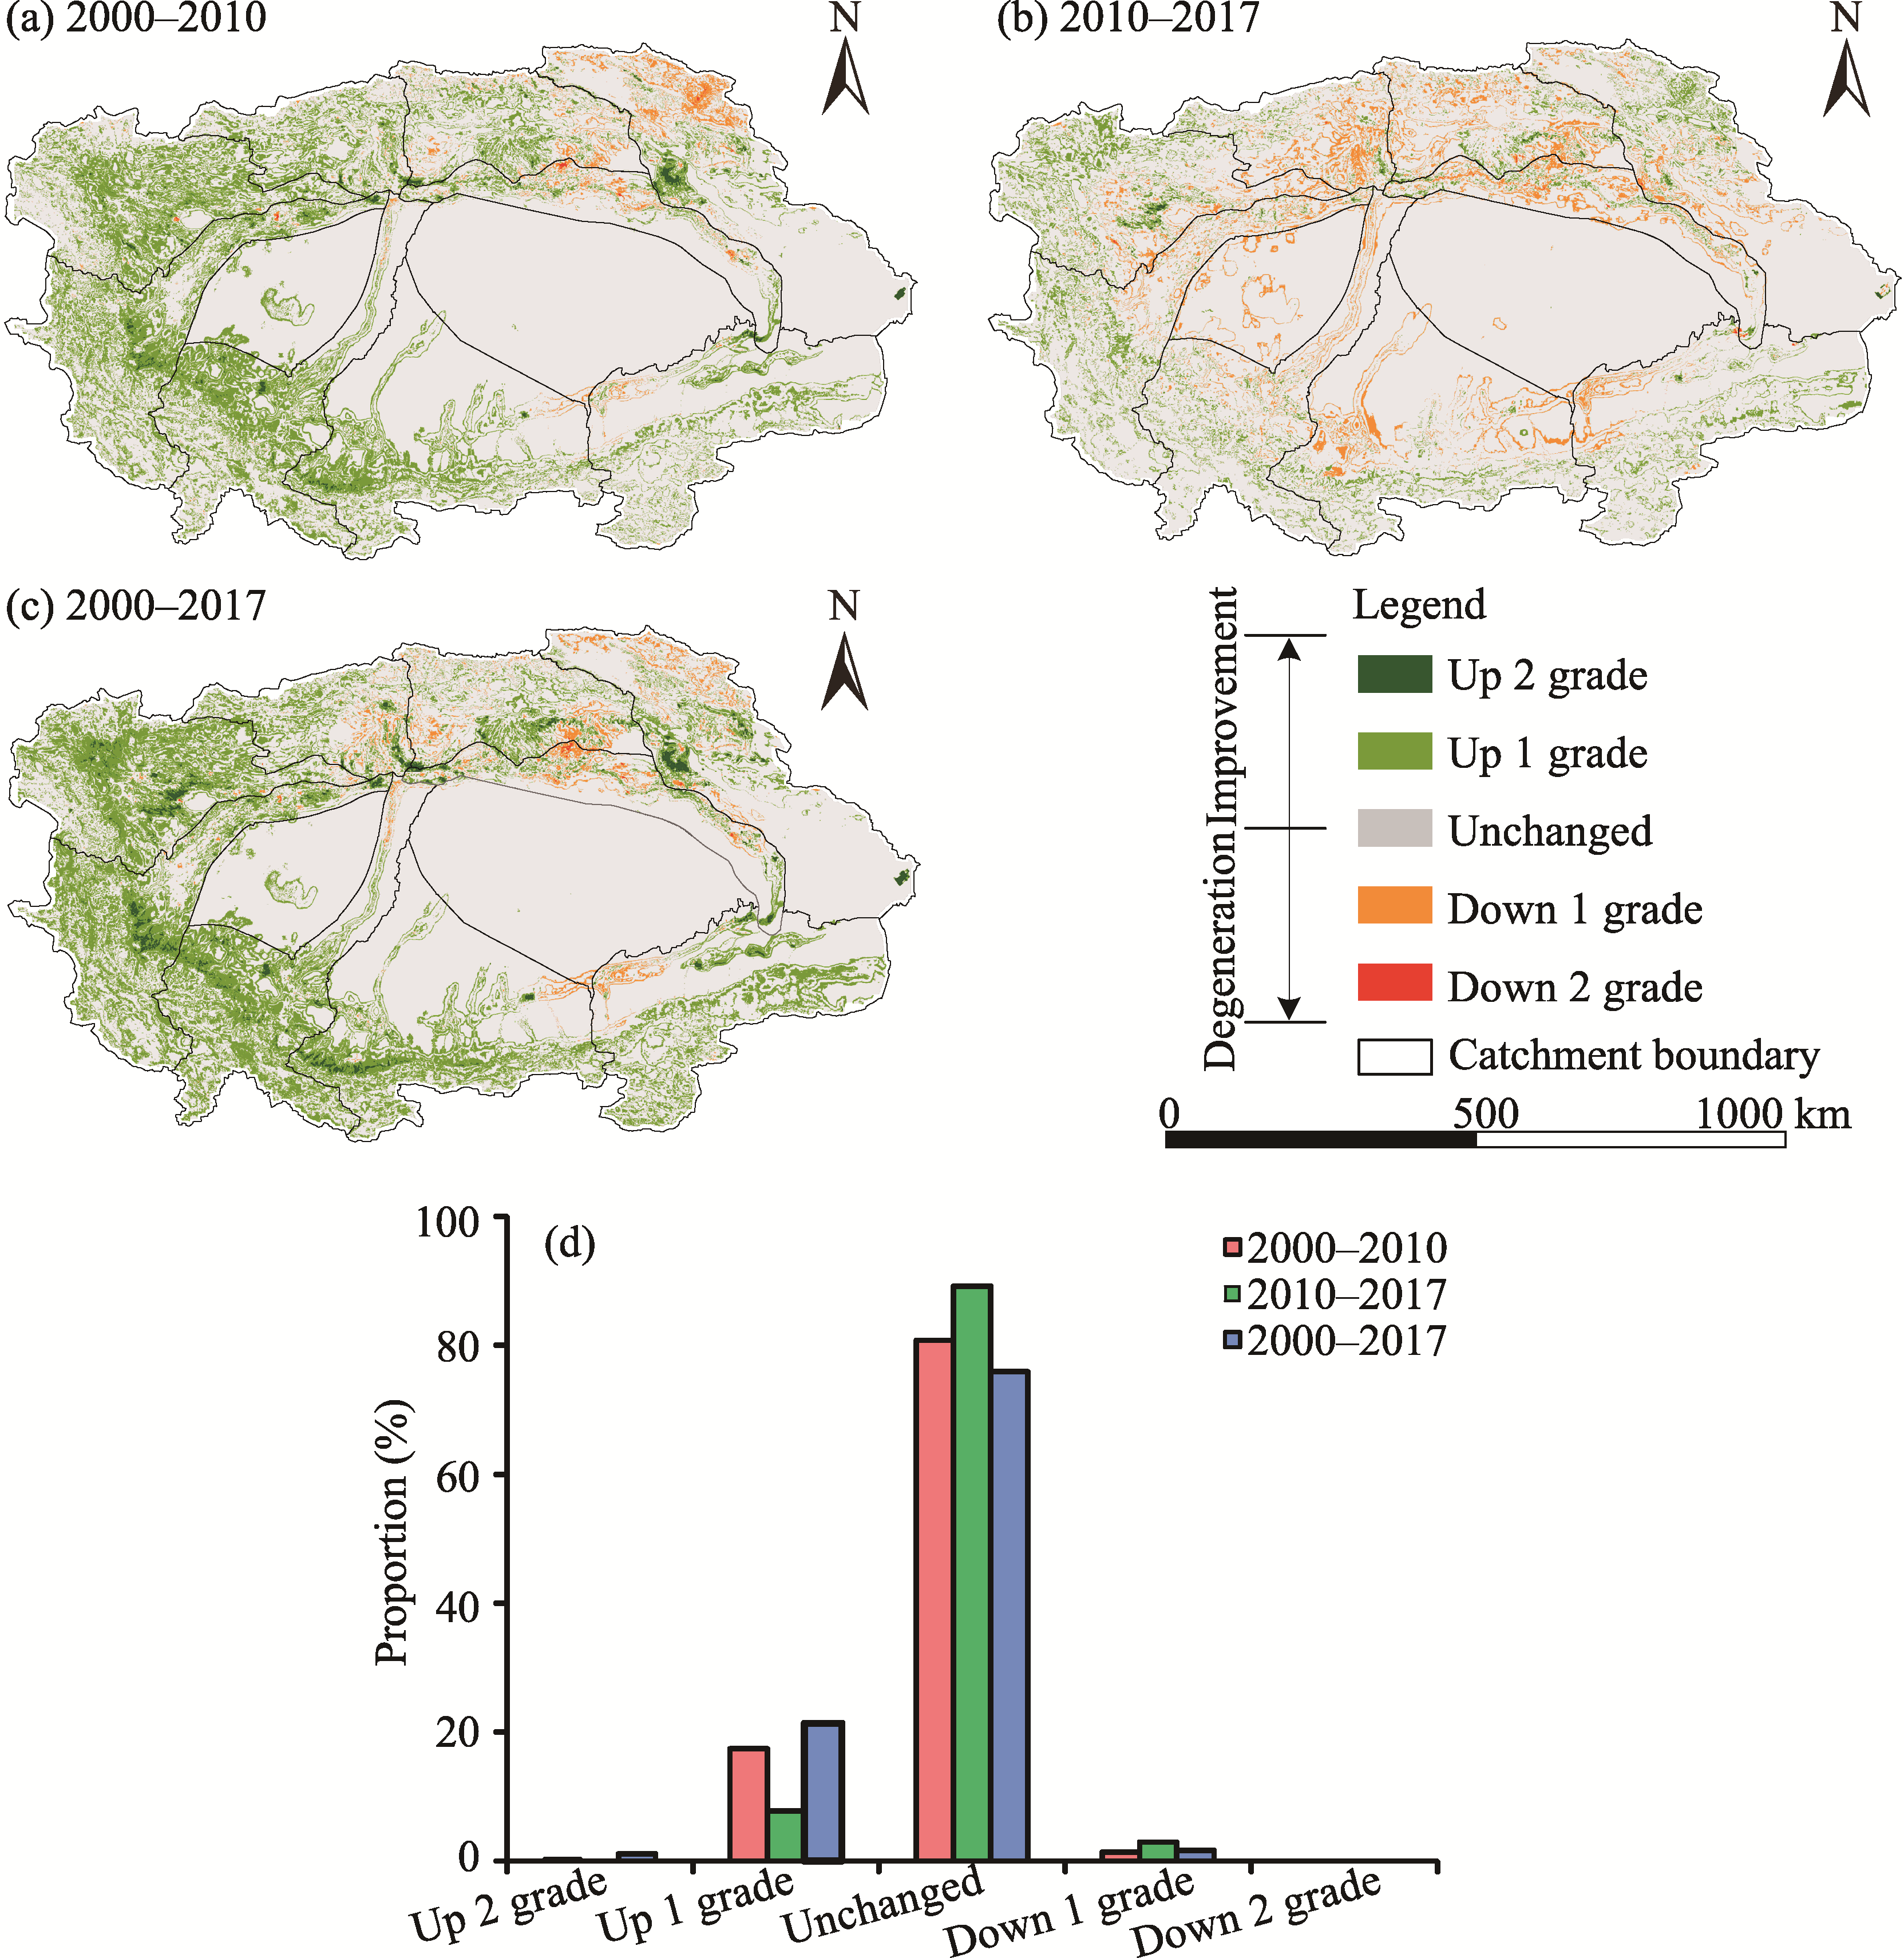
Abstract As the largest inland river basin of China, the Tarim River Basin (TRB), known for its various natural resources and fragile environment, has an increased risk of ecological crisis due to the intensive exploitation and utilization of water and land resources. Since the Ecological Water Diversion Project (EWDP), which was implemented in 2001 to save endangered desert vegetation, there has been growing evidence of ecological improvement in local regions, but few studies have performed a comprehensive ecological vulnerability assessment of the whole TRB. This study established an evaluation framework integrating the analytic hierarchy process (AHP) and entropy method to estimate the ecological vulnerability of the TRB covering climatic, ecological, and socioeconomic indicators during 2000-2017. Based on the geographical detector model, the importance of ten driving factors on the spatial-temporal variations of ecological vulnerability was explored. The results showed that the ecosystem of the TRB was fragile, with more than half of the area (57.27%) dominated by very heavy and heavy grades of ecological vulnerability, and 28.40% of the area had potential and light grades of ecological vulnerability. The light grade of ecological vulnerability was distributed in the northern regions (Aksu River and Weigan River catchments) and western regions (Kashgar River and Yarkant River catchments), while the heavy grade was located in the southern regions (Kunlun Mountains and Qarqan River catchments) and the Mainstream catchment. The ecosystems in the western and northern regions were less vulnerable than those in the southern and eastern regions. From 2000 to 2017, the overall improvement in ecological vulnerability in the whole TRB showed that the areas with great ecological improvement increased by 46.11%, while the areas with ecological degradation decreased by 9.64%. The vegetation cover and potential evapotranspiration (PET) were the obvious driving factors, explaining 57.56% and 21.55% of the changes in ecological vulnerability across the TRB, respectively. In terms of ecological vulnerability grade changes, obvious spatial differences were observed in the upper, middle, and lower reaches of the TRB due to the different vegetation and hydrothermal conditions. The alpine source region of the TRB showed obvious ecological improvement due to increased precipitation and temperature, but the alpine meadow of the Kaidu River catchment in the Middle Tianshan Mountains experienced degradation associated with overgrazing and local drought. The improved agricultural management technologies had positive effects on farmland ecological improvement, while the desert vegetation in oasis-desert ecotones showed a decreasing trend as a result of cropland reclamation and intensive drought. The desert riparian vegetation in the lower reaches of the Tarim River was greatly improved due to the implementation of the EWDP, which has been active for tens of years. These results provide comprehensive knowledge about ecological processes and mechanisms in the whole TRB and help to develop environmental restoration measures based on different ecological vulnerability grades in each sub-catchment.
|
|
Received: 26 January 2021
Published: 10 August 2021
|
|
Corresponding Authors:
|
|
|
| [1] |
Amiri V, Rezaei M, Sohrabi N. 2014. Groundwater quality assessment using entropy weighted water quality index (EWQI) in Lenjanat, Iran. Environmental Earth Sciences, 72:3479-3490.
|
|
|
| [2] |
Attia A, El-Hendawy S, Al-Suhaibani N, et al. 2021. Evaluating deficit irrigation scheduling strategies to improve yield and water productivity of maize in arid environment using simulation. Agricultural Water Management, 249: 106812, doi: 10.1016/j.agwat.2021.106812.
|
|
|
| [3] |
Bai J, Shi H, Yu Q, et al. 2019. Satellite-observed vegetation stability in response to changes in climate and total water storage in Central Asia. Science of the Total Environment, 659:862-871.
|
|
|
| [4] |
Bao A M, Huang Y, Ma Y G, et al. 2017. Assessing the effect of EWDP on vegetation restoration by remote sensing in the lower reaches of Tarim River. Ecological Indicators, 74:261-275.
|
|
|
| [5] |
Beroya-Eitner,M A, 2016. Ecological vulnerability indicators. Ecological Indicators, 60:329-334.
|
|
|
| [6] |
Bestelmeyer B T, Okin G S, Duniway M C, et al. 2015. Desertification, land use, and the transformation of global drylands. Frontiers in Ecology and the Environment, 13:28-36.
|
|
|
| [7] |
Chen Y N, Li W H, Xu C C, et al. 2007. Effects of climate change on water resources in Tarim River Basin, Northwest China. Journal of Environmental Sciences, 19(4):488-493.
|
|
|
| [8] |
Chen Y N, Chen Y P, Xu C C, et al. 2010. Effects of ecological water conveyance on groundwater dynamics and riparian vegetation in the lower reaches of Tarim River, China. Hydrological Processes, 24:170-177.
|
|
|
| [9] |
Department of Water Resources of Xinjiang Uygur Autonomous Region. 2000. Xinjiang Water Resources Bulletin. [2020-09-01].http://slt.xinjiang.gov.cn/ . (in Chinese)
|
|
|
| [10] |
Department of Water Resources of Xinjiang Uygur Autonomous Region. 2010. Xinjiang Water Resources Bulletin. [2020-09-01].http://slt.xinjiang.gov.cn/ . (in Chinese)
|
|
|
| [11] |
Department of Water Resources of Xinjiang Uygur Autonomous Region. 2017. Xinjiang Water Resources Bulletin. [2020-09-01].http://slt.xinjiang.gov.cn/ . (in Chinese)
|
|
|
| [12] |
Deng H, Chen Y, Li Q, et al. 2019. Loss of terrestrial water storage in the Tianshan mountains from 2003 to 2015. International Journal of Remote Sensing, 1608392, doi: 10.1080/01431161.2019.1608392.
|
|
|
| [13] |
Deng M J, Zhou H Y, Xu H L, et al. 2016, Research on the ecological operation in the lower reaches of Tarim River based on water conveyance. Scientia Sinica Technologica, 46:864-876. (in Chinese)
|
|
|
| [14] |
Dong Q, Wang W, Shao Q, et al. 2020. The response of reference evapotranspiration to climate change in Xinjiang, China: Historical changes, driving forces, and future projections. International Journal of Climatology, 40:235-254.
|
|
|
| [15] |
Du Y W, Gao K. 2020. Ecological security evaluation of marine ranching with AHP-entropy-based TOPSIS: A case study of Yantai, China. Marine Policy, 122: 104223, doi: 10.1016/j.marpol.2020.104223.
|
|
|
| [16] |
Dzeroski S. 2001. Applications of symbolic machine learning to ecological modelling. Ecological Modelling, 146:263-273.
|
|
|
| [17] |
Enea M, Salemi G. 2001. Fuzzy approach to the environmental impact evaluation. Ecological Modelling, 136:131-147.
|
|
|
| [18] |
Fang S, Yan J, Che M, et al. 2013. Climate change and the ecological responses in Xinjiang, China: Model simulations and data analyses. Quaternary International, 311:108-116.
|
|
|
| [19] |
Groisman P, Bulygina O, Henebry G, et al. 2018. Dryland belt of Northern Eurasia: contemporary environmental changes and their consequences. Environmental Research Letters, 13: 115008, doi: 10.1088/1748-9326/aae43c.
|
|
|
| [20] |
Guo B, Zang W Q, Luo W. 2020. Spatial-temporal shifts of ecological vulnerability of Karst Mountain ecosystem-impacts of global change and anthropogenic interference. Science of the Total Environment, 741: 140256, doi: 10.1016/j.scitotenv.2020.140256.
|
|
|
| [21] |
Guo H, Jiapaer G, Bao A M, et al. 2017. Effects of the Tarim River's middle stream water transport dike on the fractional cover of desert riparian vegetation. Ecological Engineering, 99:333-342.
|
|
|
| [22] |
Han J J, Wang J P, Liang C, et al. 2021. Driving factors of desertification in Qaidam Basin, China: An 18-year analysis using the geographic detector model. Ecological Indicators, 124: 107404, doi: 10.1016/j.ecolind.2021.107404.
|
|
|
| [23] |
Han S J, Hu H P, Yang D W, et al. 2011. Irrigation impact on annual water balance of the oases in Tarim Basin, Northwest China. Hydrological Processes, 25:167-174.
|
|
|
| [24] |
Hao X M, Li W H. 2014. Impacts of ecological water conveyance on groundwater dynamics and vegetation recovery in the lower reaches of the Tarim River in northwest China. Environmental Monitoring and Assessment, 186:7605-7616.
|
|
|
| [25] |
He B B, Sheng Y, Cao W, et al. 2020. Characteristics of climate change in northern Xinjiang in 1961-2017, China. Chinese Geographical Science, 30(02):249-265.
|
|
|
| [26] |
He P X, Sun Z J, Han Z M, et al. 2021. Dynamic characteristics and driving factors of vegetation greenness under changing environments in Xinjiang, China. Environmental Science and Pollution Research, doi: 10.1007/s11356-021-13721-z.
|
|
|
| [27] |
Hinkel J, 2011. "Indicators of vulnerability and adaptive capacity": Towards a clarification of the science-policy interface. Global Environmental Change, 21(1):198-208.
|
|
|
| [28] |
Huang J P, Yu H P, Guan X D, et al. 2016. Accelerated dryland expansion under climate change. Nature Climate Change, 6:166-171.
|
|
|
| [29] |
Jiapaer G, Liang S L, Yi Q X, et al. 2015. Vegetation dynamics and responses to recent climate change in Xinjiang using leaf area index as an indicator. Ecological Indicators, 58:64-76.
|
|
|
| [30] |
Lei Y, Jiang D, Yang X H, et al. 2007. The water distribution model application based on spatial information technology. Geo-Information Science, 9:64-69. (in Chinese)
|
|
|
| [31] |
Li Z, Chen Y N, Shen Y J, et al. 2013. Analysis of changing pan evaporation in the arid region of Northwest China. Water Resources Research, 49:2205-2212.
|
|
|
| [32] |
Li Z H, Shi X G, Tang Q H, et al. 2020. Partitioning the contributions of glacier melt and precipitation to the 1971-2010 runoff increases in a headwater basin of the Tarim River. Journal of Hydrology, 583: 124579, doi: 10. 1016/jjhydrol.2020.124579.
|
|
|
| [33] |
Ling H B, Guo B, Zhang G P, et al. 2019. Evaluation of the ecological protective effect of the "large basin" comprehensive management system in the Tarim River basin, China. The Science of the total environment, 650:1696-1706.
|
|
|
| [34] |
Liston G E, Elder K. 2006. A meteorological distribution system for high-resolution terrestrial modeling (MicroMet). Journal of Hydrometeorology, 7:217-234.
|
|
|
| [35] |
Liu Y, Li L H, Chen X, et al. 2018. Temporal-spatial variations and influencing factors of vegetation cover in Xinjiang from 1982 to 2013 based on GIMMS-NDVI3g. Global and Planetary Change, 169:145-155.
|
|
|
| [36] |
Ludovisi A. 2014. Effectiveness of entropy-based functions in the analysis of ecosystem state and development. Ecological Indicators, 36:617-623.
|
|
|
| [37] |
Nachtergaele F, Velthuizen H V, Verelst L, et al. 2009. Harmonized World Soil Database (version 1.1). FAO, Rome, Italy and IIASA, Laxenburg, Austria.
|
|
|
| [38] |
Nandy S, Singh C, Das K K, et al. 2015. Environmental vulnerability assessment of eco-development zone of Great Himalayan National Park, Himachal Pradesh. Ecological Indicators, 57:182-195.
|
|
|
| [39] |
Nguyen A K, Liou Y A, Li M H, et al. 2016. Zoning eco-environmental vulnerability for environmental management and protection. Ecological Indicators, 69:100-117.
|
|
|
| [40] |
Nyimbili P H, Erden T. 2020. A hybrid approach integrating Entropy-AHP and GIS for suitability assessment of urban emergency facilities. International Journal of Geo-Information, 9: 419, doi: 10.3390/ijgi9070419.
|
|
|
| [41] |
Pan G B, Xu Y P, Yu Z H, et al. 2015. Analysis of river health variation under the background of urbanization based on entropy weight and matter-element model: A case study in Huzhou City in the Yangtze River Delta, China. Environmental Research, 139:31-35.
|
|
|
| [42] |
Renard K G, Foster G R, Weesies G A. et al. 1991. RUSLE: Revised universal soil loss equation. Journal of Soil and Water Conservation, 46(1):30-33.
|
|
|
| [43] |
Saaty T L, 2001. The analytic hierarchy process. In: Gass S I, Harris C M. Encyclopedia of Operations Research and Management Science. New York: Springer,287.
|
|
|
| [44] |
Silva M M, Poleto T, Lucio C E S, et al. 2016. A grey theory based approach to big data risk management using FMEA. Mathematical Problems in Engineering, 9175418, doi: 10.1155/2016/9175418.
|
|
|
| [45] |
Shi Y F, Shen Y P, Kang E, et al. 2007. Recent and future climate change in northwest China. Climatic Change, 80:379-393.
|
|
|
| [46] |
Shi Y S, Li J Q, Xie M Q, 2018. Evaluation of the ecological sensitivity and security of tidal flats in Shanghai. Ecological Indicators, 85:729-741.
|
|
|
| [47] |
Wang J F, Zhang T L, Fu B J, 2016. A measure of spatial stratified heterogeneity. Ecological indicators, 67:250-256.
|
|
|
| [48] |
Wang X L, Luo Y, Sun L, et al. 2021. Different climate factors contributing for runoff increases in the high glacierized tributaries of Tarim River Basin, China. Journal of Hydrology: Regional Studies, 36: 100845, doi: 10.1016/j.ejrh.2021.100845.
|
|
|
| [49] |
Wei S G, Dai Y J, Liu B Y, et al. 2012. A soil particle-size distribution dataset for regional land and climate modelling in China. Geoderma, 171:85-91.
|
|
|
| [50] |
Williams L R R, Kaputska L A. 2000. Ecosystem vulnerability: a complex interface with technical components. Environmental Toxicology and Chemistry, 19:1055-1058.
|
|
|
| [51] |
Wu B F, Zeng Y, Qian J K. 2017. Land Cover Atlas of the People's Republic of China (1:1000,000). Beijing: SinoMaps Press. (in Chinese)
|
|
|
| [52] |
Xinjiang Uygur Autonomous Region Bureau of Statistics. 2000-2017. Xinjiang Statistical Yearbook. Beijing: China Statistics Press. (in Chinese)
|
|
|
| [53] |
Xu H L, Ye M, Li J M. 2009. The ecological characteristics of the riparian vegetation affected by river overflowing disturbance in the lower Tarim River. Environmental Geology, 58:1749-1755.
|
|
|
| [54] |
Xu Z, Liu Z, Fu G, et al. 2010. Trends of major hydroclimatic variables in the Tarim River basin during the past 50 years. Journal of Arid Environments, 74:256-267.
|
|
|
| [55] |
Xue L Q, Jing W, Zhang L C, et al. 2018. Spatiotemporal analysis of ecological vulnerability and management in the Tarim River Basin, China. Science of the Total Environment, 649:876-888.
|
|
|
| [56] |
Yao J Q, Zhao Y, Chen Y N, et al. 2018. Multi-scale assessments of droughts: A case study in Xinjiang, China. Science of the Total Environment, 630:444-452.
|
|
|
| [57] |
Yao J Q, Hu W F, Chen Y N, et al. 2019. Hydro-climatic changes and their impacts on vegetation in Xinjiang, Central Asia, Science of the Total Environment, 660:724-732.
|
|
|
| [58] |
Yu T, Bao A M, Xu W Q, et al. 2020. Exploring variability in landscape ecological risk and quantifying its driving factors in the Amu Darya Delta. International Journal of Environmental Research and Public Health, 17: 79, doi: 10.3390/ijerph17010079.
|
|
|
| [59] |
Yuan X L, Li L H, Chen X. 2015. Increased grass NDVI under contrasting trends of precipitation change over North China during 1982-2011. Remote Sensing Letters, 6:69-77.
|
|
|
| [60] |
Zhang F, Wang C H, Wang Z H. 2020. Response of natural vegetation to climate in dryland ecosystems: a comparative study between Xinjiang and Arizona. Remote Sensing, 12: 3567, doi: 10.3390/rs1221356.
|
|
|
| [61] |
Zhang L, Li X S, Yuan Q Z, et al. 2014. Object-based approach to national land cover mapping using HJ satellite imagery, Journal of Applied Remote Sensing, 8: 083686, doi: 10.1117/1.JRS.8.083686.
|
|
|
| [62] |
Zhang Z, Hu H, Tian F, et al. 2014. Groundwater dynamics under water-saving irrigation and implications for sustainable water management in an oasis: Tarim River basin of western China. Hydrology and Earth System Sciences, 18:3951-3967.
|
|
|
| [63] |
Zhao J C, Ji G X, Tian Y, et al. 2018. Environmental vulnerability assessment for mainland China based on entropy method. Ecological Indicators, 91:410-422.
|
|
|
| [64] |
Zhou H H, Chen Y N, Zhu C G, et al. 2020. Climate change may accelerate the decline of desert riparian forest in the lower Tarim River, Northwestern China: Evidence from tree-rings of Populus euphratica. Ecological Indicators, 111: 105997, doi: 10.1016/j.ecolind.2019.105997.
|
|
|
| [65] |
Zhu Y X, Tian D Z, Yan F. 2020. Effectiveness of entropy weight method in decision-making. Mathematical Problems in Engineering, 2020, doi: 10.1155/2020/3564835.
|
|
|
| [66] |
Zou T H, Yoshino K. 2017. Environmental vulnerability evaluation using a spatial principal components approach in the Daxing'anling region, China. Ecological Indicators, 78:405-415.
|
|
|
|
Viewed |
|
|
|
Full text
|
|
|
|
|
Abstract
|
|
|
|
|
Cited |
|
|
|
|
| |
Shared |
|
|
|
|
| |
Discussed |
|
|
|
|