|
|
|
| Synergistic effects of multiple driving factors on the runoff variations in the Yellow River Basin, China |
WANG Junjie1, SHI Bing1,*( ), ZHAO Enjin1,2, CHEN Xuguang1,*(), YANG Shaopeng3 ), ZHAO Enjin1,2, CHEN Xuguang1,*(), YANG Shaopeng3 |
1 College of Engineering, Ocean University of China, Qingdao 266100, China
2 Hubei Key Laboratory of Marine Geological Resources, China University of Geosciences, Wuhan 430074, China
3 College of Ocean Science and Engineering, Shandong University of Science and Technology, Qingdao 266590, China |
|
|
|
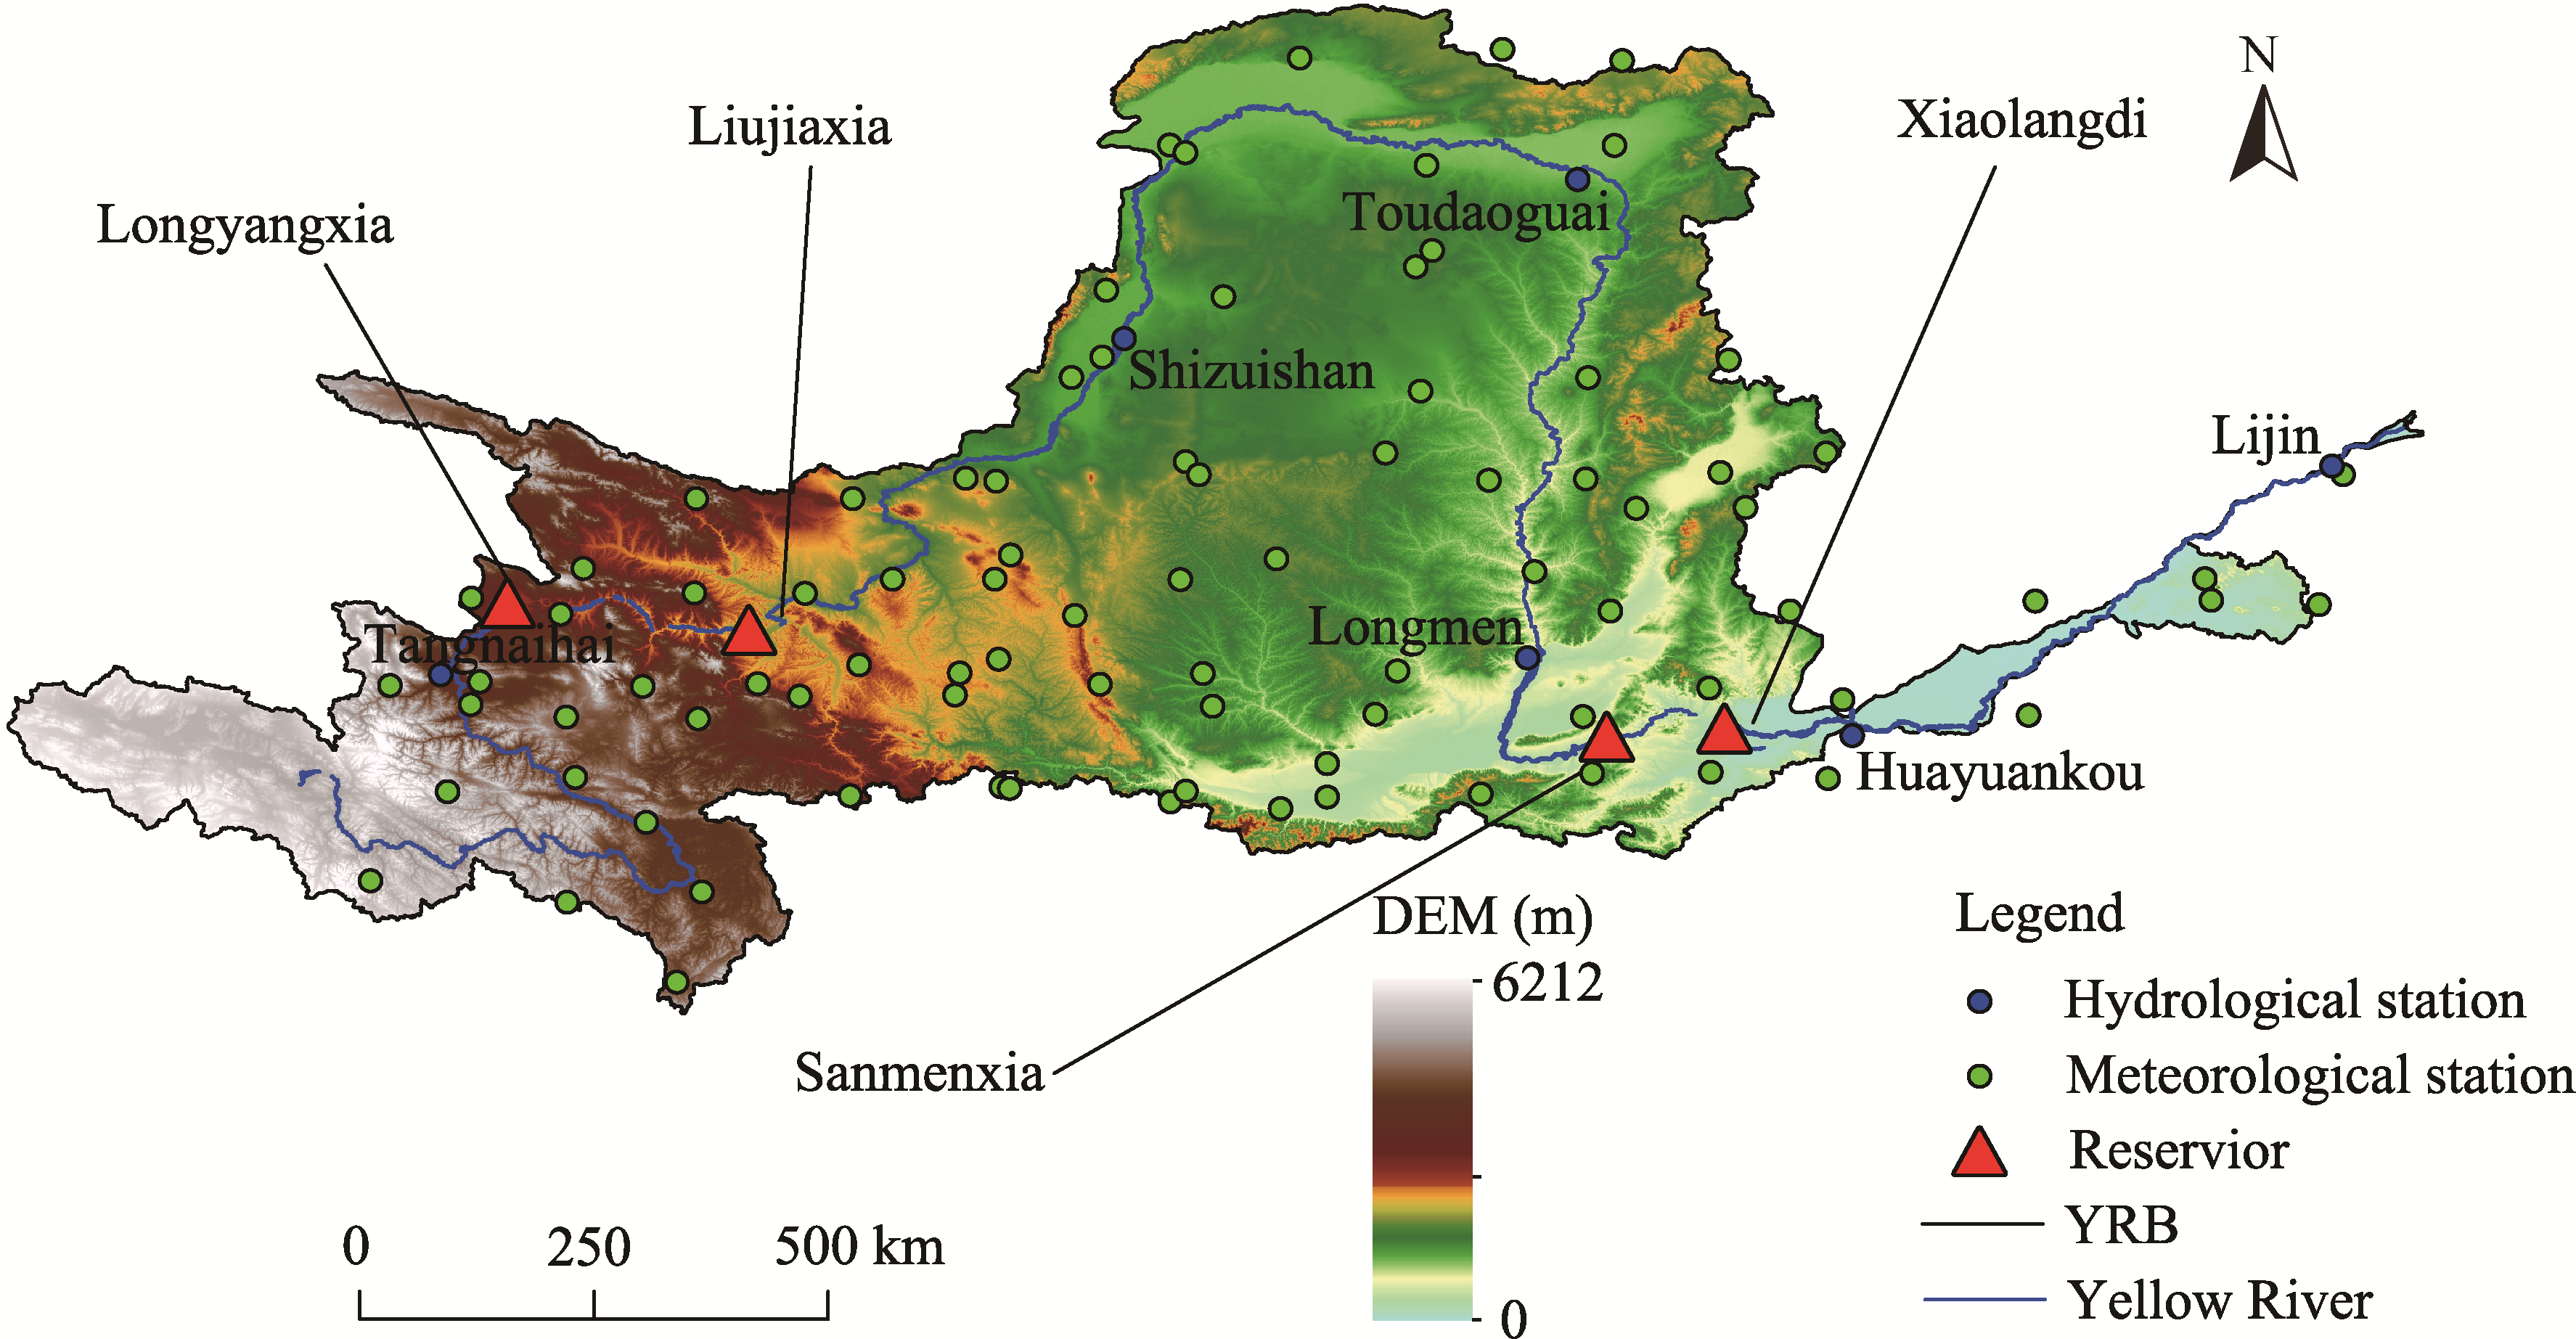
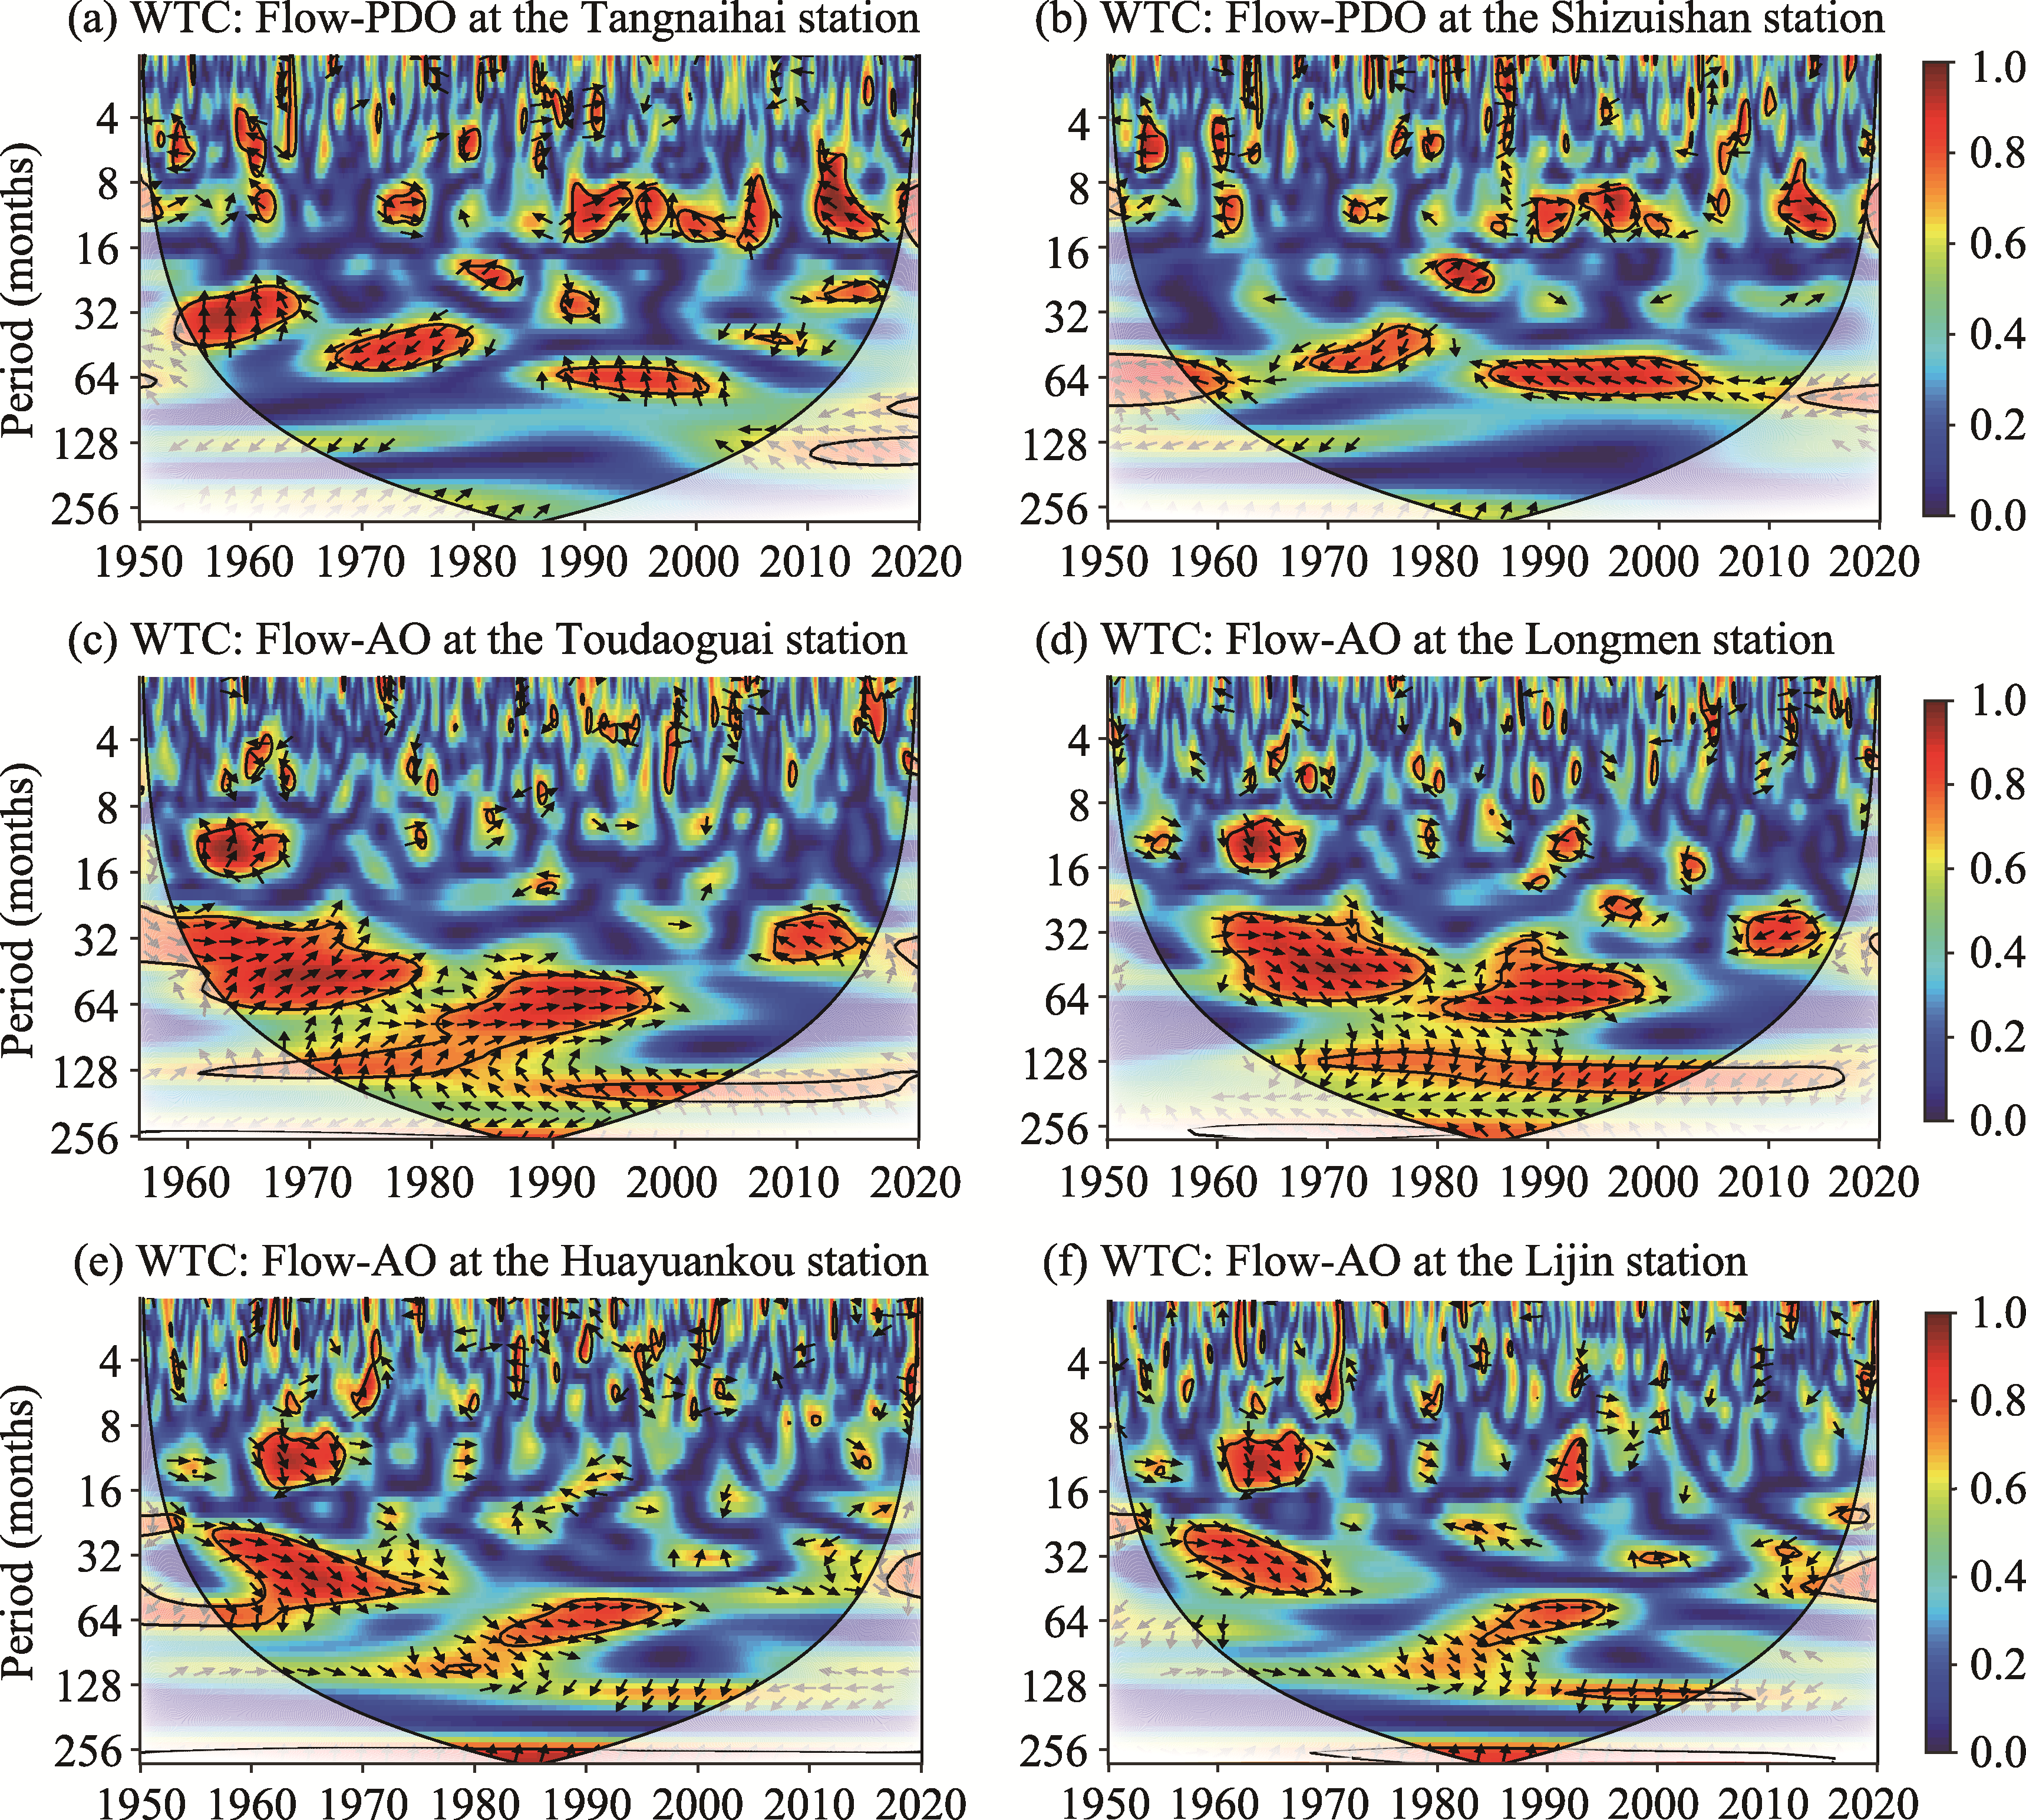
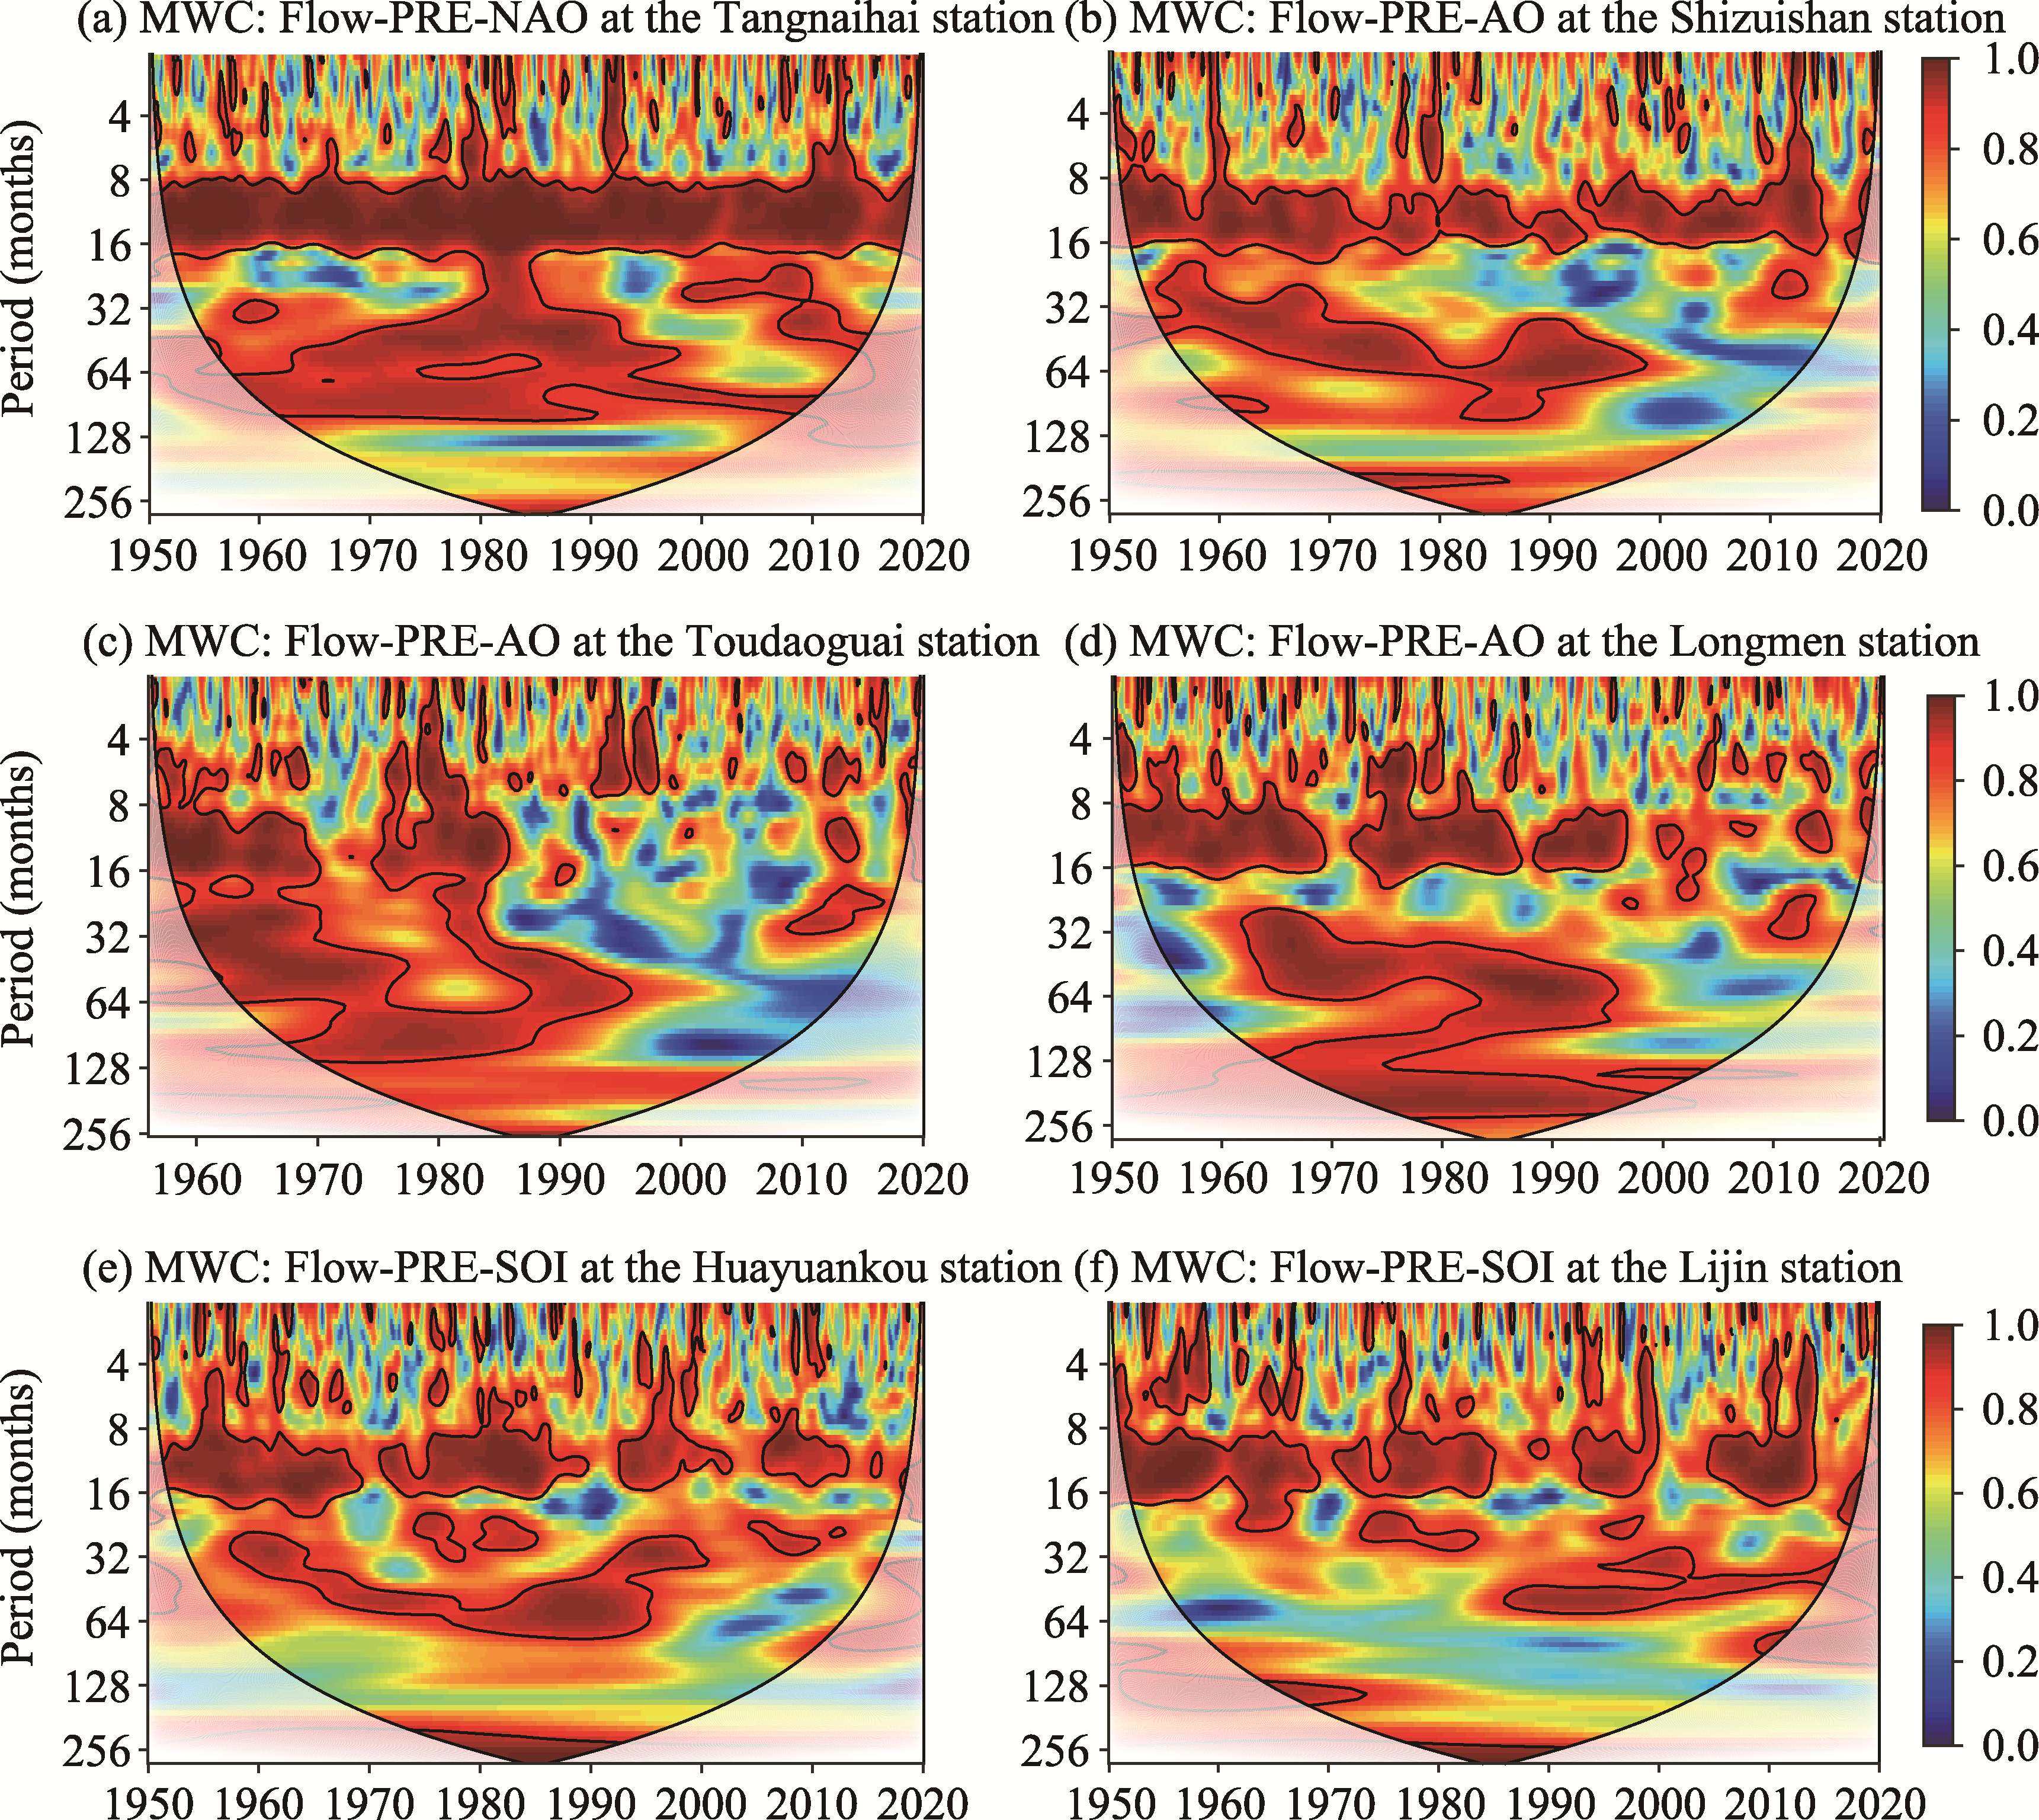
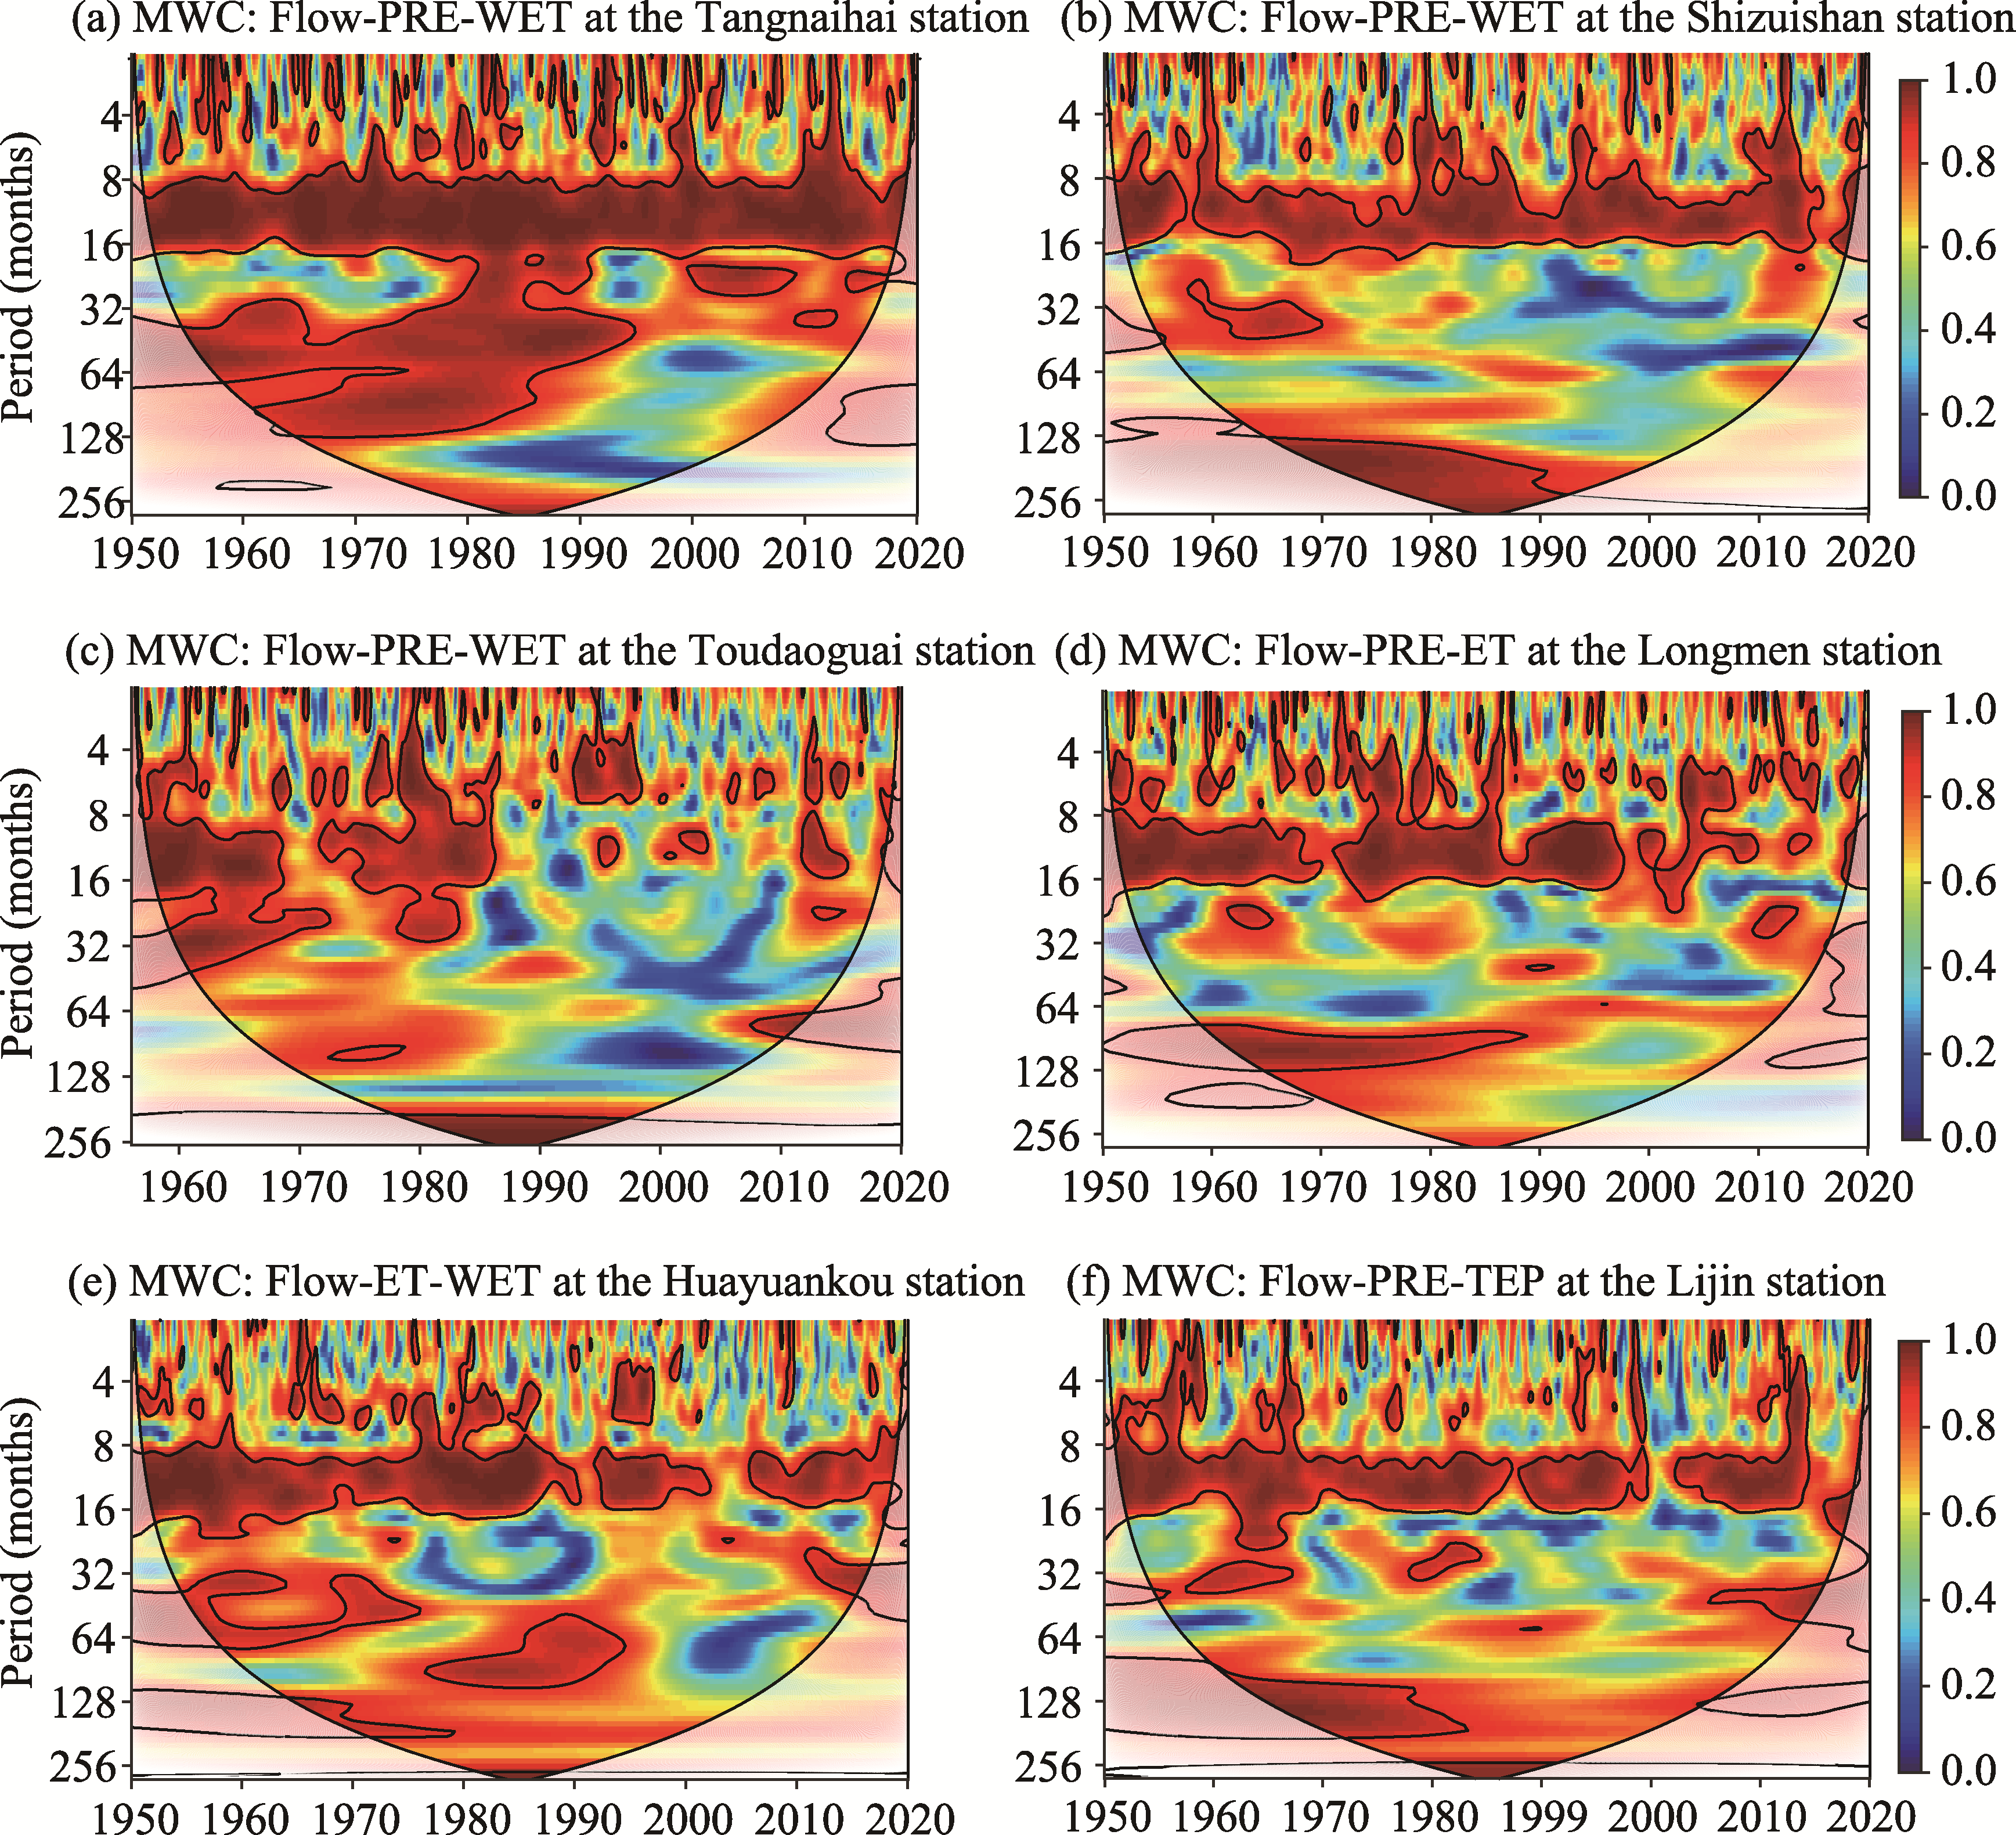
Abstract River runoff plays an important role in watershed ecosystems and human survival, and it is controlled by multiple environmental factors. However, the synergistic effects of various large-scale circulation factors and meteorological factors on the runoff on different time-frequency scales have rarely been explored. In light of this, the underlying mechanism of the synergistic effects of the different environmental factors on the runoff variations was investigated in the Yellow River Basin of China during the period 1950-2019 using the bivariate wavelet coherence (WTC) and multiple wavelet coherence (MWC) methods. First, the continuous wavelet transform (CWT) method was used to analyze the multiscale characteristics of the runoff. The results of the CWT indicate that the runoff exhibited significant continuous or discontinuous annual and semiannual oscillations during the study period. Scattered inter-annual time scales were also observed for the runoff in the Yellow River Basin. The meteorological factors better explained the runoff variations on seasonal and annual time scales. The average wavelet coherence (AWC) and the percent area of the significant coherence (PASC) between the runoff and individual meteorological factors were 0.454 and 19.89%, respectively. The circulation factors mainly regulated the runoff on the inter-annual and decadal time scales with more complicated phase relationships due to their indirect effects on the runoff. The AWC and PASC between the runoff and individual circulation factors were 0.359 and 7.31%, respectively. The MWC analysis revealed that the synergistic effects of multiple factors should be taken into consideration to explain the multiscale characteristic variations of the runoff. The AWC or MWC ranges were 0.320-0.560, 0.617-0.755, and 0.819-0.884 for the combinations of one, two, and three circulation and meteorological factors, respectively. The PASC ranges were 3.53%-33.77%, 12.93%-36.90%, and 20.67%-39.34% for the combinations one, two, and three driving factors, respectively. The combinations of precipitation, evapotranspiration (or the number of rainy days), and the Arctic Oscillation performed well in explaining the variability in the runoff on all time scales, and the average MWC and PASC were 0.847 and 28.79%, respectively. These findings are of great significance for improving our understanding of hydro-climate interactions and water resources prediction in the Yellow River Basin.
|
|
Received: 22 February 2021
Published: 10 August 2021
|
|
Corresponding Authors:
|
|
|
| [1] |
Arthington Á H, Naiman R J, Mcclain M E, et al. 2010. Preserving the biodiversity and ecological services of rivers: new challenges and research opportunities. Freshwater Biology, 55(1):1-16.
|
|
|
| [2] |
Chen L, Chang J X, Wang Y M, et al. 2019. The regional asymmetric effect of increased daily extreme temperature on the streamflow from a multiscale perspective: A case study of the Yellow River Basin, China. Atmospheric Research, 228:137-151.
|
|
|
| [3] |
Cheng Q P, Zuo X A, Zhong F L, et al. 2019. Runoff variation characteristics, association with large-scale circulation and dominant causes in the Heihe River Basin, Northwest China. Science of the Total Environment, 688:361-379.
|
|
|
| [4] |
Chu H B, Wei J H, Qiu J, et al. 2019. Identification of the impact of climate change and human activities on rainfall-runoff relationship variation in the Three-River Headwaters region. Ecological Indicators, 106: 105516, doi: 10.1016/j.ecolind.2019.105516.
|
|
|
| [5] |
Croley II T E, Hartmann H C. 1985. Resolving thiessen polygons. Journal of Hydrology, 76(3-4):363-379.
|
|
|
| [6] |
Dai A G, Qian T T, Trenberth K E, et al. 2009. Changes in continental freshwater discharge from 1948 to 2004. Journal of Climate, 22(10):2773-2792.
|
|
|
| [7] |
Deser C. 2000. On the teleconnectivity of the "Arctic Oscillation". Geophysical Research Letters, 27(6):779-782.
|
|
|
| [8] |
Fang Z F, Bogena H, Kollet S, et al. 2015. Spatio-temporal validation of long-term 3D hydrological simulations of a forested catchment using empirical orthogonal functions and wavelet coherence analysis. Journal of Hydrology, 529:1754-1767.
|
|
|
| [9] |
Feng J, Wei W, Pan D L. 2020. Effects of rainfall and terracing-vegetation combinations on water erosion in a loess hilly area, China. Journal of Environmental Management, 261: 110247, doi: 10.1016/j.jenvman.2020.110247.
|
|
|
| [10] |
Gerten D, Rost S, Bloh W V, et al. 2008. Causes of change in 20th century global river discharge. Geophysical Research Letters, 35(20), doi: 10.1029/2008GL035258.
|
|
|
| [11] |
Givati A, Rosenfeld D. 2013. The Arctic Oscillation, climate change and the effects on precipitation in Israel. Atmospheric Research, 132:114-124.
|
|
|
| [12] |
Gobena A K, Gan T Y. 2009. The role of Pacific climate on low-frequency hydroclimatic variability and predictability in southern Alberta, Canada. Journal of Hydrometeorology, 10(6):1465-1478.
|
|
|
| [13] |
Gong D Y, Wang S W. 2003. Influence of Arctic Oscillation on winter climate over China. Journal of Geographical Sciences, 13(2):208-212.
|
|
|
| [14] |
Gong G, Entekhabi D, Cohen J. 2002. A large-ensemble model study of the wintertime AO-NAO and the role of interannual snow perturbations. Journal of Climate, 15(23):3488-3499.
|
|
|
| [15] |
Grinsted A, Moore J C, Jevrejeva S. 2004. Application of the cross wavelet transform and wavelet coherence to geophysical time series. Nonlinear Processes in Geophysics, 11:561-566.
|
|
|
| [16] |
Hare S R, Mantua N J. 2000. Empirical evidence for North Pacific regime shifts in 1977 and 1989. Progress in Oceanography, 47(2-4):103-145.
|
|
|
| [17] |
Hu W, Si B C. 2016. Multiple wavelet coherence for untangling scale-specific and localized multivariate relationships in geosciences. Hydrology and Earth System Sciences, 20(8):3183-3191.
|
|
|
| [18] |
Hu W, Si B C, Biswas A, et al. 2017. Temporally stable patterns but seasonal dependent controls of soil water content: Evidence from wavelet analyses. Hydrological Processes, 31(21):3697-3707.
|
|
|
| [19] |
Huo J Y, Liu C J, Yu X X, et al. 2020. Effects of watershed char and climate variables on annual runoff in different climatic zones in China. Science of The Total Environment, 754: 142157, doi: 10.1016/j.scitotenv.2020.142157.
|
|
|
| [20] |
Hurrell J W. 1996. Influence of variations in extratropical wintertime teleconnections on Northern Hemisphere temperature. Geophysical Research Letters, 23(6):665-668.
|
|
|
| [21] |
Jevrejeva S, Moore J, Grinsted A. 2003. Influence of the Arctic Oscillation and El Niño‐Southern Oscillation (ENSO) on ice conditions in the Baltic Sea: The wavelet approach. Journal of Geophysical Research: Atmospheres, 108(D21), doi: 10.1029/2003JD003417.
|
|
|
| [22] |
Jones P D, Jónsson T, Wheeler D. 1997. Extension to the North Atlantic Oscillation using early instrumental pressure observations from Gibraltar and south-west Iceland. International Journal of Climatology: A Journal of the Royal Meteorological Society, 17(13):1433-1450.
|
|
|
| [23] |
Kong D X, Miao C Y, Wu J W, et al. 2016. Impact assessment of climate change and human activities on net runoff in the Yellow River Basin from 1951 to 2012. Ecological Engineering, 91:566-573.
|
|
|
| [24] |
Koopmans L. 1974. The Spectral Analysis of Time Series. New York: Academic Press,119-164.
|
|
|
| [25] |
Labat D, Ababou R, Mangin A. 2000. Rainfall-runoff relations for karstic springs. Part II: continuous wavelet and discrete orthogonal multiresolution analyses. Journal of Hydrology, 238(3-4):149-178.
|
|
|
| [26] |
Labat D. 2008. Wavelet analysis of the annual discharge records of the world's largest rivers. Advances in Water Resources, 31(1):109-117.
|
|
|
| [27] |
Labat D. 2010. Cross wavelet analyses of annual continental freshwater discharge and selected climate indices. Journal of Hydrology, 385(1-4):269-278.
|
|
|
| [28] |
Li B F, Shi X, Lian L S, et al. 2020. Quantifying the effects of climate variability, direct and indirect land use cover change, and human activities on runoff. Journal of Hydrology, 584: 124684, doi: 10.1016/j.jhydrol.2020.124684.
|
|
|
| [29] |
Li H Z, Zhang Q, Singh V P, et al. 2017a. Hydrological effects of cropland and climatic changes in arid and semi-arid river basins: a case study from the Yellow River basin, China. Journal of Hydrology, 549:547-557.
|
|
|
| [30] |
Li L, Shen H Y, Dai S, et al. 2012. Response of runoff to climate change and its future tendency in the source region of Yellow River. Journal of Geographical Sciences, 22(3):431-440.
|
|
|
| [31] |
Li Z W, Xu X L, Xu C H, et al. 2017b. Monthly sediment discharge changes and estimates in a typical karst catchment of southwest China. Journal of Hydrology, 555:95-107.
|
|
|
| [32] |
Liu F, Chen S L, Dong P, et al. 2012. Spatial and temporal variability of water discharge in the Yellow River Basin over the past 60 years. Journal of Geographical Sciences, 22(6):1013-1033.
|
|
|
| [33] |
Liu Q, Cui B S. 2011. Impacts of climate change/variability on the streamflow in the Yellow River Basin, China. Ecological Modelling, 222(2):268-274.
|
|
|
| [34] |
Liu Y M, Lu M M, Yang H J, et al. 2020. Land-atmosphere-ocean coupling associated with the Tibetan Plateau and its climate impacts. National Science Review, 7(3):534-552.
|
|
|
| [35] |
Mantua N J, Hare S R, Zhang Y, et al. 1997. A Pacific interdecadal climate oscillation with impacts on salmon production. Bulletin of the American Meteorological Society, 78(6):1069-1080.
|
|
|
| [36] |
Montaldo N, Sarigu A. 2017. Potential links between the North Atlantic Oscillation and decreasing precipitation and runoff on a Mediterranean area. Journal of Hydrology, 553:419-437.
|
|
|
| [37] |
Murgulet D, Valeriu M, Hay R R, et al. 2017. Relationships between sea surface temperature anomalies in the Pacific and Atlantic Oceans and South Texas precipitation and streamflow variability. Journal of Hydrology, 550:726-739.
|
|
|
| [38] |
Nalley D, Adamowski J, Biswas A, et al. 2019. A multiscale and multivariate analysis of precipitation and streamflow variability in relation to ENSO, NAO and PDO. Journal of Hydrology, 574:288-307.
|
|
|
| [39] |
Ng E K, Chan J C. 2012. Geophysical applications of partial wavelet coherence and multiple wavelet coherence. Journal of Atmospheric and Oceanic Technology, 29(12):1845-1853.
|
|
|
| [40] |
Niedzielski T, Szymanowski M, Miziński B, et al. 2019. Estimating snow water equivalent using unmanned aerial vehicles for determining snow-melt runoff. Journal of Hydrology, 578: 124046, doi: 10.1016/j.jhydrol.2019.124046
|
|
|
| [41] |
Nijssen B, O'Donnell G M, Hamlet A F, et al. 2001. Hydrologic sensitivity of global rivers to climate change. Climatic Change, 50(1-2):143-175.
|
|
|
| [42] |
Notarnicola C. 2020. Hotspots of snow cover changes in global mountain regions over 2000-2018. Remote Sensing of Environment, 243: 111781, doi: 10.1016/j.rse.2020.111781.
|
|
|
| [43] |
Park T W, Ho C H, Yang S. 2011. Relationship between the Arctic Oscillation and cold surges over East Asia. Journal of Climate, 24(1):68-83.
|
|
|
| [44] |
Peng J, Chen S L, Dong P. 2010. Temporal variation of sediment load in the Yellow River basin, China, and its impacts on the lower reaches and the river delta. Catena, 83(2-3):135-147.
|
|
|
| [45] |
Piao S L, Friedlingstein P, Ciais P, et al. 2007. Changes in climate and land use have a larger direct impact than rising CO2 on global river runoff trends. Proceedings of the National Academy of Sciences, 104(39):15242--15247.
|
|
|
| [46] |
Shen Q N, Cong Z T, Lei H M. 2017. Evaluating the impact of climate and underlying surface change on runoff within the Budyko framework: A study across 224 catchments in China. Journal of Hydrology, 554:251-262.
|
|
|
| [47] |
Shi H L, Hu C H, Wang Y G, et al. 2017. Analyses of trends and causes for variations in runoff and sediment load of the Yellow River. International Journal of Sediment Research, 32(2):171-179.
|
|
|
| [48] |
Su L, Miao C Y, Borthwick A G, et al. 2017. Wavelet-based variability of Yellow River discharge at 500-, 100-, and 50-year timescales. Gondwana Research, 49:94-105.
|
|
|
| [49] |
Su L, Miao C Y, Kong D X, et al. 2018. Long-term trends in global river flow and the causal relationships between river flow and ocean signals. Journal of Hydrology, 563:818-833.
|
|
|
| [50] |
Su L, Miao C Y, Duan Q Y, et al. 2019. Multiple-wavelet coherence of world's large rivers with meteorological factors and ocean signals. Journal of Geophysical Research: Atmospheres, 124(9):4932-4954.
|
|
|
| [51] |
Sun Q H, Miao C Y, AghaKouchak A, et al. 2016. Century-scale causal relationships between global dry/wet conditions and the state of the Pacific and Atlantic Oceans. Geophysical Research Letters, 43(12):6528-6537.
|
|
|
| [52] |
Thompson D W, Wallace J M. 1998. The Arctic Oscillation signature in the wintertime geopotential height and temperature fields. Geophysical Research Letters, 25(9):1297-1300.
|
|
|
| [53] |
Thompson D W, Wallace J M. 2001. Regional climate impacts of the Northern Hemisphere annular mode. Science, 293(5527):85-89.
|
|
|
| [54] |
Tian S M, Xu M Z, Jiang E H, et al. 2019. Temporal variations of runoff and sediment load in the upper Yellow River, China. Journal of Hydrology, 568:46-56.
|
|
|
| [55] |
Torrence C, Compo G P. 1998. A practical guide to wavelet analysis. Bulletin of the American Meteorological society, 79(1):61-78.
|
|
|
| [56] |
Trenberth K E. 1997. The definition of El Niño. Bulletin of the American Meteorological Society, 78(12):2771-2778.
|
|
|
| [57] |
Vörösmarty C J, Meybeck M, Fekete B, et al. 2003. Anthropogenic sediment retention: major global impact from registered river impoundments. Global & Planetary Change, 39(1-2):169-190.
|
|
|
| [58] |
Wallace J M. 2000. North atlantic oscillatiodannular mode: Two paradigms—one phenomenon. Quarterly Journal of the Royal Meteorological Society, 126(564):791-805.
|
|
|
| [59] |
Wang H, Sun F B.2020. Variability of annual sediment load and runoff in the Yellow River for the last 100 years(1919-2018). Science of The Total Environment: 143715, doi: 10.1016/j.scitotenv.2020.143715.
|
|
|
| [60] |
Wang H J, Yang Z S, Saito Y, et al. 2006. Interannual and seasonal variation of the Huanghe (Yellow River) water discharge over the past 50 years: connections to impacts from ENSO events and dams. Global and Planetary Change, 50(3-4):212-225.
|
|
|
| [61] |
Wang J J, Shi B, Pan X Y, et al. 2020. Multi-scale characteristics of precipitation and its relationship with ENSO and AO. Journal of Coastal Research, 104(SI):23-28.
|
|
|
| [62] |
Wang S, Fu B J, Piao S L, et al. 2016. Reduced sediment transport in the Yellow River due to anthropogenic changes. Nature Geoscience, 9(1):38-41.
|
|
|
| [63] |
Wang S J, Yan M, Yan Y X, et al. 2012. Contributions of climate change and human activities to the changes in runoff increment in different sections of the Yellow River. Quaternary International, 282:66-77.
|
|
|
| [64] |
Wang S P, Zhang Z Q, McVicar T R, et al. 2012. An event-based approach to understanding the hydrological impacts of different land uses in semi-arid catchments. Journal of Hydrology, 416:50-59.
|
|
|
| [65] |
Wang W, Zhang Y Y, Tang Q H. 2020. Impact assessment of climate change and human activities on streamflow signatures in the Yellow River Basin using the Budyko hypothesis and derived differential equation. Journal of Hydrology, 591(7401): 125460, doi: 10.1016/j.jhydrol.2020.125460.
|
|
|
| [66] |
Wei W, Chang Y P, Dai Z J. 2014. Streamflow changes of the Changjiang (Yangtze) River in the recent 60 years: Impacts of the East Asian summer monsoon, ENSO, and human activities. Quaternary International, 336:98-107.
|
|
|
| [67] |
Wine M L, Zou C B. 2012. Long-term streamflow relations with riparian gallery forest expansion into tallgrass prairie in the Southern great plains, USA. Forest Ecology and Management. 266,170-179.
|
|
|
| [68] |
Wu D, Yan D H, Yang G Y, et al. 2013. Assessment on agricultural drought vulnerability in the Yellow River basin based on a fuzzy clustering iterative model. Natural hazards, 67(2):919-936.
|
|
|
| [69] |
Wu L Y, Zhang X, Hao F H, et al. 2020. Evaluating the contributions of climate change and human activities to runoff in typical semi-arid area, China. Journal of Hydrology, 590: 125555, doi: 10.1016/j.jhydrol.2020.125555
|
|
|
| [70] |
Wu Y N, Gan T Y, She Y T, et al. 2020. Five centuries of reconstructed streamflow in Athabasca River Basin, Canada: Non-stationarity and teleconnection to climate patterns. Science of The Total Environment, 746: 141330, doi: 10.1016/j.scitotenv.2020.141330
|
|
|
| [71] |
Wu Y Y, Fang H W, Huang L, et al. 2020. Changing runoff due to temperature and precipitation variations in the dammed Jinsha River. Journal of Hydrology, 582: 124500, doi: 10.1016/j.jhydrol.2019.124500
|
|
|
| [72] |
Xu K H, Milliman J D, Xu H. 2010. Temporal trend of precipitation and runoff in major Chinese Rivers since 1951. Global and Planetary Change, 73(3-4):219-232.
|
|
|
| [73] |
Yang W T, Long D, Bai P. 2019. Impacts of future land cover and climate changes on runoff in the mostly afforested river basin in North China. Journal of Hydrology, 570:201-219.
|
|
|
| [74] |
Yellow River Conservancy Commission of the Ministry of Water Resources. 2001-2019. Yellow River Sediment Bulletin. Zhengzhou: Yellow River Conservancy Commission of the Ministry of Water Resources. (in Chinese)
|
|
|
| [75] |
Zhao G J, Tian P, Mu X M, et al. 2014. Quantifying the impact of climate variability and human activities on streamflow in the middle reaches of the Yellow River basin, China. Journal of Hydrology, 519:387-398.
|
|
|
| [76] |
Zhao R Y, Biswas A, Zhou Y, et al. 2018. Identifying localized and scale-specific multivariate controls of soil organic matter variations using multiple wavelet coherence. Science of The Total Environment, 643:548-558.
|
|
|
|
Viewed |
|
|
|
Full text
|
|
|
|
|
Abstract
|
|
|
|
|
Cited |
|
|
|
|
| |
Shared |
|
|
|
|
| |
Discussed |
|
|
|
|