| Research article |
|


|
|
|
| Seasonal dynamics of soil water content in the typical vegetation and its response to precipitation in a semi-arid area of Chinese Loess Plateau |
ZHOU Tairan1,2, HAN Chun1,2, QIAO Linjie1,2, REN Chaojie1,2, WEN Tao1,2, ZHAO Changming1,2,*( ) ) |
1State Key Laboratory of Grassland and Agro-Ecosystems, School of Life Sciences, Lanzhou University, Lanzhou 730000, China
2Gansu Provincial Field Scientific Observation and Research Station of Mountain Ecosystems, Lanzhou University, Lanzhou 730000, China |
|
|
|
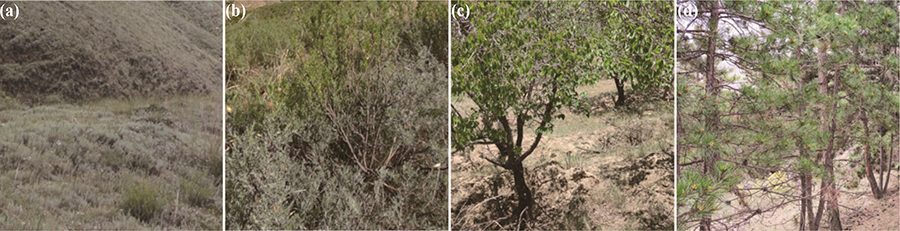
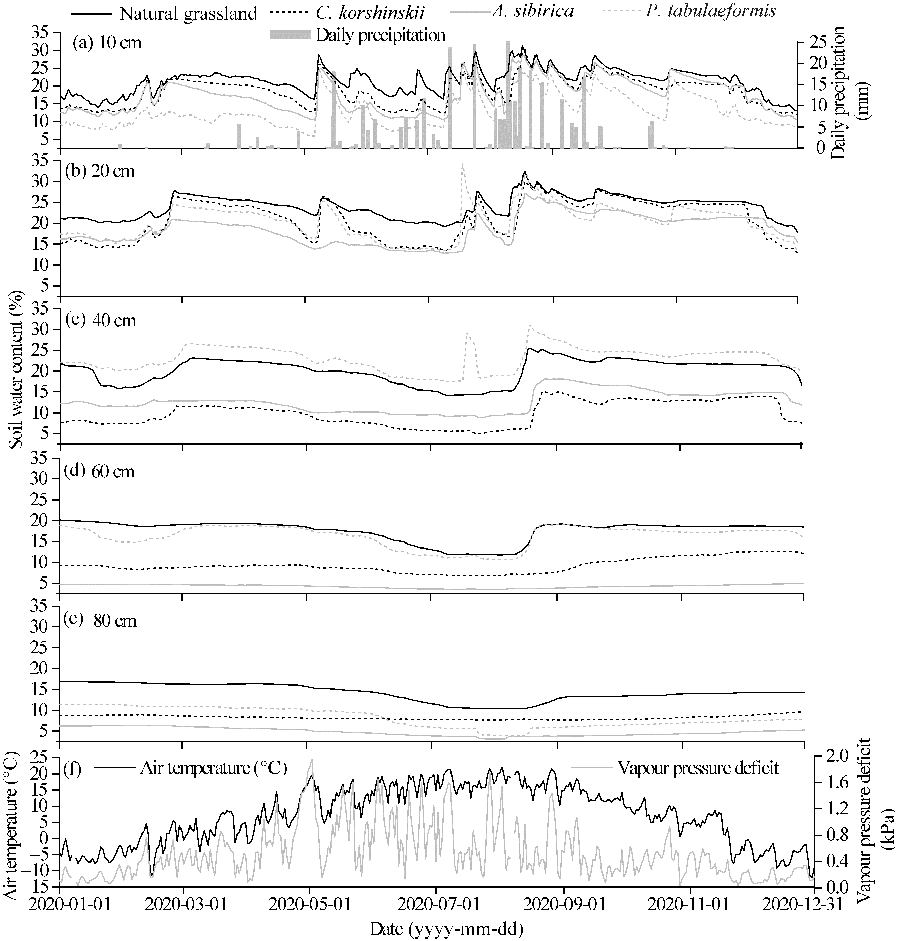
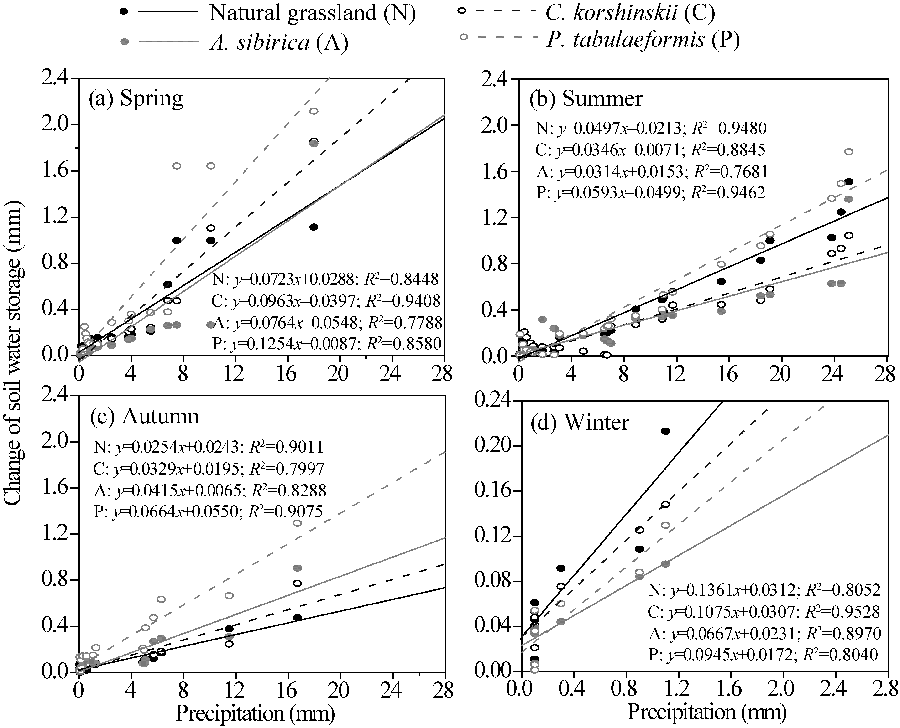
Abstract Soil water content is a key limiting factor for vegetation growth in the semi-arid area of Chinese Loess Plateau and precipitation is the main source of soil water content in this area. To further understand the impact of vegetation types and environmental factors such as precipitation on soil water content, we continuously monitored the seasonal dynamics in soil water content in four plots (natural grassland, Caragana korshinskii, Armeniaca sibirica and Pinus tabulaeformis) in Chinese Loess Plateau. The results show that the amplitude of soil water content fluctuation decreases with an increase in soil depth, showing obvious seasonal variations. Soil water content of artificial vegetation was found to be significantly lower than that of natural grassland, and most precipitation events have difficulty replenishing soil water content below a depth of 40 cm. Spring and autumn are the key seasons for replenishment of soil water by precipitation. Changes in soil water content are affected by precipitation, vegetation types, soil evaporation and other factors. The interception effect of vegetation on precipitation and the demand for water consumption by transpiration are the key factors affecting the efficiency of soil water replenishment by precipitation in this area. Due to artificial vegetation plantation in this area, soil will face a water deficit crisis in the future.
|
|
Received: 30 June 2021
Published: 10 October 2021
|
|
Corresponding Authors:
*ZHAO Changming (E-mail: zhaochm@lzu.edu.cn)
|
|
|
| [1] |
An W, Li Z, Wang S, et al. 2017. Exploring the effects of the "Grain for Green" program on the differences in soil water in the semi-arid Loess Plateau of China. Ecological Engineering, 107:144-151.
doi: 10.1016/j.ecoleng.2017.07.017
|
|
|
| [2] |
Cheng R R, Chen Q W, Zhang J G, et al. 2020. Soil moisture variations in response to precipitation in different vegetation types: A multi-year study in the loess hilly region in China. Ecohydrology, 13(3):e2196, doi: 10.1002/eco.2196.
doi: 10.1002/eco.2196
|
|
|
| [3] |
Daly E, Porporato A. 2005. A review of soil moisture dynamics: From rainfall infiltration to ecosystem response. Environmental Engineering Science, 22(1):9-24.
doi: 10.1089/ees.2005.22.9
|
|
|
| [4] |
D'Odorico P, Caylor K, Okin G S, et al. 2007. On soil moisture-vegetation feedbacks and their possible effects on the dynamics of dryland ecosystems. Journal of Geophysical Research, 112:G04010, doi: 10.1029/2006JG000379.
doi: 10.1029/2006JG000379
|
|
|
| [5] |
Fu B J, Wang J, Chen L D, et al. 2003. The effects of land use on soil moisture variation in the Danangou catchment of the Loess Plateau, China. CATENA, 54(1-2):197-213.
doi: 10.1016/S0341-8162(03)00065-1
|
|
|
| [6] |
Gao L, Shao M G, Peng X H, et al. 2015. Spatio-temporal variability and temporal stability of water contents distributed within soil profiles at a hillslope scale. CATENA, 132:29-36.
doi: 10.1016/j.catena.2015.03.022
|
|
|
| [7] |
Grayson R B, Western A W, Chiew F H S, et al. 1997. Preferred states in spatial soil moisture patterns: Local and nonlocal controls. Water Resources Research, 33(12):2897-2908.
doi: 10.1029/97WR02174
|
|
|
| [8] |
Guo S J, Xu Y D, He C, et al. 2019. Differential responses of soil quality in revegetation types to precipitation gradients on the Loess Plateau. Agricultural and Forest Meteorology, 276-277:107622, doi: 10.1016/j.agrformet.2019.107622.
doi: 10.1016/j.agrformet.2019.107622
|
|
|
| [9] |
He X B, Huang Z B. 2001. Zeolite application for enhancing water infiltration and retention in loess soil. Resources Conservation and Recycling, 34(1):45-52.
doi: 10.1016/S0921-3449(01)00094-5
|
|
|
| [10] |
Hou G, Bi H, Wei X, et al. 2018. Response of soil moisture to single rainfall events under three vegetation types in the Gully Region of the Loess Plateau. Sustainability, 10(10):3793.
doi: 10.3390/su10103793
|
|
|
| [11] |
Kakembo V. 2009. Vegetation patchiness and implications for landscape function: The case of Pteronia incana invader species in Ngqushwa Rural Municipality, Eastern Cape, South Africa. CATENA, 77(3):180-186.
doi: 10.1016/j.catena.2008.12.014
|
|
|
| [12] |
Kurc S A, Small E E. 2007. Soil moisture variations and ecosystem-scale fluxes of water and carbon in semiarid grassland and shrubland. Water Resources Research, 43(6):W06416, doi: 10.1029/2006WR005011.
doi: 10.1029/2006WR005011
|
|
|
| [13] |
Laio F, Porporato A, Ridolfi L, et al. 2001. Plants in water-controlled ecosystems: active role in hydrologic processes and response to water stress II. Probabilistic soil moisture dynamics. Advances in Water Resources, 24(7):707-723.
doi: 10.1016/S0309-1708(01)00005-7
|
|
|
| [14] |
Li X Y, Zhang S Y, Peng H Y, et al. 2013. Soil water and temperature dynamics in shrub-encroached grasslands and climatic implications: Results from Inner Mongolia steppe ecosystem of North China. Agricultural and Forest Meteorology, 171-172:20-30.
doi: 10.1016/j.agrformet.2012.11.001
|
|
|
| [15] |
Liang H, Xue Y, Li Z, et al. 2018. Soil moisture decline following the plantation of Robinia pseudoacacia forests: Evidence from the Loess Plateau. Forest Ecology and Management, 412:62-69.
doi: 10.1016/j.foreco.2018.01.041
|
|
|
| [16] |
Liu X, Zhang B, Zhuang J Y, et al. 2017. The relationship between sap flow density and environmental factors in the Yangtze River Delta Region of China. Forests, 8(3):74.
doi: 10.3390/f8030074
|
|
|
| [17] |
Ma C, Luo Y, Shao M, et al. 2017. Environmental controls on sap flow in black locust forest in Loess Plateau, China. Scientific Reports, 7(1):13160, doi: 10.1038/s41598-017-13532-8.
doi: 10.1038/s41598-017-13532-8
|
|
|
| [18] |
Ma C K, Li X D, Luo Y, et al. 2019. The modelling of rainfall interception in growing and dormant seasons for a pine plantation and a black locust plantation in semi-arid Northwest China. Journal of Hydrology, 577:123849, doi: 10.1016/j.jhydrol.2019.06.021.
doi: 10.1016/j.jhydrol.2019.06.021
|
|
|
| [19] |
Mei X M, Ma L, Zhu Q K, et al. 2019. The variability in soil water storage on the loess hillslopes in China and its estimation. Catena, 172:807-818.
doi: 10.1016/j.catena.2018.09.045
|
|
|
| [20] |
Odindi J O, Kakembo V. 2011. The hydrological response of Pteronia incana-invaded areas in the Eastern Cape Province, South Africa. Ecohydrology, 4(6):832-840.
doi: 10.1002/eco.v4.6
|
|
|
| [21] |
Pan M, Wood E F, Wojcik R, et al. 2008. Estimation of regional terrestrial water cycle using multi-sensor remote sensing observations and data assimilation. Remote Sensing of Environment, 112(4):1282-1294.
doi: 10.1016/j.rse.2007.02.039
|
|
|
| [22] |
Peel M C. 2009. Hydrology: catchment vegetation and runoff. Progress in Physical Geography, 33(6):837-844.
|
|
|
| [23] |
Schlueter S, Vogel H J, Ippisch O, et al. 2013. Combined impact of soil heterogeneity and vegetation type on the annual water balance at the field scale. Vadose Zone Journal, 12(4):1-17.
|
|
|
| [24] |
Schwinning S, Sala O E. 2004. Hierarchy of responses to resource pulses in arid and semi-arid ecosystems. Oecologia, 141(2):211-220.
pmid: 15034778
|
|
|
| [25] |
Shao Q, Gu W, Dai Q Y, et al. 2014. Effectiveness of geotextile mulches for slope restoration in semi-arid northern China. CATENA, 116:1-9.
doi: 10.1016/j.catena.2013.12.006
|
|
|
| [26] |
Wang S, Fu B J, Gao G Y, et al. 2013. Responses of soil moisture in different land cover types to rainfall events in a re-vegetation catchment area of the Loess Plateau, China. CATENA, 101:122-128.
doi: 10.1016/j.catena.2012.10.006
|
|
|
| [27] |
Wilson D J, Western A W, Grayson R B. 2004. Identifying and quantifying sources of variability in temporal and spatial soil moisture observations. Water Resources Research, 40(2):W02507, doi: 10.1029/2003WR002306.
doi: 10.1029/2003WR002306
|
|
|
| [28] |
Wu H, Li X Y, Li J, et al. 2016. Differential soil moisture pulse uptake by coexisting plants in an alpine Achnatherum splendens grassland community. Environmental Earth Sciences, 75(10):914, doi: 10.1007/s12665-016-5694-2.
doi: 10.1007/s12665-016-5694-2
|
|
|
| [29] |
Xu G, Zhang T G, Li Z B, et al. 2017. Temporal and spatial characteristics of soil water content in diverse soil layers on land terraces of the Loess Plateau, China. CATENA, 158:20-29.
doi: 10.1016/j.catena.2017.06.015
|
|
|
| [30] |
Yu T, Feng Q, Si J, et al. 2019. Responses of riparian forests to flood irrigation in the hyper-arid zone of NW China. Science of the Total Environment, 648:1421-1430.
doi: 10.1016/j.scitotenv.2018.08.287
|
|
|
| [31] |
Yu X, Huang Y, Li E, et al. 2017. Effects of vegetation types on soil water dynamics during vegetation restoration in the Mu Us Sandy Land, northwestern China. Journal of Arid Land, 9(2):188-199.
doi: 10.1007/s40333-017-0054-y
|
|
|
| [32] |
Yu X N, Huang Y M, Li E G, et al. 2018. Effects of rainfall and vegetation to soil water input and output processes in the Mu Us Sandy Land, northwest China. CATENA, 161:96-103.
doi: 10.1016/j.catena.2017.10.023
|
|
|
| [33] |
Zhang X, Zhang L, Zhao J, et al. 2008. Responses of streamflow to changes in climate and land use/cover in the Loess Plateau, China. Water Resources Research, 44(7):W00A07, doi: 10.1029/2007WR006711.
doi: 10.1029/2007WR006711
|
|
|
| [34] |
Zhang Z, Si B, Li M, et al. 2020. Deficit and recovery of deep soil water following a full cycle of afforestation and deforestation of apple trees on the Loess Plateau, China. Water, 12(4):989, doi: 10.3390/w12040989.
doi: 10.3390/w12040989
|
|
|
| [35] |
Zhao C L, Jia X X, Zhu Y J, et al. 2017. Long-term temporal variations of soil water content under different vegetation types in the Loess Plateau, China. CATENA, 158:55-62.
doi: 10.1016/j.catena.2017.06.006
|
|
|
| [36] |
Zhou D, Zhao S, Zhu C. 2012. The Grain for Green project induced land cover change in the Loess Plateau: A case study with Ansai County, Shanxi Province, China. Ecological Indicators, 23:88-94.
doi: 10.1016/j.ecolind.2012.03.021
|
|
|
| [37] |
Zhu L, Wang Z H, Mao G L, et al. 2014. Water uptake from different soil depths for halophytic shrubs grown in northern area of Ningxia Plain (China) in contrasted water regimes. Journal of Plant Interactions, 9(1):26-34.
doi: 10.1080/17429145.2012.751139
|
|
|
|
Viewed |
|
|
|
Full text
|
|
|
|
|
Abstract
|
|
|
|
|
Cited |
|
|
|
|
| |
Shared |
|
|
|
|
| |
Discussed |
|
|
|
|