| Research article |
|


|
|
|
| Response of ecosystem service value to land use/cover change in the northern slope economic belt of the Tianshan Mountains, Xinjiang, China |
SUN Chen1,2,3, MA Yonggang1,2,*( ), GONG Lu1,2,*() ), GONG Lu1,2,*() |
1College of Resources and Environmental Sciences, Xinjiang University, Urumqi 830046, China
2Key Laboratory of Oasis Ecology, Urumqi 830046, China
3School of Ecology and Environmental Science, Yunnan University, Kunming 650500, China |
|
|
|
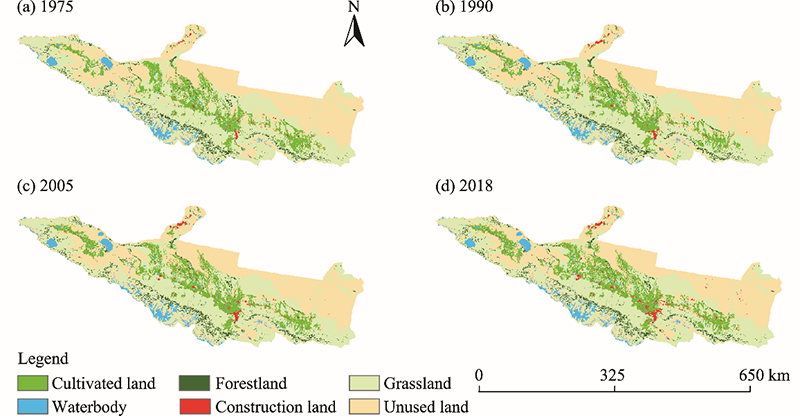
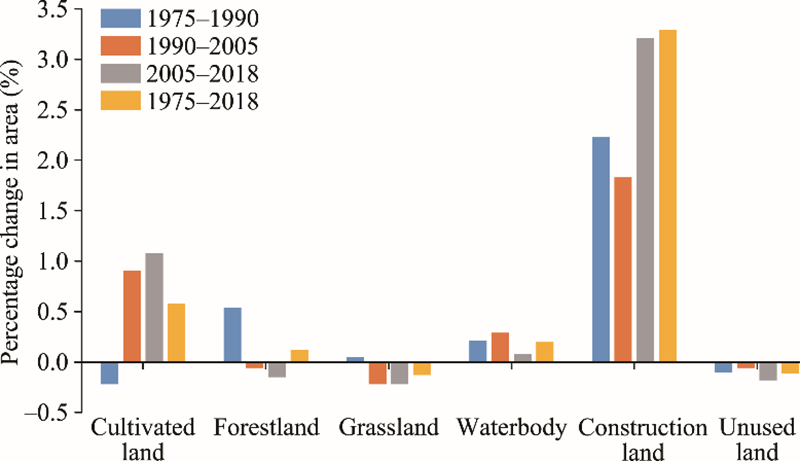
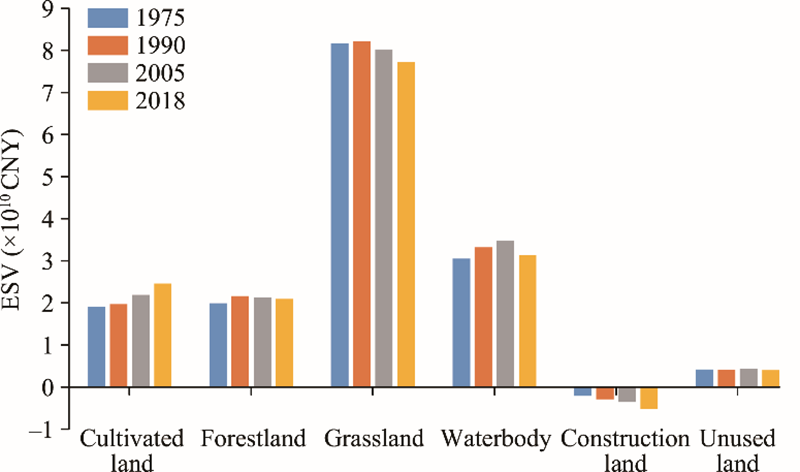
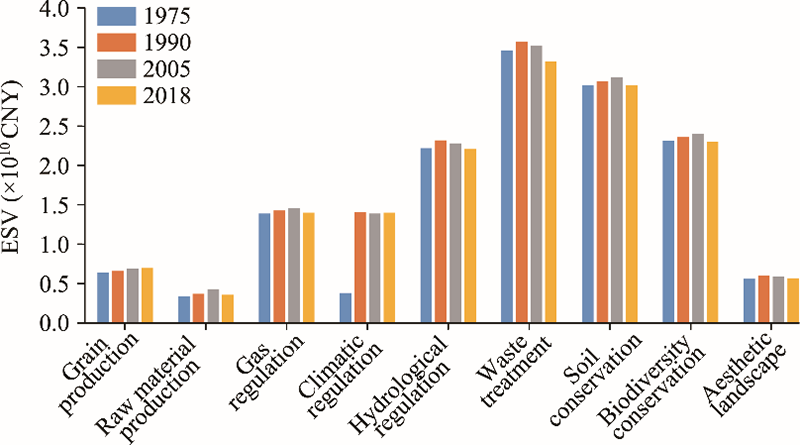
Abstract Land use/cover change (LUCC) is becoming more and more frequent and extensive as a result of human activities, and is expected to have a major impact on human welfare by altering ecosystem service value (ESV). In this study, we utilized remote sensing images and statistical data to explore the spatial-temporal changes of land use/cover types and ESV in the northern slope economic belt of the Tianshan Mountains in Xinjiang Uygur Autonomous Region, China from 1975 to 2018. During the study period, LUCC in the study region varied significantly. Except grassland and unused land, all the other land use/cover types (cultivated land, forestland, waterbody, and construction land) increased in areas. From 1975 to 2018, the spatial-temporal variations in ESV were also pronounced. The total ESV decreased by 4.00×10⁸ CNY, which was primarily due to the reductions in the areas of grassland and unused land. Waterbody had a much higher ESV than the other land use/cover types. Ultimately, understanding the impact of LUCC on ESV and the interactions among ESV of different land use/cover types will help improve existing land use policies and provide scientific basis for developing new conservation strategies for ecologically fragile areas.
|
|
Received: 18 March 2021
Published: 10 October 2021
|
|
Corresponding Authors:
*Corresponding authors: MA Yonggang (E-mail: mayg@xju.edu.cn);GONG Lu (E-mail: gonglu721@163.com)
|
|
|
| [1] |
Arowolo A O, Deng X Z. 2018. Land use/land cover change and statistical modelling of cultivated land change drivers in Nigeria. Regional Environmental Change, 18(1):247-259.
doi: 10.1007/s10113-017-1186-5
|
|
|
| [2] |
Barbier E B, Hacker S D, Kennedy C, et al. 2011. The value of estuarine and coastal ecosystem services. Ecological Monographs, 81(2):169-193.
doi: 10.1890/10-1510.1
|
|
|
| [3] |
Brander L M, Wagtendonk A J, Hussain S S, et al. 2012. Ecosystem service values for mangroves in Southeast Asia: A meta-analysis and value transfer application. Ecosystem Services, 1(1):62-69.
doi: 10.1016/j.ecoser.2012.06.003
|
|
|
| [4] |
Brown G. 2013. The relationship between social values for ecosystem services and global land cover: an empirical analysis. Ecosystem Services, 5:58-68.
doi: 10.1016/j.ecoser.2013.06.004
|
|
|
| [5] |
Cao L D, Li J L, Ye M Y, et al. 2018. Changes of ecosystem service value in a coastal zone of Zhejiang Province, China, during rapid urbanization. International Journal of Environmental Research and Public Health, 15(7):1301, doi: 10.3390/ijerph15071301.
doi: 10.3390/ijerph15071301
|
|
|
| [6] |
Chen S, Li G, Xu Z G, et al. 2019. Combined impact of socioeconomic forces and policy implications: spatial-temporal dynamics of the ecosystem services value in Yangtze River Delta, China. Sustainability, 11(9):1-22.
doi: 10.3390/su11010001
|
|
|
| [7] |
Chen W X, Chi G Q, Li J F. 2019. The spatial association of ecosystem services with land use and land cover change at the county level in China, 1995-2015. Science of the Total Environment, 669:459-470.
doi: 10.1016/j.scitotenv.2019.03.139
|
|
|
| [8] |
Cord A F, Bartkowski B, Beckmann M, et al. 2017. Towards systematic analyses of ecosystem service trade-offs and synergies: Main concepts, methods and the road ahead. Ecosystem Services, 28:264-272.
doi: 10.1016/j.ecoser.2017.07.012
|
|
|
| [9] |
Costanza R, d'Arge R, de Groot R, et al. 1997. The value of the world's ecosystem services and natural capita. Nature, 387:253-260.
doi: 10.1038/387253a0
|
|
|
| [10] |
Costanza R, de Groot R, Sutton P, et al. 2014. Changes in the global value of ecosystem services. Global Environmental Change, 26:152-158.
doi: 10.1016/j.gloenvcha.2014.04.002
|
|
|
| [11] |
Cui X L, Wei X Q, Liu W, et al. 2019. Spatial and temporal analysis of carbon sources and sinks through land use/cover changes in the Beijing-Tianjin-Hebei urban agglomeration region. Physics and Chemistry of the Earth, 110:61-70.
|
|
|
| [12] |
de Groot R, Brander L, van der Ploeg S, et al. 2012. Global estimates of the value of ecosystems and their services in monetary units. Ecosystem Services, 1(1):50-61.
doi: 10.1016/j.ecoser.2012.07.005
|
|
|
| [13] |
Ding M T, Pei F S, Hu Y C, et al. 2020. Spatial and temporal changes of ecosystem service value in Jiangsu Province based on LUCC. Acta Ecologica Sinica, 40(19):6801-6811. (in Chinese)
|
|
|
| [14] |
General Administration of Quality Supervision, Inspection and Quarantine of the People's Republic of China, Standardization Administration. 2017. Current Land Use Classification. (GB/T 21010-2017). [2021-06-07]. https://kns.cnki.net/kcms/detail/detail.aspx?dbcode=SCSF&dbname=SCSF&filename=SCSF00051887&v=DoBnvSYYuSsnGpkeAHYI4177SUf3jvOjScTBOOtEGOWJaXPdowWcdC754JgkjhuN .
|
|
|
| [15] |
Gunderson L H, Cosens B, Garmestani A S. 2016. Adaptive governance of riverine and wetland ecosystem goods and services. Journal of Environmental Management, 183:353-360.
doi: S0301-4797(16)30273-0
pmid: 27206806
|
|
|
| [16] |
Homolova L, Schaepman M E, Lamarque P, et al. 2014. Comparison of remote sensing and plant trait-based modelling to predict ecosystem services in subalpine grasslands. Ecosphere, 5(8):1-29.
|
|
|
| [17] |
Hu T, Wu J S, Li W F. 2019. Assessing relationships of ecosystem services on multi-scale: A case study of soil erosion control and water yield in the Pearl River Delta. Ecological Indicators, 99:193-202.
doi: 10.1016/j.ecolind.2018.11.066
|
|
|
| [18] |
Huang A, Xu Y Q, Sun P L, et al. 2019. Land use/land cover changes and its impact on ecosystem services in ecologically fragile zone: A case study of Zhangjiakou City, Hebei Province, China. Ecological Indicators, 104:604-614.
doi: 10.1016/j.ecolind.2019.05.027
|
|
|
| [19] |
Huang L, He C L, Wang B. 2021. Study on the spatial changes concerning ecosystem services value in Lhasa River Basin, China. Environmental Science and Pollution Research, doi: 10.1007/S11356-021-16245-8.
doi: 10.1007/S11356-021-16245-8
|
|
|
| [20] |
Jobstvogt N, Watson V, Kenter J O. 2014. Looking below the surface: The cultural ecosystem service values of UK marine protected areas (MPAs). Ecosystem Services, 10:97-110.
doi: 10.1016/j.ecoser.2014.09.006
|
|
|
| [21] |
Kroeger T, Casey F. 2007. An assessment of market-based approaches to providing ecosystem services on agricultural lands. Ecological Economics, 64(2):321-332.
doi: 10.1016/j.ecolecon.2007.07.021
|
|
|
| [22] |
Lausch A, Blaschke T, Haase D, et al. 2015. Understanding and quantifying landscape structure—A review on relevant process characteristics, data models and landscape metrics. Ecological Modelling, 295:31-41.
doi: 10.1016/j.ecolmodel.2014.08.018
|
|
|
| [23] |
Li J, Wang Z L, Lai C G, et al. 2018. Response of net primary production to land use and land cover change in mainland China since the late 1980s. Science of the Total Environment, 639:237-247.
doi: 10.1016/j.scitotenv.2018.05.155
|
|
|
| [24] |
Li T, Cui Y H, Liu A G. 2017. Spatiotemporal dynamic analysis of forest ecosystem services using "big data": A case study of Anhui province, central-eastern China. Journal of Cleaner Production, 142:589-599.
doi: 10.1016/j.jclepro.2016.09.118
|
|
|
| [25] |
Li Z G, Sun Z S, Tian Y J, et al. 2019. Impact of land use/cover change on Yangtze River Delta urban agglomeration ecosystem services value: temporal-spatial patterns and cold/hot spots ecosystem services value change brought by urbanization. International Journal of Environmental Research and Public Health, 16(1):123, doi: 10.3390/ijerph16010123.
doi: 10.3390/ijerph16010123
|
|
|
| [26] |
Liu C G, Sun W, Li M. 2021. Evolution of ecosystem service value in rural regions based on geographical scope of entities: a case study of Nanjing, China. Ecological Informatics, 64:101368, doi: 10.1016/j.ecoinf.2021.101368.
doi: 10.1016/j.ecoinf.2021.101368
|
|
|
| [27] |
Liu J M, Xiao B, Jiao J Z, et al. 2021. Modeling the response of ecological service value to land use change through deep learning simulation in Lanzhou, China. Science of the Total Environment, 796:148981, doi: 10.1016/j.scitotenv.2021.148981.
doi: 10.1016/j.scitotenv.2021.148981
|
|
|
| [28] |
Liu W, Zhan J Y, Zhao F, et al. 2019. Impacts of urbanization-induced land-use changes on ecosystem services: A case study of the Pearl River Delta Metropolitan Region, China. Ecological Indicators, 98:228-238.
doi: 10.1016/j.ecolind.2018.10.054
|
|
|
| [29] |
Local Chronicles Compilation Committee of Xinjiang Uygur Autonomous Region. 1975-2018. Xinjiang Yearbook. Urumqi: Xinjiang Yearbook Press. [2021-05-05]. https://navi.cnki.net/knavi/yearbooks/YXINJ/detail?uniplatform=NZKPT . (in Chinese)
|
|
|
| [30] |
Long H L, Liu Y Q, Hou X G, et al. 2014. Effects of land use transitions due to rapid urbanization on ecosystem services: Implications for urban planning in the new developing area of China. Habitat International, 44:536-544.
doi: 10.1016/j.habitatint.2014.10.011
|
|
|
| [31] |
Mayila R, Mamat S, Nigela T, et al. 2018. The ecosystem service value spatial-temporal changes in the Ugan-kuqa River Delta Oasis based on RS and GIS. Acta Ecologica Sinica, 38(16):5938-5951. (in Chinese)
|
|
|
| [32] |
Nahuelhual L, Carmona A, Aguayo M, et al. 2014. Land use change and ecosystem services provision: a case study of recreation and ecotourism opportunities in southern Chile. Landscape Ecology, 29:329-344.
doi: 10.1007/s10980-013-9958-x
|
|
|
| [33] |
National Bureau of Statistics. 2020. China Statistical Yearbook. Beijing: China Statistics Press. [2021-05-07]. http://www.stats.gov.cn/tjsj/ndsj/2020/indexch.htm . (in Chinese)
|
|
|
| [34] |
Ouyang Z Y, Zheng H, Xiao Y, et al. 2016. Improvements in ecosystem services from investments in natural capital. Science, 352(6292):1455-1459.
doi: 10.1126/science.aaf2295
|
|
|
| [35] |
Pan N H, Guan Q Y, Wang Q Z, et al. 2021. Spatial differentiation and driving mechanisms in ecosystem service value of arid region: a case study in the middle and lower reaches of Shule River Basin, NW China. Journal of Cleaner Production, 319:128718, doi: 10.1016/j.jclepro.2021.128718.
doi: 10.1016/j.jclepro.2021.128718
|
|
|
| [36] |
Paz-Kagan T, Shachak M, Zaady E, et al. 2014. Evaluation of ecosystem responses to land-use change using soil quality and primary productivity in a semi-arid area, Israel. Agriculture, Ecosystems & Environment, 193:9-24.
doi: 10.1016/j.agee.2014.04.024
|
|
|
| [37] |
Rawlins M A, Westby L. 2013. Community participation in payment for ecosystem services design and implementation: An example from Trinidad. Ecosystem Services, 6:117-121.
doi: 10.1016/j.ecoser.2013.09.004
|
|
|
| [38] |
Sidik H, Rusuli Y, Eziz M. 2016. The impact of human activity and climate change on ecosystem services value in the Yanqi Basin, Xinjiang, China. Chinese Journal of Eco-Agriculture, 24(5):684-694. (in Chinese)
|
|
|
| [39] |
Sun Y X, Liu S L, Dong Y H, et al. 2019. Spatio-temporal evolution scenarios and the coupling analysis of ecosystem services with land use change in China. Science of the Total Environment, 681:211-225.
doi: 10.1016/j.scitotenv.2019.05.136
|
|
|
| [40] |
Sun Z B, Gao M H, Cui X F. 2018. Land use change in north slope economic zone of Tianshan Mountain based on remote sensing and GIS from 2000-2015. Journal of Beijing Normal University: Natural Science, 54(3):397-404. (in Chinese)
|
|
|
| [41] |
Tang X M, Liu Y, Liu X W, et al. 2017. Estimation and analysis of ecosystem service value based on grid scale. Transactions of the Chinese Society for Agricultural Machinery, 48(4):149-153, 205. (in Chinese)
|
|
|
| [42] |
Wang J, Zhai T L, Lin Y F, et al. 2019. Spatial imbalance and changes in supply and demand of ecosystem services in China. Science of the Total Environment, 657:781-791.
doi: 10.1016/j.scitotenv.2018.12.080
|
|
|
| [43] |
Wang W J, Guo H C, Chuai X W, et al. 2014. The impact of land use change on the temporospatial variations of ecosystems services value in China and an optimized land use solution. Environmental Science & Policy, 44:62-72.
|
|
|
| [44] |
Wang Y, Shi R Y, Qiao C L. 2018. Evaluation of water resources carrying capacity based on fuzzy comprehensive evaluation method in northern slope economic belt of Tianshan Mountains. Bulletin of Soil and Water Conservation, 38:206-212, 219. (in Chinese)
|
|
|
| [45] |
Wang Y H, Dai E F, Yin L, et al. 2018. Land use/land cover change and the effects on ecosystem services in the Hengduan Mountain region, China. Ecosystem Services, 34:55-67.
doi: 10.1016/j.ecoser.2018.09.008
|
|
|
| [46] |
Wang Z M, Zhang B, Zhang S Q, et al. 2006. Changes of land use and of ecosystem service values in Sanjiang Plain, northeast China. Environmental Monitoring and Assessment, 112:69-91.
doi: 10.1007/s10661-006-0312-5
|
|
|
| [47] |
Xiao Y, Xie G D, Lu C X, et al. 2016. Involvement of ecosystem service flows in human wellbeing based on the relationship between supply and demand. Acta Ecologica Sinica, 36(10):3096-3102. (in Chinese)
|
|
|
| [48] |
Xie G D, Lu C X, Leng Y F, et al. 2003. Ecological assets valuation of the Tibetan Plateau. Journal of Natural Resources, 18(2):189-196. (in Chinese)
|
|
|
| [49] |
Xie G D, Xiao Y, Zhen L, et al. 2005. Study on ecosystem services value of food production in China. Chinese Journal of Eco-Agriculture, 13(3):10-13. (in Chinese)
|
|
|
| [50] |
Xie G D, Li W H, Xiao Y, et al. 2010. Forest ecosystem services and their values in Beijing. Chinese Geographical Science, 20:51-58.
doi: 10.1007/s11769-010-0051-y
|
|
|
| [51] |
Xie G D, Zhang C X, Zhang L M, et al. 2015. Improvement of the evaluation method for ecosystem service value based on per unit area. Journal of Natural Resources, 30(8):1243-1254. (in Chinese)
|
|
|
| [52] |
Yan R, Cai Y P, Li C H, et al. 2019. Hydrological responses to climate and land use changes in a watershed of the Loess Plateau, China. Sustainability, 11(5):1443, doi: 10.3390/su11051443.
doi: 10.3390/su11051443
|
|
|
| [53] |
Ye Y Q, Bryan B A, Zhang J E, et al. 2018. Changes in land-use and ecosystem services in the Guangzhou-Foshan metropolitan area, China from 1990 to 2010: implications for sustainability under rapid urbanization. Ecological Indicators, 93:930-941.
doi: 10.1016/j.ecolind.2018.05.031
|
|
|
| [54] |
Yuan S F, Zhu C M, Yang L X, et al. 2019. Responses of ecosystem services to urbanization-induced land use changes in ecologically sensitive suburban areas in Hangzhou, China. International Journal of Environmental Research and Public Health, 16(7):1124, doi: 10.3390/ijerph16071124.
doi: 10.3390/ijerph16071124
|
|
|
| [55] |
Zhang F, Yushanjiang A, Jing Y Q. 2019. Assessing and predicting changes of the ecosystem service values based on land use/cover change in Ebinur Lake Wetland National Nature Reserve, Xinjiang, China. Science of the Total Environment, 656:1133-1144.
doi: 10.1016/j.scitotenv.2018.11.444
|
|
|
| [56] |
Zhang P, Liu Y Y, Wang P F, et al. 2019. Research on county ecological compensation mechanism in the process of Beijing-Tianjin-Hebei integration: a case study of Dingxing County in Baoding City. Journal of Ecology and Rural Environment, 35(6):747-755. (in Chinese)
|
|
|
| [57] |
Zhang X Q, Mansur S, Ma G F. 2018. Analysis on the change of land use/cover ecological service value in Yarkand River Basin. Environmental Science & Technology, 41(6):152-160. (in Chinese)
|
|
|
| [58] |
Zhang Y, Liu Y F, Zhang Y,, et al. 2018. On the spatial relationship between ecosystem services and urbanization: A case study in Wuhan, China. Science of the Total Environment, 637-638:780-790.
doi: 10.1016/j.scitotenv.2018.04.396
|
|
|
|
Viewed |
|
|
|
Full text
|
|
|
|
|
Abstract
|
|
|
|
|
Cited |
|
|
|
|
| |
Shared |
|
|
|
|
| |
Discussed |
|
|
|
|