| Research article |
|


|
|
|
| Precipitation or temperature? Nonlinear responses of particulate matter and ozone to meteorological extremes in an arid climate |
LI Yalong1,2,3,4,5,6, HU Bing1,2, Marie Anne Eurie FORIO3, CHANG Cun1,7, QIAO Xuning8,9, NAIBI Sulei1,2,3,5,6, LI Tao1,2,3,5,6, SONG Fengjiao1,2,3,5,6, YANG Bin1,2, LIU Hailong1,10, BAO Anming1,7,11,12,13,*( ), Peter GOETHALS3 ), Peter GOETHALS3 |
1 State Key Laboratory of Desert and Oasis Ecology, Key Laboratory of Ecological Safety and Sustainable Development in Arid Lands, Xinjiang Institute of Ecology and Geography, Chinese Academy of Sciences, Urumqi 830011, China
2 University of Chinese Academy of Sciences, Beijing 100049, China
3 Department of Animal Sciences and Aquatic Ecology, Ghent University, Ghent 9000, Belgium
4 Tarim University, Alaer 843300, China
5 Sino-Belgian Joint Laboratory of Geo-Information, Urumqi 830011, China
6 Sino-Belgian Joint Laboratory of Geo-Information, Ghent 9000, Belgium
7 Key Laboratory of Geographic Information System (GIS) & Remote Sensing (RS) Application Xinjiang Uygur Autonomous Region, Xinjiang Institute of Ecology and Geography, Chinese Academy of Sciences, Urumqi 830011, China
8 School of Surveying and Land Information Engineering, Henan Polytechnic University, Jiaozuo 454003, China
9 Research Centre of Arable Land Protection and Urban-Rural High-Quality Development of Yellow River Basin, Henan Polytechnic University, Jiaozuo 454003, China
10 University of Electronic Science and Technology of China, Chengdu 611731, China
11 Sino-Belgian Joint Laboratory for Geo-Information, Urumqi 830011, China
12 China-Pakistan Joint Research Center on Earth Sciences, Chinese Academy of Sciences-Higher Education Commission of Pakistan (CAS-HEC), Islamabad 45320, Pakistan
13 Qinghai Forestry Carbon Sequestration Service Center, Xining 810001, China |
|
|
|
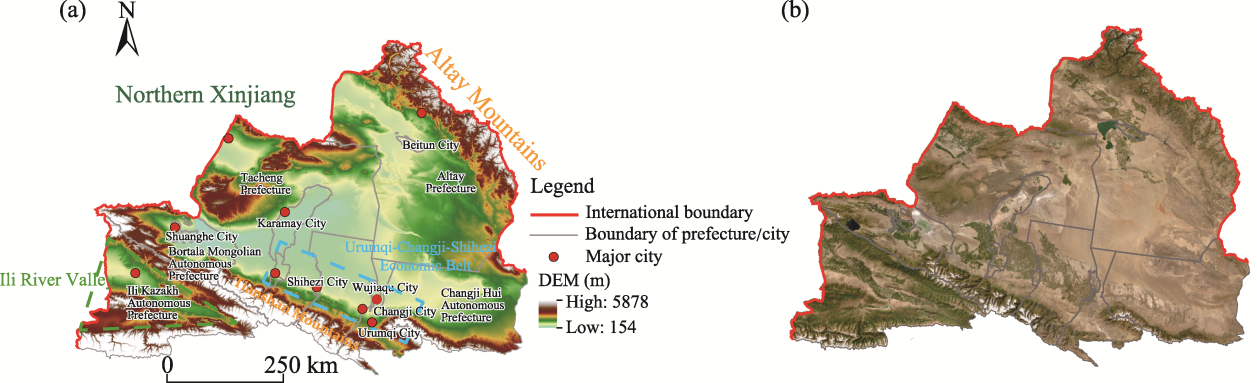
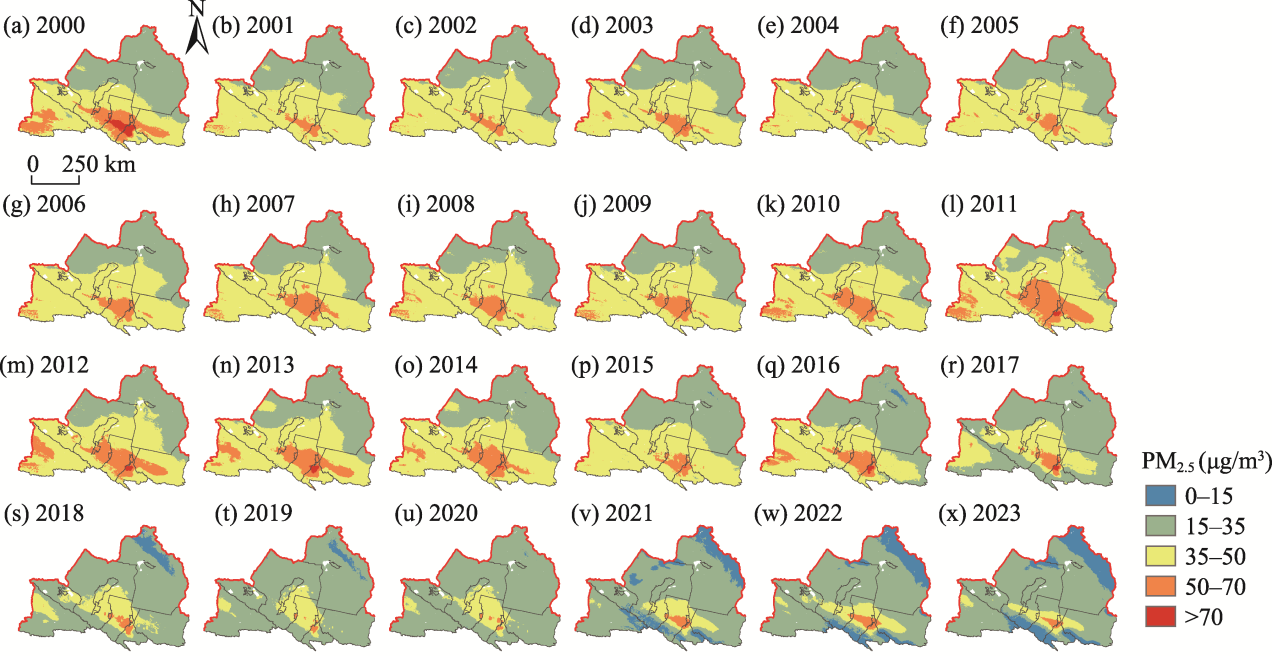
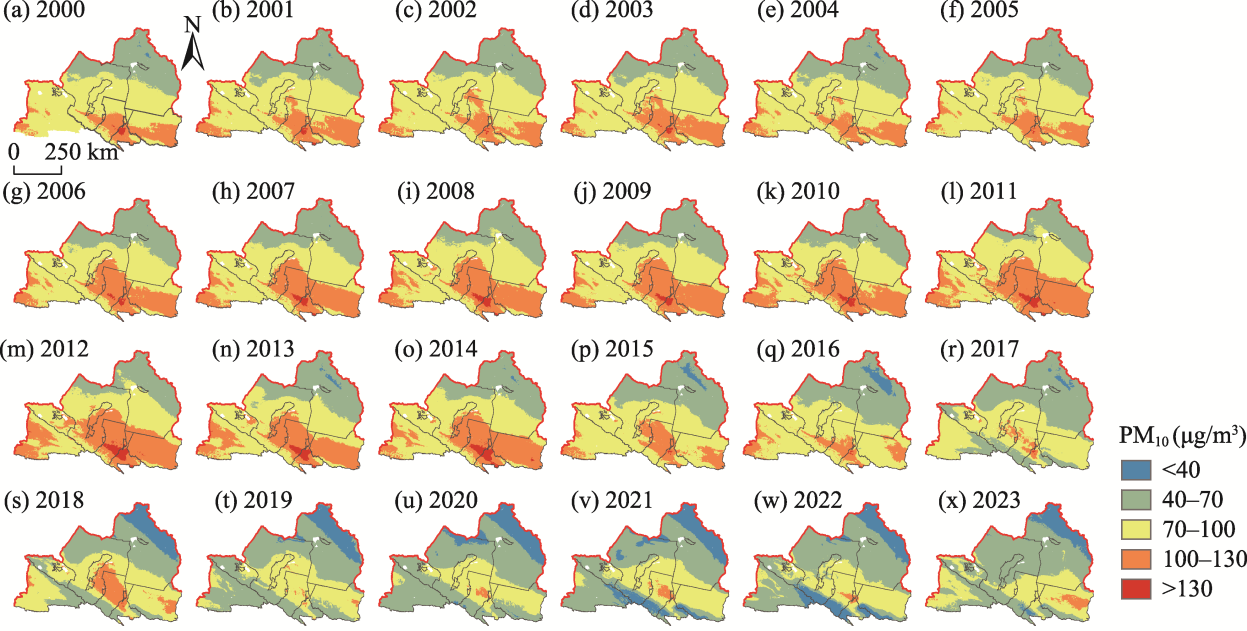
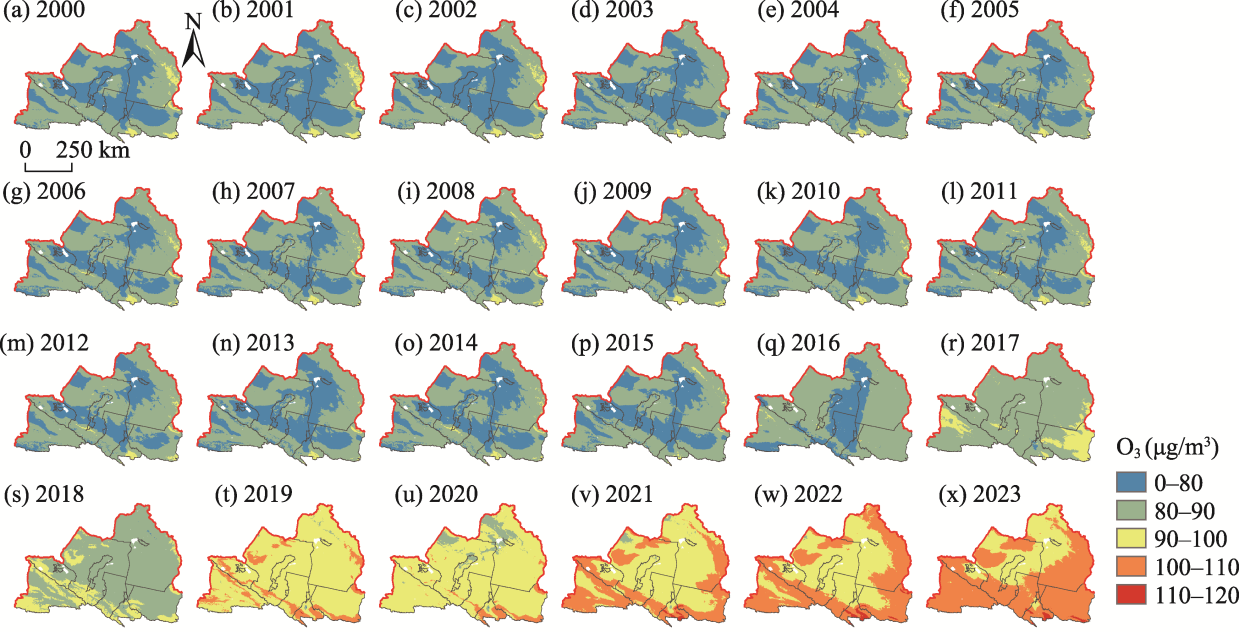
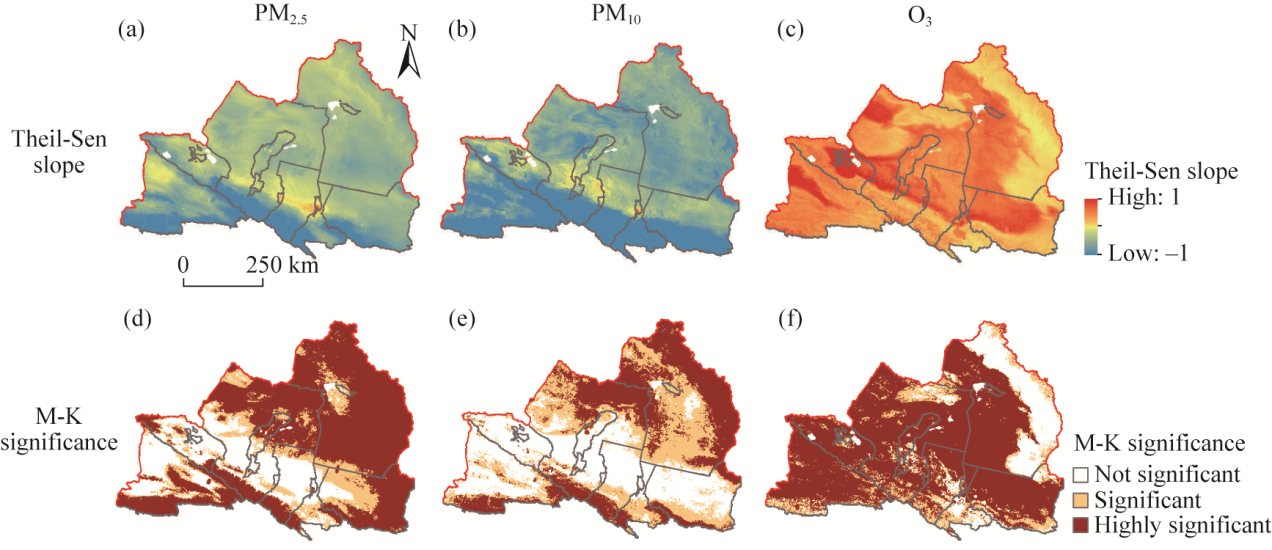
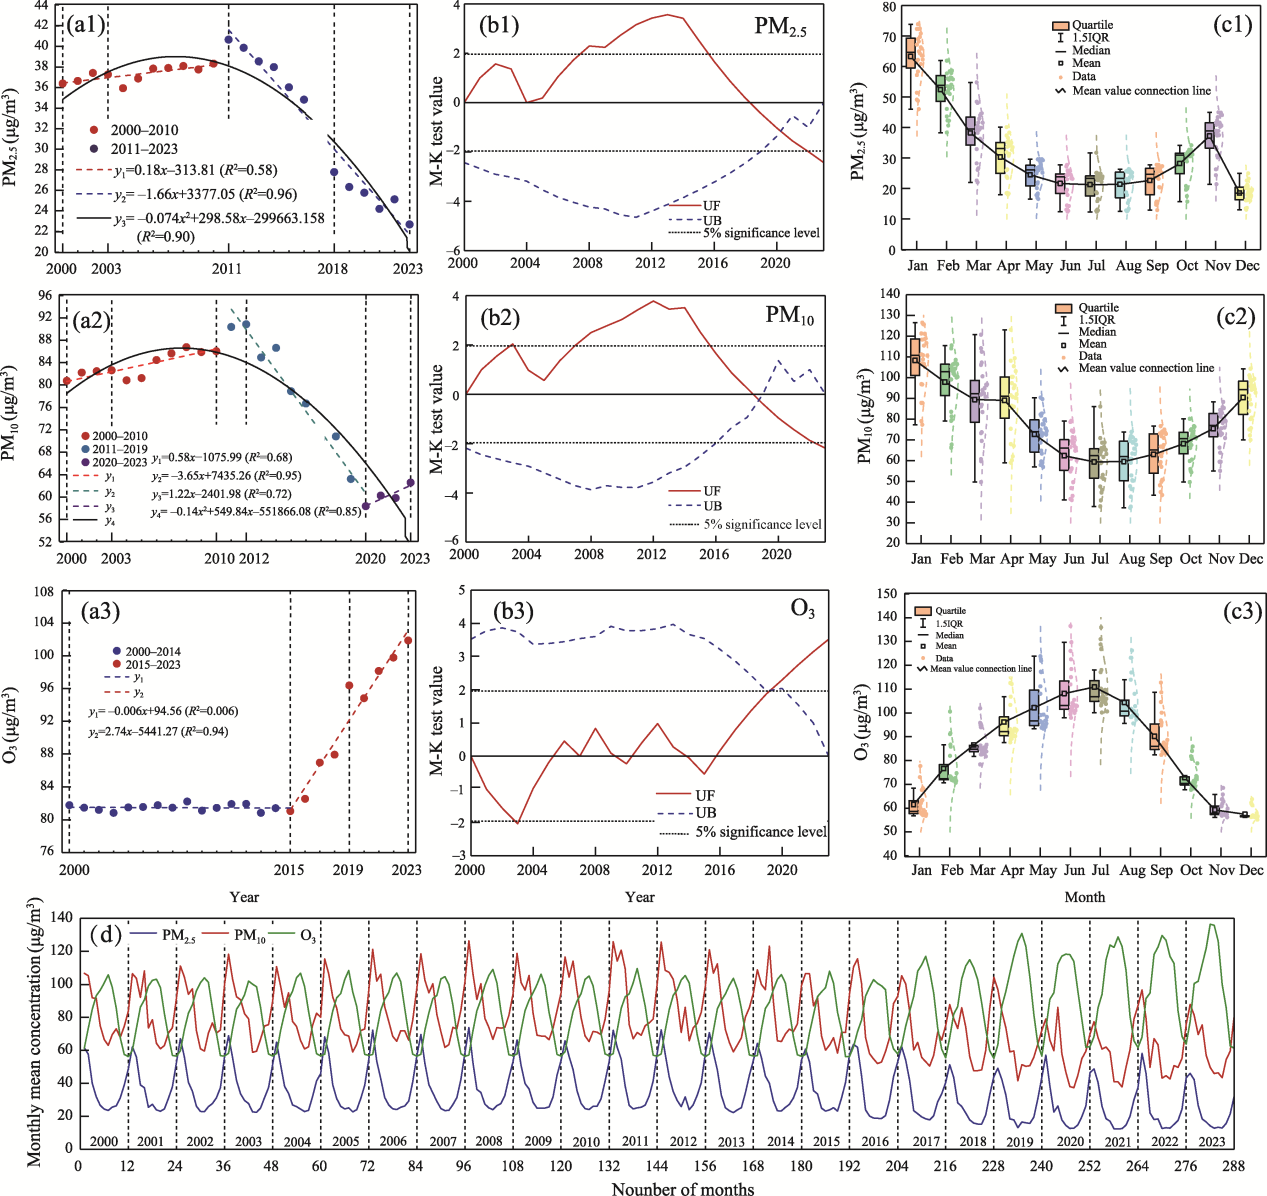
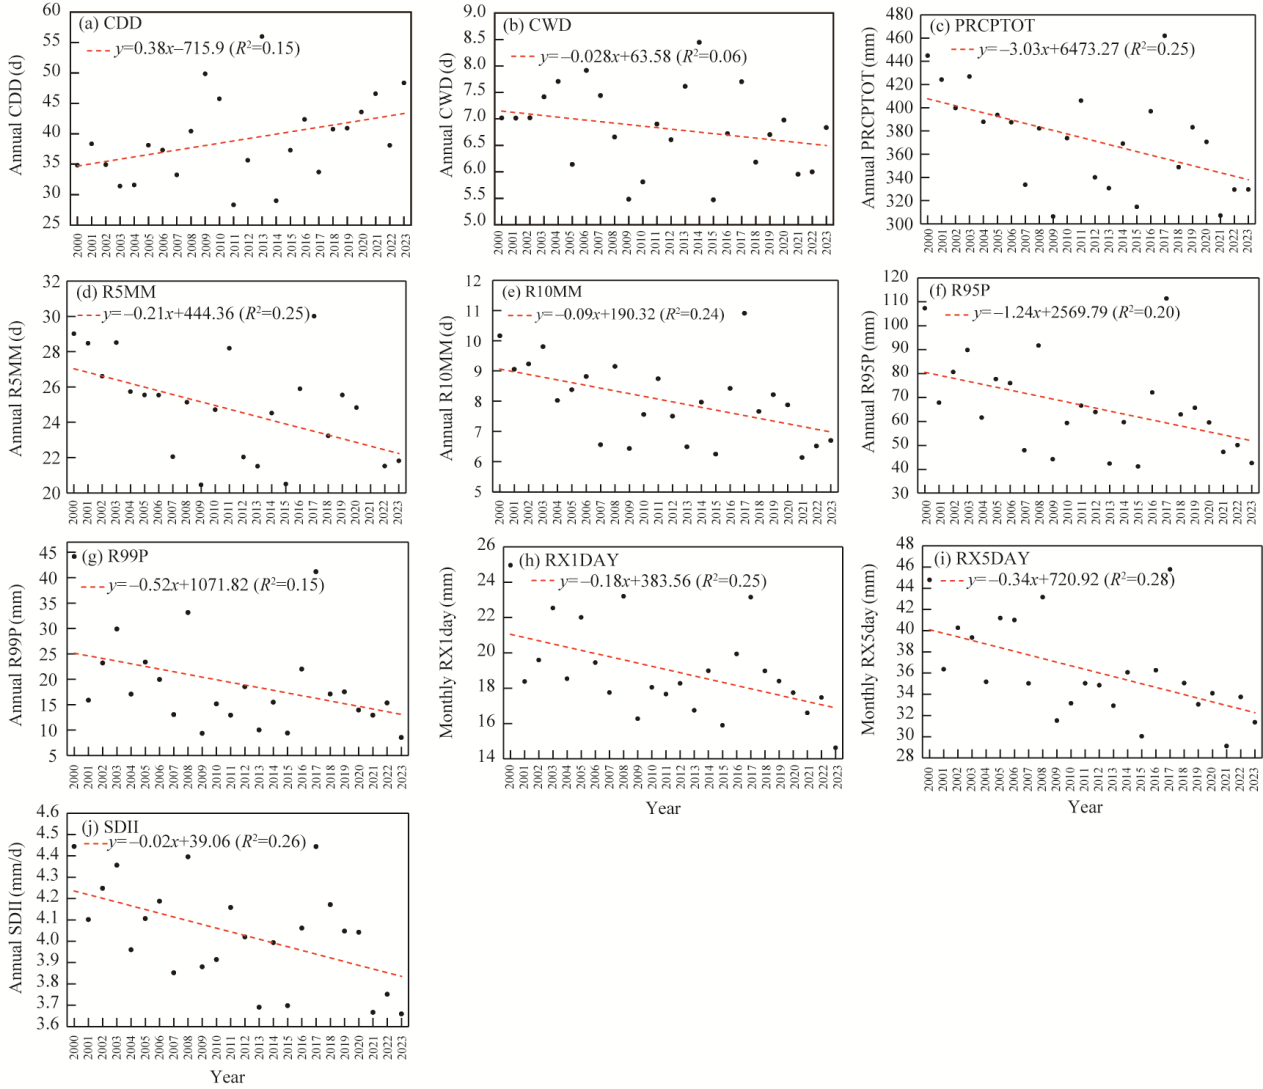
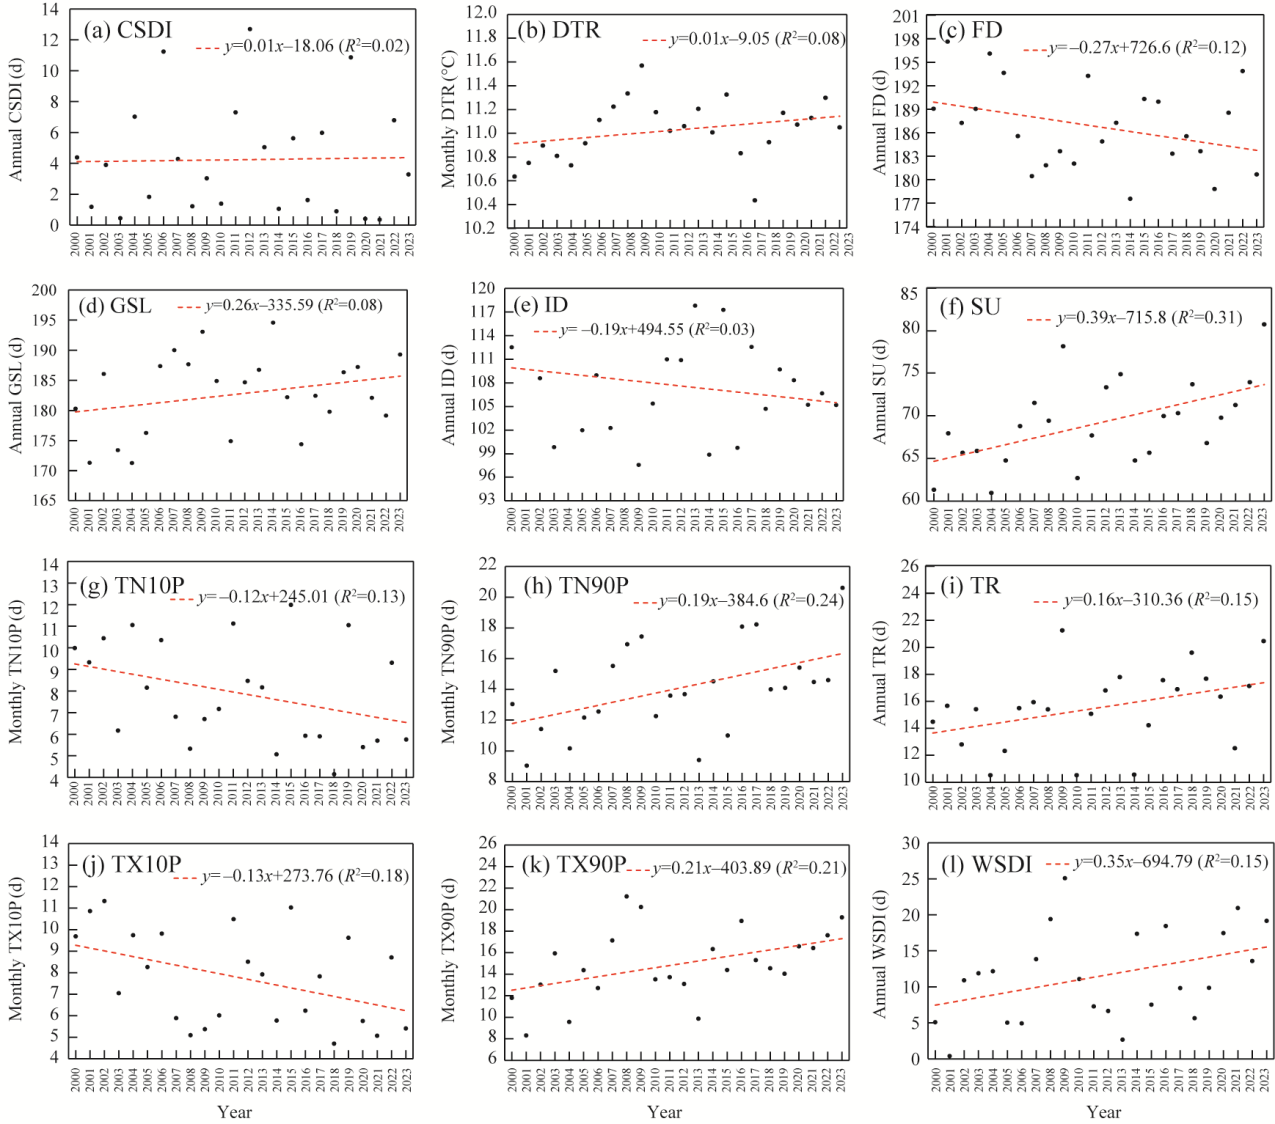
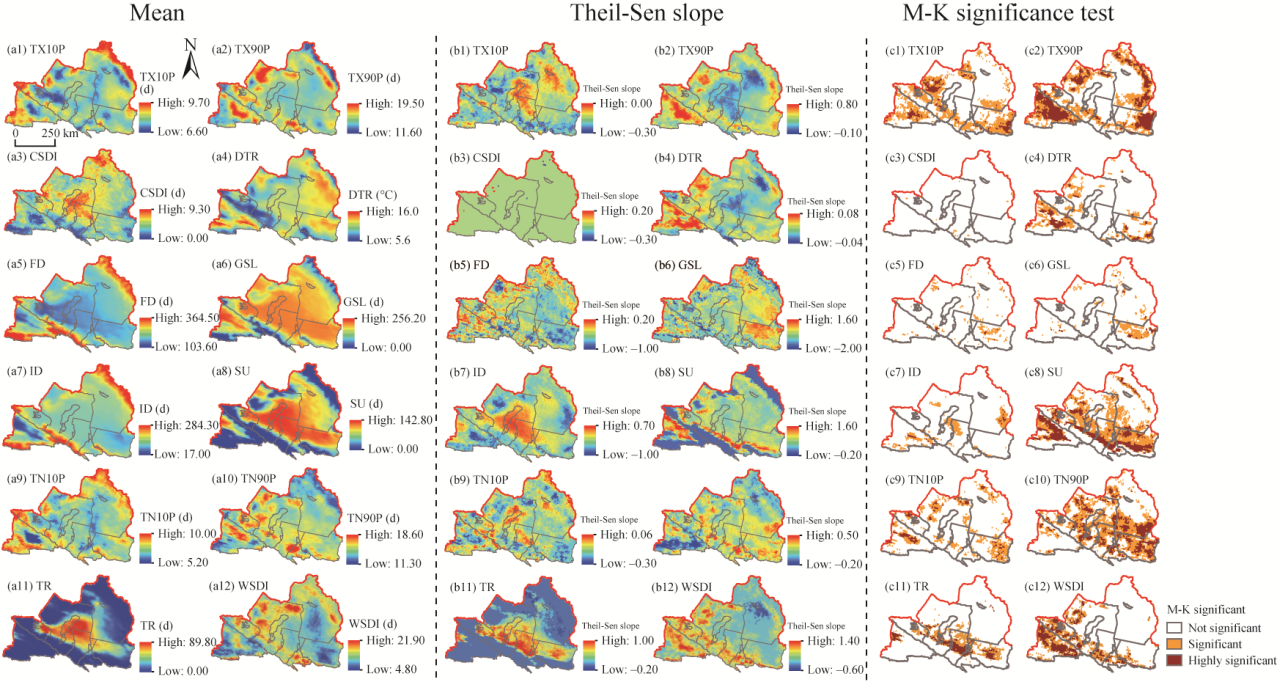
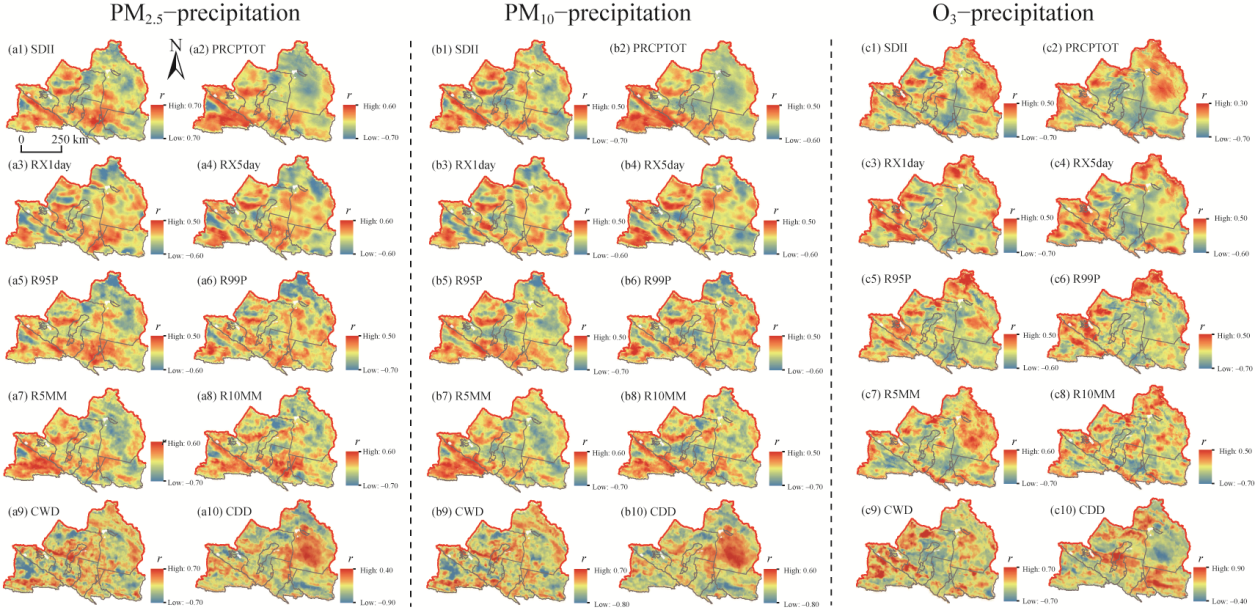
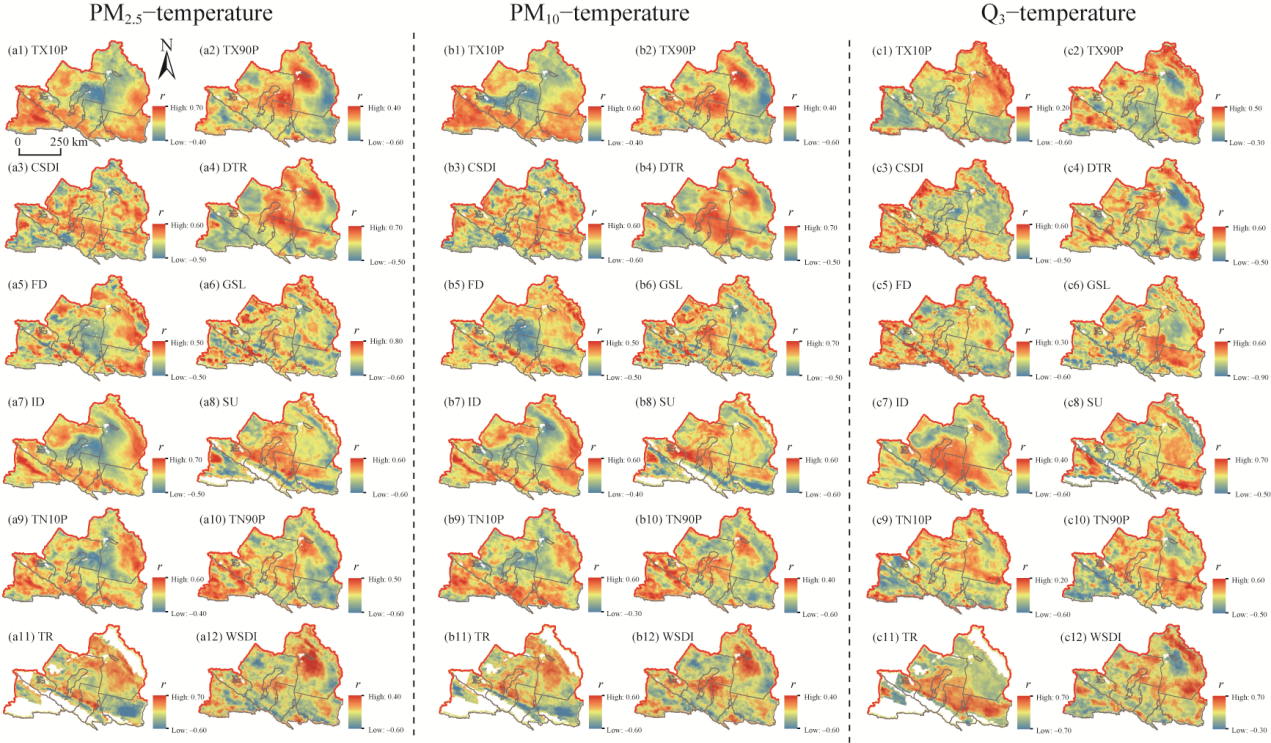
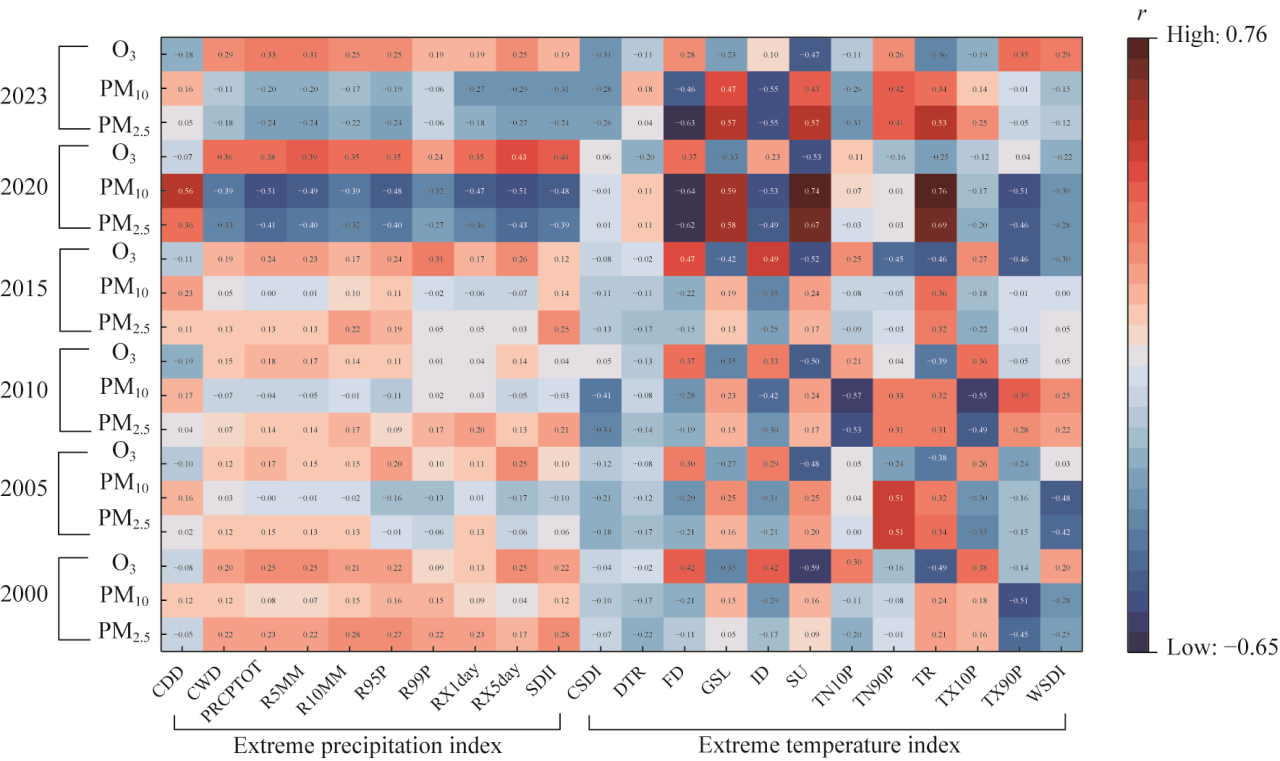
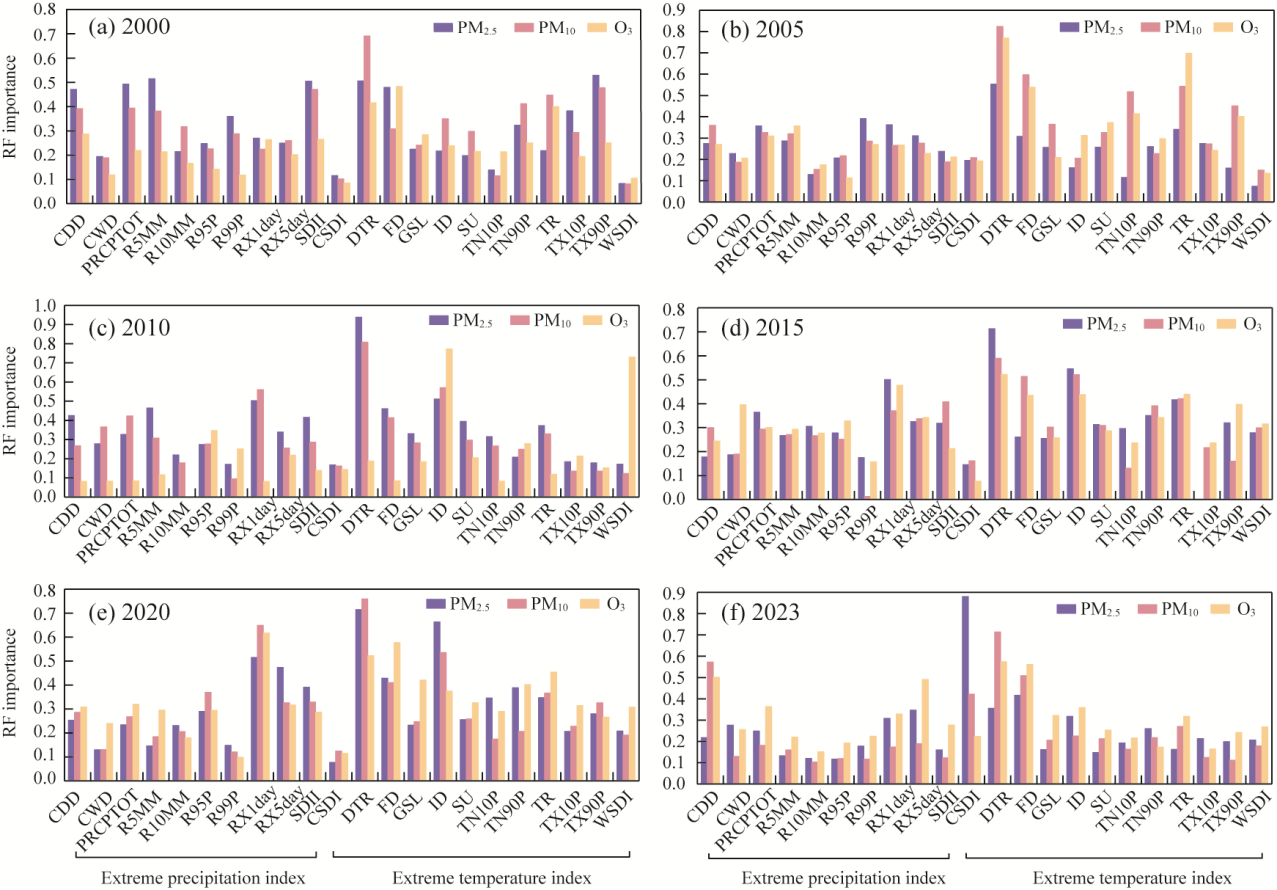
Abstract Northern Xinjiang, an arid inland area in Northwest China, is highly vulnerable to air pollution under intensifying climate extremes, yet the relative roles of temperature and precipitation extremes remain insufficiently understood. Using multi-source datasets for 2000-2023, including China High Air Pollutants (CHAP) particulate matter 2.5 (PM2.5), particulate matter 10 (PM10), and ozone (O3) products and Expert Team on Climate Change Detection and Indices (ETCCDI) extreme climate indices derived from the European Centre for Medium-Range Weather Forecasts (ECMWF) Reanalysis v5 (ERA5)-Land, together with trend detection, change-point analysis, pixel-wise Pearson correlation, and random forest (RF) modeling, we investigated the spatiotemporal evolution of major air pollutants and their responses to meteorological extremes in northern Xinjiang. PM2.5 and PM10 generally declined from 2000 to 2023, whereas O3 increased, indicating a shift from particulate-dominated pollution toward stronger photochemical pollution. Interannually, PM2.5 showed a rise-decline pattern, PM10 exhibited a rise-decline-rebound pattern, and O3 increased markedly after 2015. Clear seasonal contrasts were observed, with PM2.5 peaking in winter, PM10 in spring, and O3 in summer. During the same period, northern Xinjiang exhibited a pronounced warming-drying tendency, characterized by increasing heat-related indices, decreasing cold-related indices, reduced precipitation totals and heavy-rainfall frequency, and increasing consecutive dry days. Pollutant-climate relationships showed strong spatial heterogeneity and pollutant-specific contrasts across the Urumqi-Changji-Shihezi corridor, the Ili River Valley, and the Junggar Basin. PM2.5 responses to precipitation shifted from predominantly positive to negative, PM10 showed mainly negative associations with precipitation extremes, and O3 responses varied by subregion. Temperature-related extremes generally explained more pollutant variability than precipitation-related extremes, with PM2.5 showing the highest sensitivity. These findings highlight the coupled influences of warming, drying, emissions, and terrain-controlled transport on air quality and support region-specific, multi-pollutant strategies for coordinated climate adaptation and air pollution control in northern Xinjiang.
|
|
Received: 10 November 2025
Published: 30 April 2026
|
|
Corresponding Authors:
*BAO Anming (E-mail: baoam@ms.xjb.ac.cn)
|
| Cite this article:
LI Yalong, HU Bing, Marie Anne Eurie FORIO, CHANG Cun, QIAO Xuning, NAIBI Sulei, LI Tao, SONG Fengjiao, YANG Bin, LIU Hailong, BAO Anming, Peter GOETHALS. Precipitation or temperature? Nonlinear responses of particulate matter and ozone to meteorological extremes in an arid climate. Journal of Arid Land, 2026, 18(4): 584-607.
URL:
http://jal.xjegi.com/10.1016/j.jaridl.2026.04.003 OR http://jal.xjegi.com/Y2026/V18/I4/584
|
|
|
| [1] |
Bi J D, Yiming S, Li J Q, et al. 2025. Effects of INSL3 and WNT2B gene polymorphisms on seasonal reproductive traits of Xinjiang Qira black sheep, Kazakh sheep and Duolang sheep. Animal Biotechnology, 36(1): 2498677, doi: 10.1080/10495398.2025.2498677.
|
|
|
| [2] |
Brustad N, Wang T T, He S Z, et al. 2025. Air pollution-induced proteomic alterations increase the risk of child respiratory infections. Nature Communications, 16(1): 5930, doi: 10.1038/s41467-025-61392-y.
|
|
|
| [3] |
Camacho-Caballero D, Langemeyer J, Segura-Barrero R, et al. 2025. Bridging local and global vulnerabilities for an integrated assessment of nature-based solutions. Sustainable Cities and Society, 130: 106508, doi: 10.1016/j.scs.2025.106508.
|
|
|
| [4] |
Chen B Y, Wang W W, Chen S Q, et al. 2025a. Influence of rooftop coupled mitigation strategies on the thermal environment and air quality in the Pearl River Delta region. Sustainable Cities and Society, 122: 106273, doi: 10.1016/j.scs.2025.106273.
|
|
|
| [5] |
Chen S Q, Lü T, Li W Y, et al. 2025b. Joint associations of PM10 and smoking with the risk of new-onset stroke in middle-aged and older adult Chinese adults: findings from the CHARLS cohort study. Frontiers in Public Health, 13: 1537166, doi: 10.3389/fpubh.2025.1537166.
|
|
|
| [6] |
Chen Z W, Zhang Z. 2024. Analysis of spatiotemporal variation and relationship to land use-landscape pattern of PM2.5 and O3 in typical arid zone. Sustainable Cities and Society, 113: 105689, doi: 10.1016/j.scs.2024.105689.
|
|
|
| [7] |
Daisley B, Macpherson C V, Brettingham D J L, et al. 2025. Impacts of antibiotic use, air pollution and climate on managed honeybees in Canada. Nature Sustainability, 8(9): 1087-1099.
doi: 10.1038/s41893-025-01603-y
|
|
|
| [8] |
Duan X X, Wang Q J, Mu W Y, et al. 2025. Application of activated water irrigation technology: a sustainable way to improve soil fertility and crop adaptability in the sandy area of southern Xinjiang. Soil and Tillage Research, 254: 106731, doi: 10.1016/j.still.2025.106731.
|
|
|
| [9] |
Goforth T, Nock D. 2022. Air pollution disparities and equality assessments of us national decarbonization strategies. Nature Communications, 13(1): 7488, doi: 10.1038/s41467-022-35098-4.
|
|
|
| [10] |
Guan Q, Zhang G. 2025. Long-term urban heat island influence on cardiometabolic multimorbidity: spatial-seasonal insights from four national cohorts in China. Sustainable Cities and Society, 130: 106606, doi: 10.1016/j.scs.2025.106606.
|
|
|
| [11] |
Guo M Y, Zheng J H, Zhang J W, et al. 2025. Impact of extreme weather events on mental health among older adults in China: a longitudinal study. Sustainable Cities and Society, 130: 106580, doi: 10.1016/j.scs.2025.106580.
|
|
|
| [12] |
Hammer M S, van Donkelaar A, Bindle L, et al. 2023. Assessment of the impact of discontinuity in satellite instruments and retrievals on global PM2.5 estimates. Remote Sensing of Environment, 294: 113624, doi: 10.1016/j.rse.2023.113624.
|
|
|
| [13] |
Hobbs P V. 2002. Clean air slots amid atmospheric pollution. Nature, 415(6874): 861, doi: 10.1038/415861a
|
|
|
| [14] |
Hu S R, Chen W D, Liu Y. 2025. Policy synergies in urban digital governance for pollution reduction and carbon mitigation: evidence from Chinese cities. Sustainable Cities and Society, 130: 106575, doi: 10.1016/j.scs.2025.106575.
|
|
|
| [15] |
Huang Y J, Yu P, Huang W Z, et al. 2025. The joint health risks of PM2.5 pollution wave and cold spell in eastern China. Sustainable Cities and Society, 126: 106390, doi: 10.1016/j.scs.2025.106390.
|
|
|
| [16] |
Jia N, Li Y S, Jiang Z M, et al. 2025. Climate change, social environment, health, and urban inequality: developing a novel adaptive evaluation framework. Sustainable Cities and Society, 127: 106443, doi: 10.1016/j.scs.2025.106443.
|
|
|
| [17] |
Jin Z H, Pu Q, Janechek N, et al. 2024. A Maia-like modeling framework to estimate PM2.5 mass and speciation concentrations with uncertainty. Remote Sensing of Environment, 303: 113995, doi: 10.1016/j.rse.2024.113995.
|
|
|
| [18] |
Kramer A, Minet L. 2025. Zones of exposure: urban micro-environments of air pollution and residential intensification. Sustainable Cities and Society, 127: 106404, doi: 10.1016/j.scs.2025.106404.
|
|
|
| [19] |
Li P C, Chen Y, Niu H F, et al. 2024. How to evaluate the reduction effect of the park on PM2.5? Exploratory application of the maximum and cumulative perspective. Sustainable Cities and Society, 116: 105909, doi: 10.1016/j.scs.2024.105909.
|
|
|
| [20] |
Li Q S, Hou R X, Zhang X H, et al. 2025. Integrating explainable machine learning to predict the ecological niche distribution of Cytospora chrysosperma in Xinjiang, China. Forest Ecology and Management, 595: 123031, doi: 10.1016/j.foreco.2025.123031.
|
|
|
| [21] |
Li Y L, Qiao X N, Wang Y, et al. 2023. Spatiotemporal patterns and influencing factors of remotely sensed regional heat islands from 2001 to 2020 in Zhengzhou Metropolitan Area. Ecological Indicators, 155: 111026, doi: 10.1016/j.ecolind.2023.111026.
|
|
|
| [22] |
Liu A, Zhong S P, Ma X L, et al. 2025a. Disentangling the drivers of urban air quality using large-scale and high-resolution data: driving towards urban sustainability. Sustainable Cities and Society, 130: 106631, doi: 10.1016/j.scs.2025.106631.
|
|
|
| [23] |
Liu X T, Lu L L, Guo H D, et al. 2025b. Assessing urban sustainability in the belt and road region: a city-level analysis of SDG 11 indicators using earth observations. International Journal of Digital Earth, 18(1): 2522395, doi: 10.1080/17538947.2025.2522395.
|
|
|
| [24] |
Lü K, Licina D, Wienold J, et al. 2025. A multidomain approach to neighbourhood typology for urban environmental studies. Sustainable Cities and Society, 128: 106378, doi: 10.1016/j.scs.2025.106378.
|
|
|
| [25] |
Luo X L, Zuo W Q, Ren Q W, et al. 2025. Correlation of air pollution and risk of sudden sensorineural hearing loss: a mendelian randomization study. Scientific Reports, 15(1): 28921, doi: 10.1038/s41598-025-92952-3.
|
|
|
| [26] |
Müller I, Erbertseder T, Taubenböck H. 2022. Tropospheric NO2: explorative analyses of spatial variability and impact factors. Remote Sensing of Environment, 270: 112839, doi: 10.1016/j.rse.2021.112839.
|
|
|
| [27] |
Nanditha H S, Reshmidevi T V, Simha L U, et al. 2024. Statistical analysis of rainfall and groundwater interaction in Bhadra Catchment. Environment, Development and Sustainability, 26(6): 16267-16287.
doi: 10.1007/s10668-023-03237-6
|
|
|
| [28] |
Qiao X N, Li Y L, Wang Y, et al. 2024. The influence of climate and human factors on a regional heat island in the Zhengzhou Metropolitan Area, China. Environmental Research, 249: 118331, doi: 10.1016/j.envres.2024.118331.
|
|
|
| [29] |
Qu W D, Hua H, Yang T, et al. 2025. Delayed leaf green-up is associated with fine particulate air pollution in China. Nature Communications, 16(1): 3406, doi: 10.1038/s41467-025-58710-9.
|
|
|
| [30] |
Ryalls J M W, Bishop J, Mofikoya A O, et al. 2024. Air pollution disproportionately impairs beneficial invertebrates: a meta-analysis. Nature Communications, 15(1): 5447, doi: 10.1038/s41467-024-49729-5.
|
|
|
| [31] |
Singh M K, Gautam R. 2022. Developing a long-term high-resolution winter fog climatology over South Asia using satellite observations from 2002 to 2020. Remote Sensing of Environment, 279: 113128, doi: 10.1016/j.rse.2022.113128.
|
|
|
| [32] |
Wang K X, Du J, Li C L, et al. 2025a. Uncovering the coupling mechanisms among urban form, surface thermal environments and air pollution. Sustainable Cities and Society, 130: 106537, doi: 10.1016/j.scs.2025.106537.
|
|
|
| [33] |
Wang S B, Li Y, Li T T, et al. 2025b. Regional maize suitability based on soil water and salt content inversion by integrating machine and transfer learnings in Xinjiang. Soil and Tillage Research, 254: 106740, doi: 10.1016/j.still.2025.106740.
|
|
|
| [34] |
Wang Y C, Danesh Yazdi M, Wei Y G, et al. 2024. Air pollution below us regulatory standards and cardiovascular diseases using a double negative control approach. Nature Communications, 15(1): 8451, doi: 10.1038/s41467-024-52117-8.
|
|
|
| [35] |
Wang Y M, Yang K Q, Guo Y, et al. 2025c. A method to estimate indoor instantaneous PM2.5 thresholds for air cleaner in Chinese residences. Sustainable Cities and Society, 120: 106126, doi: 10.1016/j.scs.2025.106126.
|
|
|
| [36] |
Wei J, Li Z Q, Cribb M, et al. 2020. Improved 1 km resolution PM2.5 estimates across China using enhanced space-time extremely randomized trees. Atmospheric Chemistry and Physics, 20(6): 3273-3289.
|
|
|
| [37] |
Wei J, Li Z Q, Lyapustin A, et al. 2021. Reconstructing 1-km-resolution high-quality PM2.5 data records from 2000 to 2018 in China: spatiotemporal variations and policy implications. Remote Sensing of Environment, 252: 112136, doi: 10.1016/j.rse.2020.112136.
|
|
|
| [38] |
Xu S C, Meng X N, Wang H N, et al. 2025. The costs of air pollution: how does air pollution affect technological innovation? Environment, Development and Sustainability, 27(5): 11603-11626.
doi: 10.1007/s10668-023-04371-x
|
|
|
| [39] |
Yang Z Y, Zhang M, Wang L C, et al. 2023. Diurnal time representation of MODIS, VIIRS, MISR, and AHI over Asia and Oceania. Remote Sensing of Environment, 299: 113878, doi: 10.1016/j.rse.2023.113878.
|
|
|
| [40] |
Yuan B Q, Wang Q J, Xu W T, et al. 2025. An improved extreme learning machine algorithm for prospectivity mapping of copper deposits using multi-source remote sensing data: a case study in the North Altyn Tagh, Xinjiang, China. International Journal of Digital Earth, 18(1): 2510567, doi: 10.1080/17538947.2025.2510567.
|
|
|
| [41] |
Zhang D L, Du L L, Wang W H, et al. 2021. A machine learning model to estimate ambient PM2.5 concentrations in industrialized highveld region of South Africa. Remote Sensing of Environment, 266: 112713, doi: 10.1016/j.rse.2021.112713.
|
|
|
| [42] |
Zhang J, Zhang L S, Feng M Y, et al. 2025a. Associations between long-term PM2.5 exposure and metabolomic signatures: a retrospective cohort study. Ecotoxicology and Environmental Safety, 300: 118417, doi: 10.1016/j.ecoenv.2025.118417.
|
|
|
| [43] |
Zhang X L, Wen L, Weerasuriya A U, et al. 2025b. Investigating vehicle effects on wind and pollutant fields in street canyon using the dynamic mesh and source term methods. Sustainable Cities and Society, 130: 106620, doi: 10.1016/j.scs.2025.106620.
|
|
|
| [44] |
Zhao Y F, Bao Z, Long X, et al. 2026. Evolution of secondary organic aerosol under extremely high humidity conditions in urban areas of southwestern China: formation and scavenging. Atmospheric Research, 327: 108318, doi: 10.1016/j.atmosres.2025.108318.
|
|
|
| [45] |
Zhao Y H, Zheng B, Saunois M, et al. 2025. Air pollution modulates trends and variability of the global methane budget. Nature, 642(8067): 369-375.
doi: 10.1038/s41586-025-09004-z
|
|
|
| [46] |
Zhou J, Guo G H, Liu T, et al. 2025. The gender difference in the effects of air pollution on the risk of spinal osteoarthritis in Chinese middle-aged and older adults: a prospective cohort study in China. Frontiers in Public Health, 13: 1576204, doi: 10.3389/fpubh.2025.1576204.
|
|
|
| [47] |
Zou J X, Chen H W, Li H, et al. 2025. Amplified urban heat island effect in southern China's old towns following atmospheric regulation policies. Sustainable Cities and Society, 131: 106675, doi: 10.1016/j.scs.2025.106675.
|
|
|
|
Viewed |
|
|
|
Full text
|
|
|
|
|
Abstract
|
|
|
|
|
Cited |
|
|
|
|
| |
Shared |
|
|
|
|
| |
Discussed |
|
|
|
|