| Research article |
|


|
|
|
| Prediction of meteorological drought in arid and semi-arid regions using PDSI and SDSM: a case study in Fars Province, Iran |
Sheida DEHGHAN1, Nasrin SALEHNIA2, Nasrin SAYARI1,*( ), Bahram BAKHTIARI1 ), Bahram BAKHTIARI1 |
1 Department of Water Engineering, Faculty of Agriculture, Shahid Bahonar University of Kerman, Kerman 7616914111, Iran
2 Faculty of Agriculture, Ferdowsi University of Mashhad, Mashhad 9177949207, Iran |
|
|
|
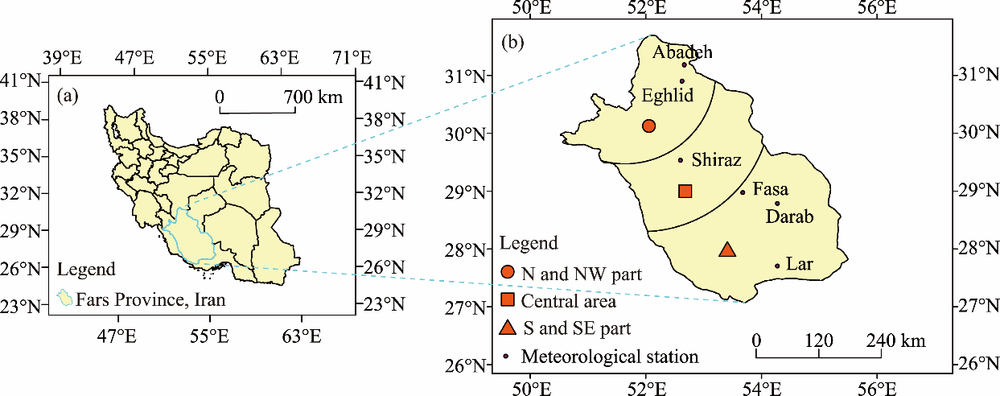
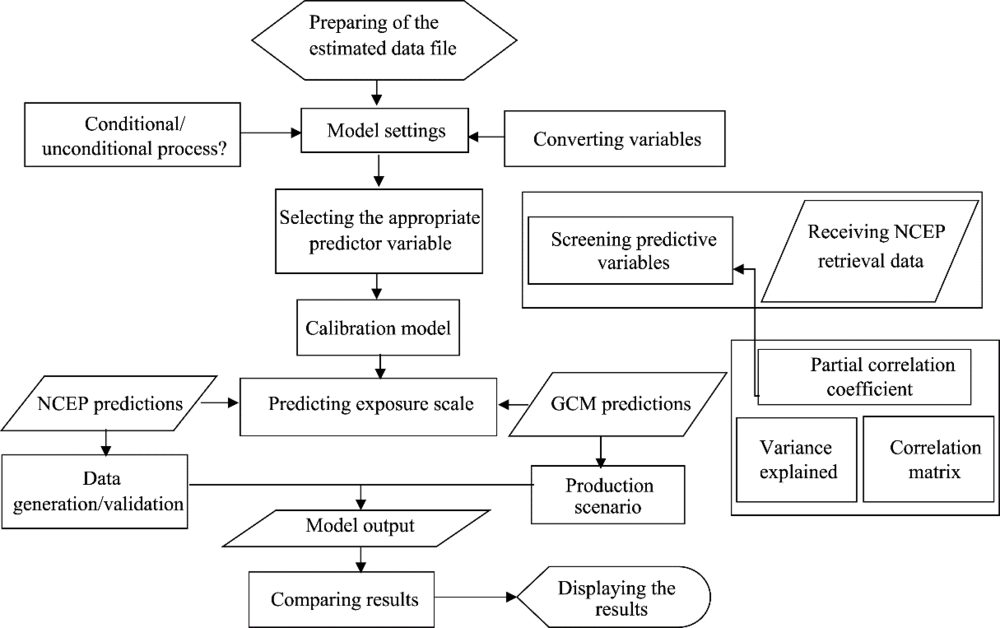
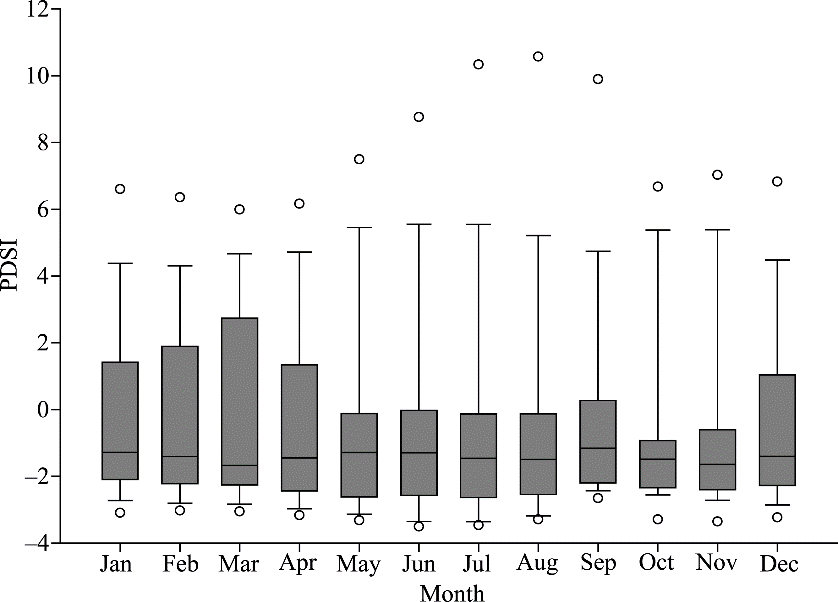
Abstract Drought is one of the most significant environmental disasters, especially in arid and semi-arid regions. Drought indices as a tool for management practices seeking to deal with the drought phenomenon are widely used around the world. One of these indicators is the Palmer drought severity index (PDSI), which is used in many parts of the world to assess the drought situation and continuation. In this study, the drought state of Fars Province in Iran was evaluated by using the PDSI over 1995-2014 according to meteorological data from six weather stations in the province. A statistical downscaling model (SDSM) was used to apply the output results of the general circulation model in Fars Province. To implement data processing and prediction of climate data, a statistical period 1995-2014 was considered as the monitoring period, and a statistical period 2019-2048 was for the prediction period. The results revealed that there is a good agreement between the simulated precipitation (R2>0.63; R2, determination coefficient; MAE<0.52; MAE, mean absolute error; RMSE<0.56; RMSE, Root Mean Squared Error) and temperature (R2>0.95, MAE<1.74, and RMSE<1.78) with the observed data from the stations. The results of the drought monitoring model presented that dry periods would increase over the next three decades as compared to the historical data. The studies showed the highest drought in the meteorological stations Abadeh and Lar during the prediction period under two future scenarios representative concentration pathways (RCP4.5 and RCP8.5). According to the results of the validation periods and efficiency criteria, we suggest that the SDSM is a proper tool for predicting drought in arid and semi-arid regions.
|
|
Received: 14 February 2019
Published: 10 March 2020
|
|
Corresponding Authors:
|
| About author: *Corresponding author: Nasrin SAYARI (Email: nasrin_sayari@yahoo.com) |
|
|
| [1] |
Achilleos G A. 2011. The inverse distance weighted interpolation method and error propagation mechanism-creating a DEM from an analogue topographical map. Journal of Spatial Science, 56(2): 283-304.
doi: 10.1080/14498596.2011.623348
|
|
|
| [2] |
Agricultural and Meteorological Software. 2018. Drought monitor and prediction (Version 1.0). [2019-11-10]. .
|
|
|
| [3] |
Alley W M. 1984. The Palmer drought severity index: limitations and assumptions. Journal of Applied Meteorology, 23(7): 1100-1109.
|
|
|
| [4] |
Ashiq M W, Zhao C, Ni J, et al. 2010. GIS-based high-resolution spatial interpolation of precipitation in mountain-plain areas of upper Pakistan for regional climate change impact studies. Theoretical and Applied Climatology, 99(3-4): 239.
doi: 10.1007/s00704-009-0140-y
|
|
|
| [5] |
Bak B, Labedzki L. 2014. Prediction of precipitation deficit and excess in Bydgoszcz Region in view of predicted climate change. Journal of Water and Land Development, 23(1): 11-19.
doi: 10.1515/jwld-2014-0025
|
|
|
| [6] |
Chu J T, Xia J, Xu C Y, et al. 2010. Statistical downscaling of daily mean temperature, pan evaporation and precipitation for climate change scenarios in Haihe River, China. Theoretical and Applied Climatology, 99(1-2): 149-161.
doi: 10.1007/s00704-009-0129-6
|
|
|
| [7] |
Dai A. 2011. Characteristics and trends in various forms of the Palmer Drought Severity Index during 1900-2008. Journal of Geophysical Research: Atmospheres, 116(D12), doi: 10.1029/2010JD015541.
|
|
|
| [8] |
Dai A. 2013. Increasing drought under global warming in observations and models. Nature Climate Change, 3(1): 52-58.
doi: 10.1038/nclimate1633
|
|
|
| [9] |
Dubrovský M, Hayes M, Duce P, et al. 2014. Multi-GCM projections of future drought and climate variability indicators for the Mediterranean region. Regional Environmental Change, 14(5): 1907-1919.
doi: 10.1007/s10113-013-0562-z
|
|
|
| [10] |
Escalante-Sandoval C, Nuñez-Garcia P. 2017. Meteorological drought features in northern and northwestern parts of Mexico under different climate change scenarios. Journal of Arid Land, 9(1): 65-75.
doi: 10.1007/s40333-016-0022-y
|
|
|
| [11] |
Hayes M J, Wilhelmi O V, Knutson C L. 2004. Reducing drought risk: bridging theory and practice. Natural Hazards Review, 5(2): 106-113.
|
|
|
| [12] |
Hessami M, Gachon P, Ouarda B M J, et al. 2007. Automated regression-based statistical downscaling tool. Environmental Modelling & Software, 23(6): 813-834.
|
|
|
| [13] |
Huang J, Zhang J, Zhang Z, et al. 2011. Estimation of future precipitation change in the Yangtze River basin by using statistical downscaling method. Stochastic Environmental Research and Risk Assessment, 25(6): 781-792.
doi: 10.1007/s00477-010-0441-9
|
|
|
| [14] |
Intergovernmental Panel on Climate Change (IPCC). 2012. Managing the risks of extreme events and disasters to advance climate change adaptation. In: Field C B, Barros V, Stocker T F, et al. A Special Report of Working Groups I and II of the Intergovernmental Panel on Climate Change. Cambridge: Cambridge University Press, 115.
|
|
|
| [15] |
IPCC. 2013. Climate change 2013: the physical science basis. In: Stocker T F, Qin D, Plattner M, et al. An Overview of the Working Group I Contribution to the Fifth Assessment Report of the Intergovernmental Panel on Climate Change. Cambridge: Cambridge University Press, 112.
|
|
|
| [16] |
Jin J, Wang Q, Li L H. 2016. Long-term oscillation of drought conditions in the western China: an analysis of PDSI on a decadal scale. Journal of Arid Land, 8(6): 819-831.
doi: 10.1007/s40333-016-0089-5
|
|
|
| [17] |
Gao L M, Zhang Y N. 2016. Spatio-temporal variation of hydrological drought under climate change during the period 1960-2013 in the Hexi Corridor, China. Journal of Arid Land, 8(2): 157-171.
doi: 10.1007/s40333-015-0022-3
|
|
|
| [18] |
Mahmood R, Babel M. 2013. Evaluation of SDSM developed by annual and monthly sub-models for downscaling temperature and precipitation in the Jhelum basin, Pakistan and India. Theoretical and Applied Climatology, 113(1-2): 27-44.
doi: 10.1007/s00704-012-0765-0
|
|
|
| [19] |
Morid S, Smakhtin V, Moghaddasi M. 2006. Comparison of seven meteorological indices for drought monitoring in Iran. International Journal of Climatology, 26(7): 971-985.
doi: 10.1002/(ISSN)1097-0088
|
|
|
| [20] |
Moss R H, Edmonds J A, Hibbard K A, et al. 2010. The next generation of scenarios for climate change research and assessment. Nature, 463(7282): 747-756.
doi: 10.1038/nature08823
pmid: 20148028
|
|
|
| [21] |
Palmer T N, Räisänen J. 2002. Quantifying the risk of extreme seasonal precipitation events in a changing climate. Nature, 415(6871): 512-514.
doi: 10.1038/415512a
pmid: 11823856
|
|
|
| [22] |
Palmer W C. 1965. Meteorological Drought. Washington: Office of Climatology, US Weather Bureau, 7-12.
|
|
|
| [23] |
Rahimi J, Ebrahimpour M, Khalili A. 2013. Spatial changes of extended De Martonne climatic zones affected by climate change in Iran. Theoretical and Applied Climatology, 112(3-4), 409-418.
doi: 10.1007/s00704-012-0741-8
|
|
|
| [24] |
Salehnia N, Zare H, Kolsoumi S, et al. 2017a. Predictive value of Keetch-Byram Drought Index for cereal yields in a semi-arid environment. Theoretical and Applied Climatology, 134: 1005-1014.
doi: 10.1007/s00704-017-2315-2
|
|
|
| [25] |
Salehnia N, Alizadeh A, Sanaeinejad H, et al2017b. Estimation of meteorological drought indices based on AgMERRA precipitation data and station-observed precipitation data. Journal of Arid Land, 9(6): 797-809.
doi: 10.1007/s40333-017-0070-y
|
|
|
| [26] |
Sheffield J, Wood E F, Roderick M L. 2012. Little change in global drought over the past 60 years. Nature, 491(7424): 435-438.
doi: 10.1038/nature11575
|
|
|
| [27] |
Sillmann J, Kharin V V, Zwiers F W, et al. 2013. Climate extremes indices in the CMIP5 multimodel ensemble: Part 2. Future climate projections. Journal of Geophysical Research: Atmospheres, 118(6): 2473-2493.
doi: 10.1002/jgrd.50273
pmid: 25821662
|
|
|
| [28] |
Sternberg T. 2011. Regional drought has a global impact. Nature, 472(7342):169-169.
|
|
|
| [29] |
Szép I J, Mika J, Dunkel Z. 2005. Palmer drought severity index as soil moisture indicator: physical interpretation, statistical behaviour and relation to global climate. Physics and Chemistry of the Earth, Parts A/B/C, 30(1-3): 231-243.
doi: 10.1016/j.pce.2004.08.039
|
|
|
| [30] |
Touma, D, Ashfaq M, Nayak M A, et al. 2015. A multi-model and multi-index evaluation of drought characteristics in the 21st century. Journal of Hydrology, 526: 196-207.
doi: 10.1016/j.jhydrol.2014.12.011
|
|
|
| [31] |
Trenberth K E, Dai A, Rasmussen R M, et al. 2003. The changing character of precipitation. American Meteorological Society. [2003-09-01]. https://doi.org/10.1175/BAMS-84-9-1205.
|
|
|
| [32] |
Vallam P, Qin X S. 2017. Projecting future precipitation and temperature at sites with diverse climate through multiple statistical downscaling schemes. Theoretical and Applied Climatology, 134: 669-688.
doi: 10.1007/s00704-017-2299-y
|
|
|
| [33] |
Wang X Y, Yang T, Shao Q X, et al. 2012. Statistical downscaling of extremes of precipitation and temperature and construction of their future scenarios in an elevated and cold zone. Stochastic Environmental Research and Risk Assessment, 26(3): 405-418.
doi: 10.1007/s00477-011-0535-z
|
|
|
| [34] |
Wilby R L, Dawson C W, Barrow E M. 2002. SDSM-a decision support tool for the assessment of regional climate change impacts. Environmental Modelling & Software, 17(2): 145-157.
|
|
|
| [35] |
Wu C, Xian Z, Huang G. 2016. Meteorological drought in the Beijiang River basin, South China: current observations and future projections. Stochastic Environmental Research and Risk Assessment, 30(7): 1821-1834.
doi: 10.1007/s00477-015-1157-7
|
|
|
| [36] |
Yu G, Sauchyn D, Li Y F. 2013. Drought changes and the mechanism analysis for the North American Prairie. Journal of Arid Land, 5(1): 1-14.
doi: 10.1007/s40333-013-0136-4
|
|
|
| [37] |
Zandi L H, Fooladmand H R, Boustani F. 2014. Evaluation of the wheat agricultural drought return period in the province of Fars using RDI index. Water Engineering, 7(22): 1-10.
|
|
|
|
Viewed |
|
|
|
Full text
|
|
|
|
|
Abstract
|
|
|
|
|
Cited |
|
|
|
|
| |
Shared |
|
|
|
|
| |
Discussed |
|
|
|
|