| Research article |
|


|
|
|
| Temporal and spatial variation characteristics of extreme precipitation on the Loess Plateau of China facing the precipitation process |
ZHANG Yixin1, LI Peng1,*( ), XU Guoce1, MIN Zhiqiang2, LI Qingshun2, LI Zhanbin1,3, WANG Bin1, CHEN Yiting1 ), XU Guoce1, MIN Zhiqiang2, LI Qingshun2, LI Zhanbin1,3, WANG Bin1, CHEN Yiting1 |
1State Key Laboratory of Eco-Hydraulic in Northwest Arid Region, Xi'an University of Technology, Xi'an 710048, China
2Key Laboratory of National Forestry and Grassland Administration on Ecological Hydrology and Disaster Prevention in Arid Regions, Northwest Survey and Planning Institute of National Forestry and Grassland Administration, Xi'an 710048, China
3State Key Laboratory of Soil Erosion and Dryland Farming on the Loess Plateau, Chinese Academy of Sciences and Ministry of Water Resources, Yangling 712100, China |
|
|
|
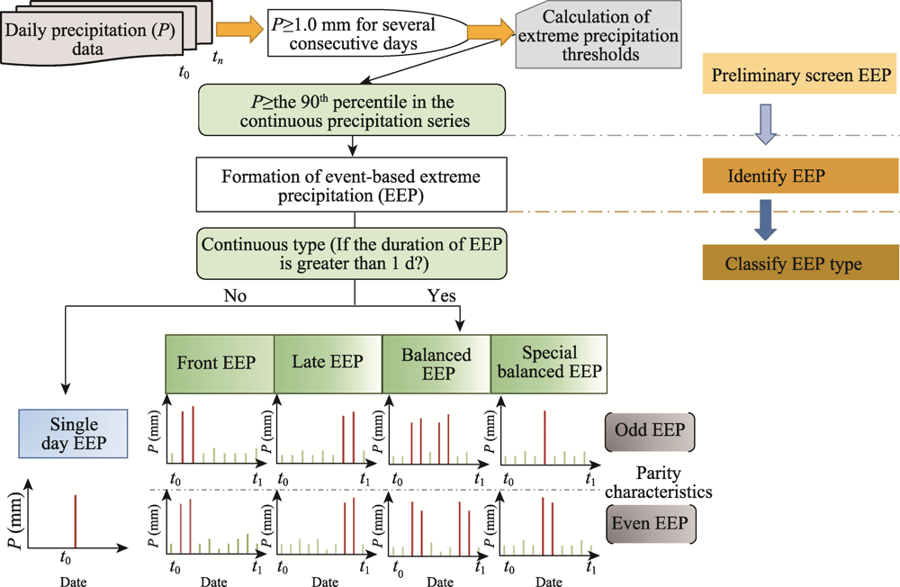
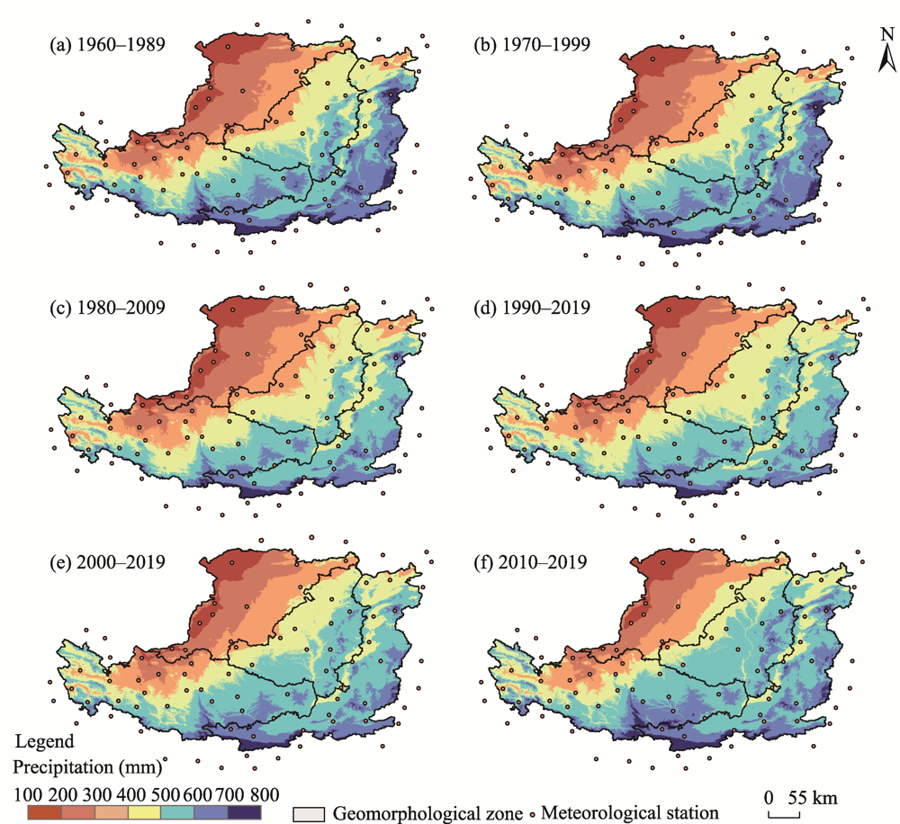
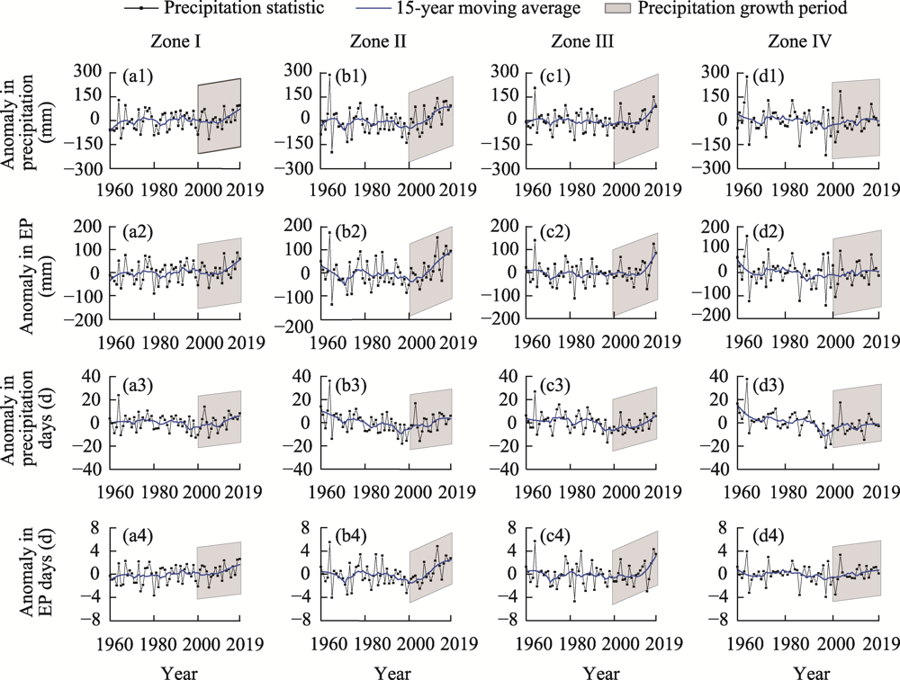
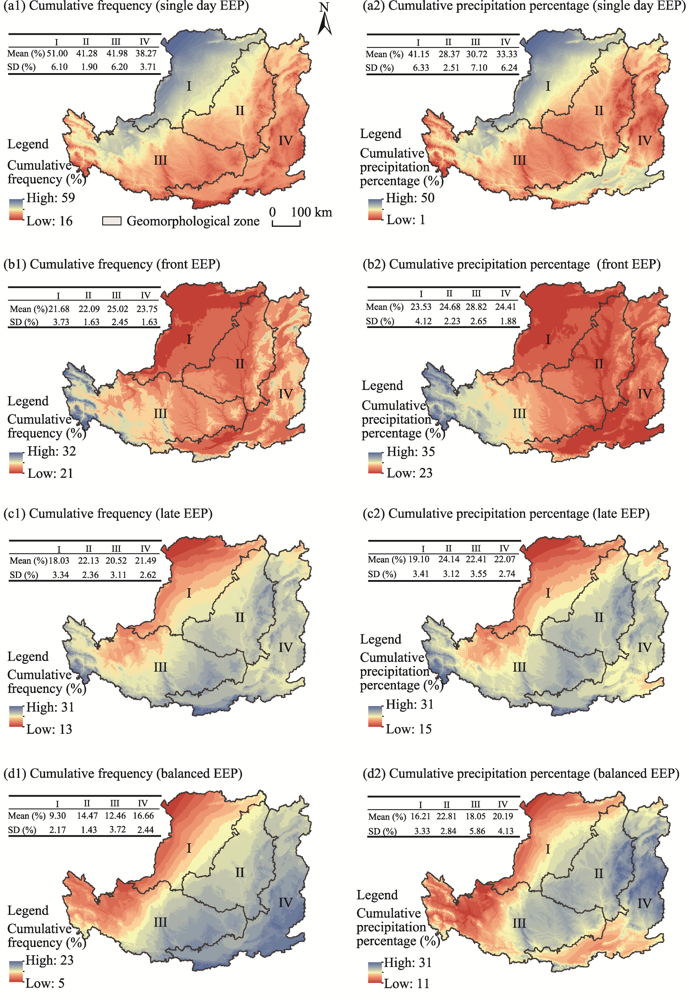
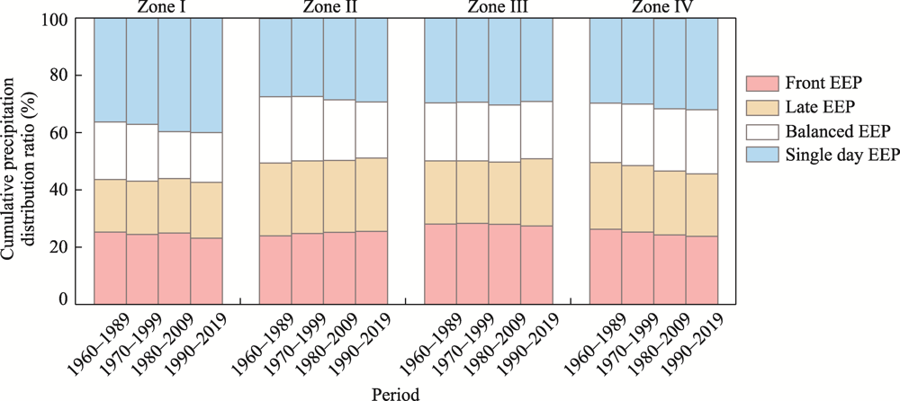
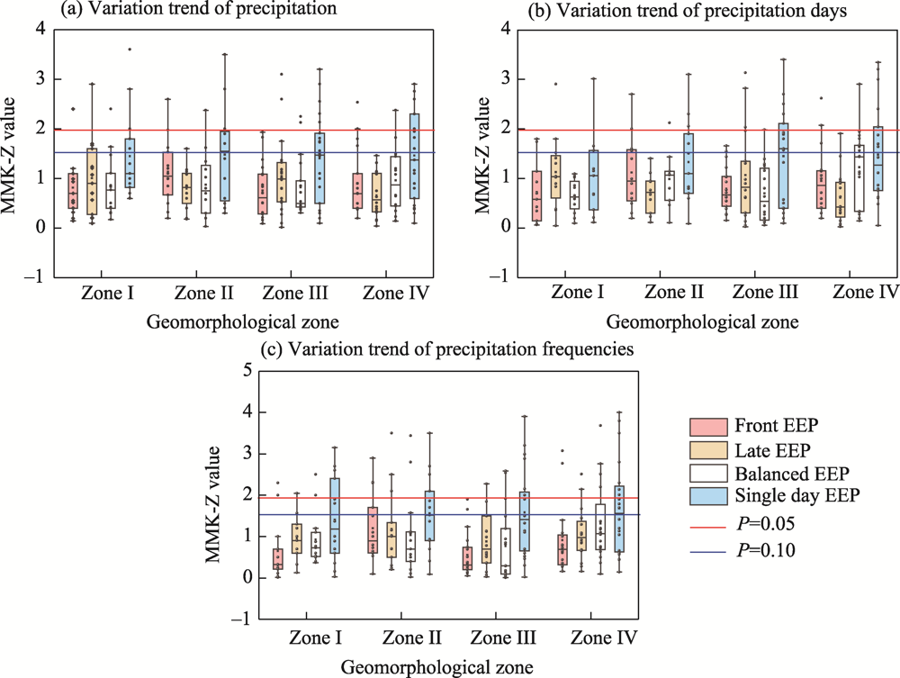
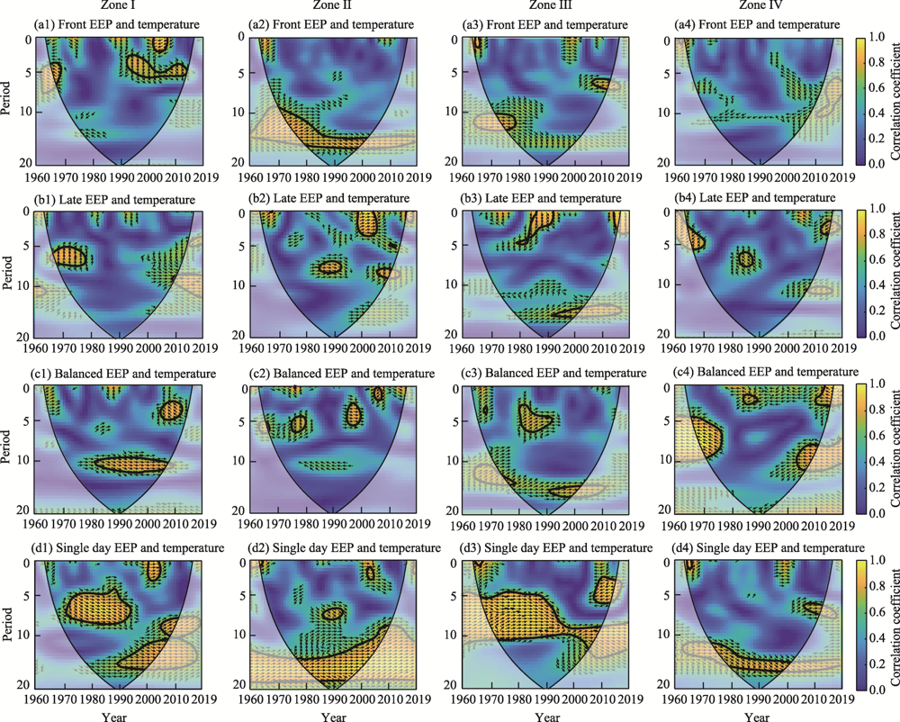
Abstract The preceding and succeeding precipitation (PSP) often act together with extreme precipitation (EP), in turn, causing floods, which is an objective component that is often overlooked with regard to summer flood hazards in the arid region of Northwest China. In this study, event-based extreme precipitation (EEP) was defined as continuous precipitation that includes at least one day of EP. We analyzed the spatiotemporal variation characteristics of four EEP types (front EEP, late EEP, balanced EEP, and single day EEP) across the Loess Plateau (LP) based on data acquired from 87 meteorological stations from 1960 to 2019. Precipitation on the LP basically maintained a spatial pattern of "low in the northwest region and high in the southeast region", and EP over the last 10 a increased significantly. The cumulative precipitation percentage of single day EEP was 34% and was dominant for 60 a, while the cumulative precipitation percentage of front, late, and balanced EEP types associated with PSP accounted for 66%, which confirms to the connotation of EEP. The cumulative frequencies of front and late EEP types were 23% and 21%, respectively, while the cumulative frequency of balanced EEP had the lowest value at only 13%. Moreover, global warming could lead to more single day EEP across the LP, and continuous EEP could increase in the northwestern region and decrease in the eastern region in the future. The concept of process-oriented EP could facilitate further exploration of disaster-causing processes associated with different types of EP, and provide a theoretical basis for deriving precipitation disaster chains and construction of disaster cluster characteristics.
|
|
Received: 08 June 2022
Published: 30 April 2023
|
|
Corresponding Authors:
*LI Peng (E-mail: lipeng74@163.com)
|
|
|
| [1] |
Aihaiti A, Jiang Z H, Zhu L H, et al. 2021. Risk changes of compound temperature and precipitation extremes in China under 1.5°C and 2°C global warming. Atmospheric Research, 264: 105838, doi: 10.1016/j.atmosres.2021.105838.
doi: 10.1016/j.atmosres.2021.105838
|
|
|
| [2] |
Back A J. 2011. Time distribution of heavy rainfall events in Urussanga, Santa Catarina State, Brazil. Acta Scientiarum Agronomy, 33(4): 583-588.
|
|
|
| [3] |
Caballero W, Rahman A. 2013. Variability in rainfall temporal patterns: a case study for New South Wales, Australia. Journal of Hydrology and Environment Research, 1(1): 41-48.
|
|
|
| [4] |
Cui Y S, Pan C Z, Liu C L, et al. 2020. Spatiotemporal variation and tendency analysis on rainfall erosivity in the Loess Plateau of China. Hydrology Research, 51(5): 1048-1062.
doi: 10.2166/nh.2020.030
|
|
|
| [5] |
Ding Y H, Liang P, Liu Y J, et al. 2020. Multiscale variability of Meiyu and its prediction: A new review. Journal of Geophysical Research: Atmospheres, 125(7): e2019JD031496, doi: 10.1029/2019JD031496.
doi: 10.1029/2019JD031496
|
|
|
| [6] |
Donat M G, Lowry A L, Alexander L V, et al. 2016. More extreme precipitation in the world's dry and wet regions. Nature Climate Change, 6: 508-513.
doi: 10.1038/NCLIMATE2941
|
|
|
| [7] |
Donat M G, Angélil O, Ukkola A M. 2019. Intensification of precipitation extremes in the world's humid and water-limited regions. Environmental Research Letters, 14(6): 065003, doi: 10.1088/1748-9326/ab1c8e.
doi: 10.1088/1748-9326/ab1c8e
|
|
|
| [8] |
Dunkerley D. 2012. Effects of rainfall intensity fluctuations on infiltration and runoff: rainfall simulation on dryland soils, Fowlers Gap, Australia. Hydrological Process, 26(15): 2211-2224.
|
|
|
| [9] |
Feng X, Fu B, Piao S, et al. 2016. Revegetation in China's Loess Plateau is approaching sustainable water resource limits. Nature Climate Change, 6: 1019-1022.
doi: 10.1038/nclimate3092
|
|
|
| [10] |
Fu S H, Yang Y F, Liu B Y, et al. 2020. Peak flow rate response to vegetation and terraces under extreme rainstorms. Agriculture, Ecosystems & Environment, 288: 106714, doi: 10.1016/j.agee.2019.106714.
doi: 10.1016/j.agee.2019.106714
|
|
|
| [11] |
Gao H D, Li Z B, Li P, et al. 2018. Paths and prevention and control of heavy rain and sediment production in the Loess Plateau-based on the understanding of the 2017-07- 26 heavy rain in the Wuding river basin. China Soil and Water Conservation Science, 16(4): 66-72. (in Chinese)
|
|
|
| [12] |
Gao Y, Feng Q, Liu W, et al. 2015. Changes of daily climate extremes in Loess Plateau during 1960-2013. Quaternary International, 371: 5-21.
doi: 10.1016/j.quaint.2014.08.052
|
|
|
| [13] |
Ghassabi Z, Kamali G A, Meshkatee A H, et al. 2016. Time distribution of heavy rainfall events in south west of Iran. Journal of Atmospheric and Solar-Terrestrial Physics, 145: 53-60.
doi: 10.1016/j.jastp.2016.03.006
|
|
|
| [14] |
Grinsted A, Moore J C, Jevrejeva S. 2004. Application of the cross wavelet transform and wavelet coherence to geophysical time series. Nonlin Processes Geophys, 11: 561-566.
doi: 10.5194/npg-11-561-2004
|
|
|
| [15] |
Guo E L, Zhang J Q, Wang Y F, et al. 2019. Spatiotemporal variations of extreme climate events in Northeast China during 1960-2014. Ecological Indicators, 96: 669-683.
|
|
|
| [16] |
Guo M M, Yang B, Wang W L, et al. 2019. Distribution, morphology and influencing factors of rills under extreme rainfall conditions in main land uses on the Loess Plateau of China. Geomorphology, 345: 106847, doi: 10.1016/j.geomorph.2019.106847.
doi: 10.1016/j.geomorph.2019.106847
|
|
|
| [17] |
Hamed K H, Rao A R. 1998. A modified Mann-Kendall trend test for autocorrelated data. Journal of Hydrology, 204(1-4): 182-196.
doi: 10.1016/S0022-1694(97)00125-X
|
|
|
| [18] |
Hamidreza M G, Hasan A, Mohammad J, et al. 2010. Study of the temporal distribution pattern of rainfall effect on runoff and sediment generation using rain simulator. World Applied Sciences Journal, 11: 64-69.
|
|
|
| [19] |
Han X Q, Zhao Y, Gao X R, et al. 2020. Virtual water output intensifies the water scarcity in Northwest China: Current situation, problem analysis and countermeasures. Science of the Total Environment, 765(11): 144276, doi: 10.1016/j.scitotenv.2020.144276.
doi: 10.1016/j.scitotenv.2020.144276
|
|
|
| [20] |
Hitchens N M, Brooks H E, Schumacher R S. 2013. Spatial and temporal characteristics of heavy hourly rainfall in the United States. Monthly Weather Review, 141(12): 4564-4575.
doi: 10.1175/MWR-D-12-00297.1
|
|
|
| [21] |
Hu L, Li Y D, Song Y, et al. 2011. Seasonal variability in tropical and subtropical convective and stratiform precipitation of the East Asian monsoon. Science China Earth Sciences, 54(10): 1595-1603.
doi: 10.1007/s11430-011-4225-y
|
|
|
| [22] |
Hutchinson M F, Mckenney D W, Lawrence K, et al. 2009. Development and testing of Canada-wide interpolated spatial models of daily minimum-maximum temperature and precipitation for 1961-2003. Journal of Applied Meteorology & Climatology, 48(4): 725-741.
|
|
|
| [23] |
IPCC. 2014. Climate Change 2014: Synthesis Report:Contribution of Working Groups I, II and III to the Fifth Assessment Report of the Intergovernmental Panel on Climate Change. [2022-01-10]. https://www.ipcc.ch/report/ar5/syr/.
|
|
|
| [24] |
IPCC. 2021. Climate Change 2021:The Physical Science Basis. Contribution of Working Group I to the Sixth Assessment Report of the Intergovernmental Panel on Climate Change. [2022-02-15]. .
|
|
|
| [25] |
Jia L, Yu K X, Li Z B, et al. 2021. Temporal and spatial variation of rainfall erosivity in the Loess Plateau of China and its impact on sediment load. CATENA, 210: 105931, doi: 10.1016/j.catena.2021.105931.
doi: 10.1016/j.catena.2021.105931
|
|
|
| [26] |
Jin F M, Yang W C, Fu J X, et al. 2021. Effects of vegetation and climate on the changes of soil erosion in the Loess Plateau of China. Science of the Total Environment, 773: 145514, doi: 10.1016/j.scitotenv.2021.145514.
doi: 10.1016/j.scitotenv.2021.145514
|
|
|
| [27] |
Jin S Y, Gao W Y, Luo S W, et al. 2018. Analysis on the return period of "7.26" rainstorm and flood in 2017 in the Wudinghe basin. MATEC Web of Conferences, 246: 01105, doi: 10.1051/matecconf/201824601105.
doi: 10.1051/matecconf/201824601105
|
|
|
| [28] |
Li J J, Feng Z D, Tang L Y. 1988. Late quaternary monsoon patterns on the Loess Plateau of China. Earth Surface Processes and Landforms, 13(2): 125-135.
doi: 10.1002/(ISSN)1096-9837
|
|
|
| [29] |
Li S S, Wang C B, Yan J P, et al. 2020. The temporal and spatial variation characteristics of extreme precipitation in the north and south of the Qinling mountains oriented to the event process. Acta Geologica Sinica, 75: 989-1007. (in Chinese)
|
|
|
| [30] |
Li S S, Kong F, Han L, et al. 2022. The temporal and spatial variation characteristics of extreme precipitation in the Loess Plateau of northern Shaanxi and its influencing factors. Geographical Research, 39(1): 140-151. (in Chinese)
|
|
|
| [31] |
Liu L Y, Lu R J, Ding Z Y, et al. 2021. Analysis on the characteristics and causes of climate change in the Loess Plateau. Journal of the Earth Environment, 12: 615-631. (in Chinese)
|
|
|
| [32] |
Lin Q G, Wang Y, Glade T, et al. 2020. Assessing the spatiotemporal impact of climate change on event rainfall characteristics influencing landslide occurrences based on multiple GCM projections in China. Climatic Change, 162: 761-779.
doi: 10.1007/s10584-020-02750-1
|
|
|
| [33] |
Liu S Y, Huang S Z, Xie Y Y, et al. 2018. Spatial-temporal changes of rainfall erosivity in the Loess Plateau, China: changing patterns, causes and implications. CATENA, 166: 279-289.
doi: 10.1016/j.catena.2018.04.015
|
|
|
| [34] |
Liu Y H, Tang C, Li T F, et al. 2009. Study on the relationship between geological hazards and rainfall patterns. Journal of Engineering Geology, 17: 6-10. (in Chinese)
|
|
|
| [35] |
Liu Z H, Wu G C. 2021. Quantifying the precipitation-temperature relationship in China during 1961-2018. International Journal of Climatology, 42(5): 2656-2669.
|
|
|
| [36] |
Lu S, Hu Z Y, Fu C W, et al. 2022. Analysis of extreme precipitation in the Loess Plateau in summer and its causes. Plateau Meteorology, 41(1): 241-254. (in Chinese)
|
|
|
| [37] |
Luo Y, Chen Y. 2015. Investigation of the predictability and physical mechanisms of an extreme-rainfall-producing mesoscale convective system along the Meiyu front in East China: An ensemble approach. Journal of Geophysical Research Atmospheres, 120(20): 10593-10618.
doi: 10.1002/2015JD023584
|
|
|
| [38] |
Malinovic-Milicevic S, Radovanovic M M, Stanojevic G, et al. 2016. Recent changes in Serbian climate extreme indices from 1961 to 2010. Theoretical and Applied Climatology, 124: 1089-1098.
doi: 10.1007/s00704-015-1491-1
|
|
|
| [39] |
Miao C Y, Sun Q H, Duan Q Y, et al. 2016. Joint analysis of changes in temperature and precipitation on the Loess Plateau during the period 1961-2011. Climate Dynamics, 47(9-10): 3221-3234.
doi: 10.1007/s00382-016-3022-x
|
|
|
| [40] |
Paul S, Ghosh S, Mathew M, et al. 2018. Increased spatial variability and intensification of extreme monsoon rainfall due to urbanization. Scientific Reports, 8: 3918, doi: 10.1038/s41598-018- 22322-9.
doi: 10.1038/s41598-018-22322-9
pmid: 29500451
|
|
|
| [41] |
Peterse F, Prins M A, Beets C J, et al. 2011. Decoupled warming and monsoon precipitation in East Asia over the last deglaciation. Earth and Planetary Science Letters, 301(1-2): 256-264.
doi: 10.1016/j.epsl.2010.11.010
|
|
|
| [42] |
Sillmann J, Kharin V V, Zhang X, et al. 2013. Climate extremes indices in the CMIP5 multimodel ensemble: Part 1. Model evaluation in the present climate. Journal of Geophysical Research Atmospheres, 118(4): 1716-1733.
doi: 10.1002/jgrd.v118.4
|
|
|
| [43] |
Sun C F, Ma Y Y. 2015. Effects of non-linear temperature and precipitation trends on Loess Plateau drought. Quaternary International, 372: 175-179.
doi: 10.1016/j.quaint.2015.01.051
|
|
|
| [44] |
Sun Q H, Miao C Y, Duan Q Y, et al. 2015. Temperature and precipitation changes over the Loess Plateau between 1961 and 2011, based on high-density gauge observations. Global and Planetary Change, 132: 1-10.
doi: 10.1016/j.gloplacha.2015.05.011
|
|
|
| [45] |
Torrence C, Compo G P. 1998. A practical guide to wavelet analysis. Bulletin of the American Meteorological Society, 79(1): 61-78.
doi: 10.1175/1520-0477(1998)079<0061:APGTWA>2.0.CO;2
|
|
|
| [46] |
Wang K B, Deng L, Shangguan Z P, et al. 2021. Sustainability of eco- environment in semi-arid regions: Lessons from the Chinese Loess Plateau. Environmental Science & Policy, 125: 126-134.
|
|
|
| [47] |
Wang L L, Yao W Y, Xiao P Q, et al. 2022. The spatiotemporal characteristics of flow-sediment relationships in a hilly watershed of the Chinese Loess Plateau. International Journal of Environmental Research and Public Health, 19(15): 9089, doi: 10.3390/ijerph19159089.
doi: 10.3390/ijerph19159089
|
|
|
| [48] |
Wang N, Jiao J Y, Bai L C, et al. 2020. Magnitude of soil erosion in small catchments with different land use patterns under an extreme rainstorm event over the Northern Loess Plateau, China. CATENA, 195: 104780, doi: 10.1016/j.catena.2020.104780.
doi: 10.1016/j.catena.2020.104780
|
|
|
| [49] |
Wang X H, Wang B T, Xu X Y. 2019. Effects of large-scale climate anomalies on trends in seasonal precipitation over the Loess Plateau of China from 1961 to 2016. Ecological Indicators, 107: 105643, doi: 10.1016/j.ecolind.2019.105643.
doi: 10.1016/j.ecolind.2019.105643
|
|
|
| [50] |
Wang X L, Chen H F, Wu Y H, et al. 2010. New techniques for detection and adjustment of shifts in daily precipitation data series. Journal of Applied Meteorology and Climatology, 49(12): 2416-2436.
doi: 10.1175/2010JAMC2376.1
|
|
|
| [51] |
Wang Y R, Wang X W. 2006. Analysis of the temporal and spatial variation of rainfall in the Loess Plateau of China from April to October. Plateau Meteorology, 25(4): 737-743. (in Chinese)
|
|
|
| [52] |
White R H, Battisti D S, Skok G. 2017. Tracking precipitation events in time and space in gridded observational data. Geophysical Research Letters, 44(16): 8637-8646.
doi: 10.1002/2017GL074011
|
|
|
| [53] |
Wu S H, Liu L L, Gao J B, et al. 2019. Integrate risk from climate change in China under global warming of 1.5 and 2.0°C. Earth's Future, 7(12): 1307-1322.
doi: 10.1029/2019EF001194
|
|
|
| [54] |
Wu W, Ren L, Wei Y, et al. 2021. Impacts of urbanization on extreme regional precipitation events. Discrete Dynamics in Nature and Society, 5: 1-17.
doi: 10.1155/S1026022600000339
|
|
|
| [55] |
Wu X S, Guo S L, Yin J B, et al. 2018. On the event-based extreme precipitation across China: Time distribution patterns, trends, and return levels. Journal of Hydrology, 562: 305-317.
doi: 10.1016/j.jhydrol.2018.05.028
|
|
|
| [56] |
Xiao C, Wu P L, Zhang L X, et al. 2016. Robust increase in extreme summer rainfall intensity during the past four decades observed in China. Scientific Reports, 6: 38506, doi: 10.1038/srep38506.
doi: 10.1038/srep38506
pmid: 27917927
|
|
|
| [57] |
Xu K, Xu B B, Ju J L, et al. 2019. Projection and uncertainty of precipitation extremes in the CMIP5 multimodel ensembles over nine major basins in China. Atmospheric Research, 226: 122-137.
doi: 10.1016/j.atmosres.2019.04.018
|
|
|
| [58] |
Yang H, Liu M, Wang M, et al. 2022. Projections of extreme precipitation in the middle and upper Yangtze River at 1.5°C and 2°C warming thresholds based on bias correction. Theoretical and Applied Climatology, 147: 1589-1600.
doi: 10.1007/s00704-021-03899-0
|
|
|
| [59] |
Yang L J, Wang C M, Zhang C M, et al. 2022. Based on remote sensing images to study the occurrence and development of new cut ditch under extreme rainstorm conditions. Chinese Journal of Agricultural Engineering, 38(6): 96-104. (in Chinese)
|
|
|
| [60] |
Yang Y F, Wang B, Wang G L, et al. 2019. Ecological zoning and overview of the Loess Plateau. Journal of Ecology, 39(20): 7389-7397. (in Chinese)
|
|
|
| [61] |
Yao J Q, Chen Y N, Chen J, et al. 2020. Intensification of extreme precipitation in arid Central Asia. Journal of Hydrology, 598: 125760, doi: 10.1016/j.jhydrol.2020.125760.
doi: 10.1016/j.jhydrol.2020.125760
|
|
|
| [62] |
Yao W Y, Hou S Z, Guo Y, et al. 2018. Analysis of the causes of disasters caused by the "7•26" rainstorm in the urban areas of Suide and Zizhou in northern Shaanxi. China Flood Control and Drought Relief, 28: 27-32. (in Chinese)
|
|
|
| [63] |
Zaman M, Ahmad I, Usman M, et al. 2020. Event-based time distribution patterns, return levels, and their trends of extreme precipitation across Indus basin. Water, 12: 3373, doi: 10.3390/w12123373.
doi: 10.3390/w12123373
|
|
|
| [64] |
Zhang B Q, Shao R, Zhao X N, et al. 2020. The impact of large-scale vegetation restoration on the ecological and hydrological processes of the Loess Plateau. Journal of Applied Basic and Engineering Sciences, 28(3): 594-606. (in Chinese)
|
|
|
| [65] |
Zhao G J, Zhai J Q, Tian P, et al. 2018. Variations in extreme precipitation on the Loess Plateau using a high-resolution dataset and their linkages with atmospheric circulation indices. Theoretical and Applied Climatology, 133: 1235-1247.
doi: 10.1007/s00704-017-2251-1
|
|
|
|
Viewed |
|
|
|
Full text
|
|
|
|
|
Abstract
|
|
|
|
|
Cited |
|
|
|
|
| |
Shared |
|
|
|
|
| |
Discussed |
|
|
|
|