| Research article |
|


|
|
|
| Glacier mass balance in High Mountain Asia inferred from a GRACE release-6 gravity solution for the period 2002-2016 |
XIANG Longwei1,2, WANG Hansheng2,3,*( ), JIANG Liming2,3, SHEN Qiang2,3, Holger STEFFEN4, LI Zhen2,3 ), JIANG Liming2,3, SHEN Qiang2,3, Holger STEFFEN4, LI Zhen2,3 |
1School of Geosciences, Yangtze University, Wuhan 430100, China
2State Key Laboratory of Geodesy and Earth's Dynamics, Innovation Academy for Precision Measurement Science and Technology, Chinese Academy of Sciences, Wuhan 430077, China
3University of Chinese Academy of Sciences, Beijing 100049, China
4Geodetic Infrastructure, Lantmäteriet, Gävle 80182, Sweden |
|
|
|
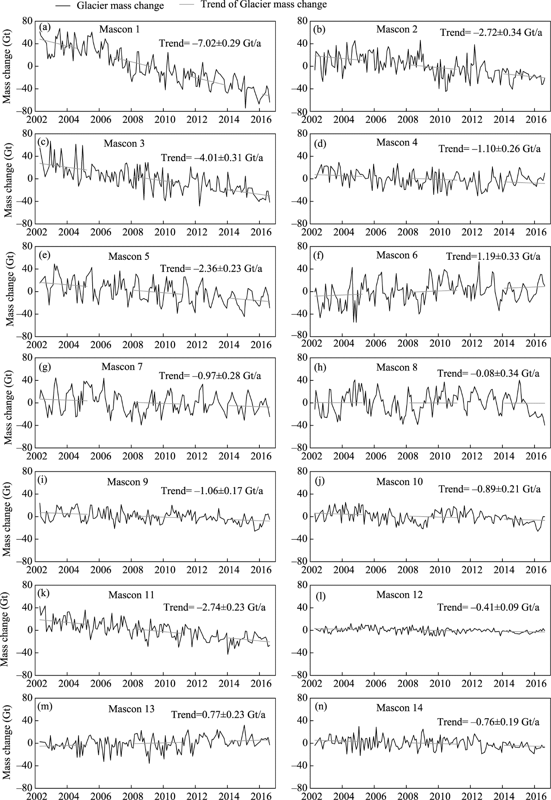
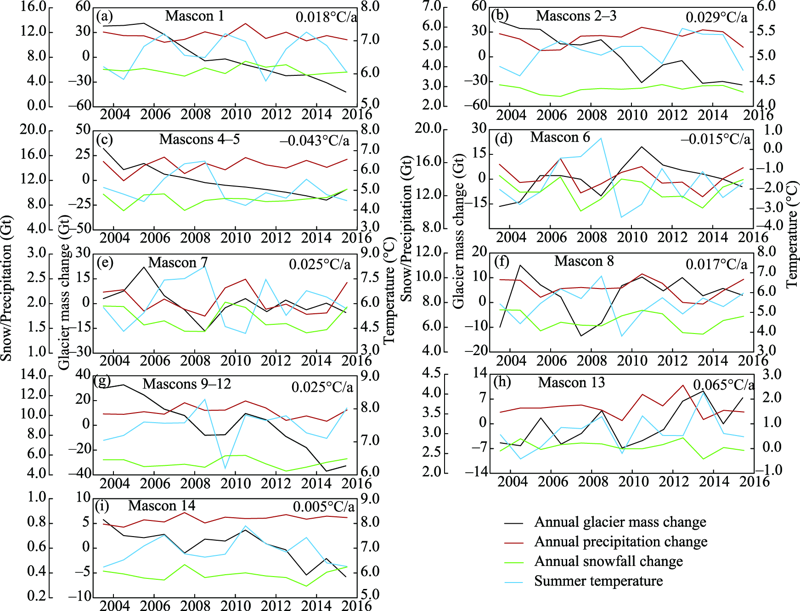
Abstract We provide estimates of glacier mass changes in the High Mountain Asia (HMA) area from April 2002 to August 2016 by employing a new version of gravity solutions of the Gravity Recovery and Climate Experiment (GRACE) twin-satellite mission. We found a total mass loss trend of the HMA glaciers at a rate of -22.17 (±1.96) Gt/a. The largest mass loss rates of -7.02 (±0.94) and -6.73 (±0.78) Gt/a are found for the glaciers in Nyainqentanglha Mountains and Eastern Himalayas, respectively. Although most glaciers in the HMA area show a mass loss, we find a small glacier mass gain of 1.19 (±0.55) and 0.77 (±0.37) Gt/a in Karakoram Mountains and West Kunlun Mountains, respectively. There is also a nearly zero mass balance in Pamirs. Our estimates of glacier mass change trends confirm previous results from the analysis of altimetry data of the ICESat (Ice, Cloud and Land Elevation) and ASTER (Advanced Spaceborne Thermal Emission and Reflection Radiometer) DEM (Digital Elevation Model) satellites in most of the selected glacier areas. However, they largely differ to previous GRACE-based studies which we attribute to our different post-processing techniques of the newer GRACE data. In addition, we explicitly show regional mass change features for both the interannual glacier mass changes and the 14-a averaged seasonal glacier mass changes. These changes can be explained in parts by total net precipitation (net snowfall and net rainfall) and net snowfall, but mostly by total net radiation energy when compared to data from the ERA5-Land meteorological reanalysis. Moreover, nearly all the non-trend interannual mass changes and most seasonal mass changes can be explained by the total net radiation energy data. The mass loss trends could be partly related to a heat effect due to increased net rainfall in Tianshan Mountains, Qilian Mountains, Nyainqentanglha Mountains and Eastern Himalayas. Our new results for the glacier mass change in this study could help improve the understanding of glacier variation in the HMA area and contribute to the study of global change. They could also serve the utilization of water resources there and in neighboring areas.
|
|
Received: 17 April 2020
Published: 10 March 2021
|
|
Corresponding Authors:
|
About author: * WANG Hansheng (E-mail: whs@whigg.ac.cn)
|
|
|
| [1] |
Bettadpur S. 2012. UTCSR Level-2 processing stands document for Level-2 product release 0005, Center for Space Research, Technical Report GRACE. University of Texes, Austin, USA.
|
|
|
| [2] |
Brock B W, Mihalcea C, Kirkbride M P, et al. 2010. Meteorology and surface energy fluxes in the 2005-2007 ablation seasons at the Miage debris-covered glacier, Mont Blanc Massif, Italian Alps. Journal of Geophysical Research Atmospheres, 115(9):1-16.
|
|
|
| [3] |
Brun F, Berthier E, Wagnon P, et al. 2017. A spatially resolved estimate of High Mountain Asia glacier mass balances from 2000 to 2016. Nature Geoscience, 10(9):668-673.
pmid: 28890734
|
|
|
| [4] |
Cannon F, Carvalho L M V, Jones C, et al. 2015. Multi-annual variations in winter westerly disturbance activity affecting the Himalaya. Climate Dynamics, 44:441-455.
|
|
|
| [5] |
Chambers D P. 2006. Evaluation of new GRACE time-variable gravity data over the ocean. Geophysical Research Letters, 33(17):L17603.
|
|
|
| [6] |
Chen J L, Wilson C R, Seo K W. 2009. S2 tide aliasing in GRACE time-variable gravity solutions. Journal of Geodesy, 83:679-687.
|
|
|
| [7] |
Chen J L, Wilson C R, Ries J C. 2016. Broad-band assessment of degree-2 gravitational changes from GRACE and other estimates, 2002-2015. Journal of Geophysical Research Solid Earth, 121(3):2112-2128.
|
|
|
| [8] |
Chen Q, Shen Y, Zhang X, et al. 2015. Tongji-GRACE01: a GRACE-only static gravity field model recovered from GRACE level-1B data using modified short arc approach. Advances in Space Research, 56(5):941-951.
|
|
|
| [9] |
Cheng M, Tapley B D. 2004. Variations in the Earth's oblateness during the past 28 years. Journal of Geophysical Research, 109(9):B09402, doi: 10.1029/2004JB003028.
|
|
|
| [10] |
Cheng M, Tapley B D, Ries J C. 2013. Deceleration in the Earth's oblateness. Journal of Geophysical Research, 118(2):740-747.
|
|
|
| [11] |
Cogley J G, Hock R, Rasmussen L A, et al. 2011. Glossary of Glacier Mass Balance and Related Terms, IHP-VII Technical Documents in Hydrology No. 86, IACS Contribution No. 2, UNESCO-IHP, Paris.
|
|
|
| [12] |
Dahle C, Flechtner F, Gruber C, et al. 2012. GFZ GRACE level-2 processing standards document for level-2 product release 0005. Scientific Technical Report STR12/02-Data. Potsdam, Gemany.
|
|
|
| [13] |
de Kok R J, Tuinenburg O A, Bonekamp P N J, et al. 2018. Irrigation as a potential driver for anomalous glacier behavior in High Mountain Asia. Geophysical Research Letters, 45(4):2047-2054.
doi: 10.1002/2017GL076158
pmid: 29937602
|
|
|
| [14] |
Farinotti D, Longuevergne L, Moholdt G, et al. 2015. Substantial glacier mass loss in the Tien Shan over the past 50 years. Nature Geoscience, 8:716-723.
|
|
|
| [15] |
Farinotti D, Immerzeel W W, de Kok R J, et al. 2020. Manifestations and mechanisms of the Karakoram glacier Anomaly. Nature Geoscience, 13:8-16.
doi: 10.1038/s41561-019-0513-5
pmid: 31915463
|
|
|
| [16] |
Gardner A S, Moholdt G, Graham C J, et al. 2013. A reconciled estimate of glacier contributions to sea level rise: 2003 to 2009. Science, 340(6134):852-857.
doi: 10.1126/science.1234532
pmid: 23687045
|
|
|
| [17] |
Hersbach H, Bell B, Berrisford P, et al. 2020. The ERA5 global reanalysis. Quarterly Journal of the Royal Meteorological Society, 146(730):1999-2049.
|
|
|
| [18] |
Jacob T, Wahr J, Pfeffer W T, et al. 2012. Recent contributions of glaciers and ice caps to sea level rise. Nature, 482:514-518.
pmid: 22318519
|
|
|
| [19] |
Jekeli C. 1981. Alternative methods to smooth the Earth's gravity field. Report No. 327, Department of Civil and Environmental Engineering and Geodetic /science, Ohio State University, Columbus, USA.
|
|
|
| [20] |
Kääb A, Berthier E, Nuth C, et al. 2012. Contrasting patterns of early twenty-first-century glacier mass change in the Himalayas. Nature, 488(7412):495-498.
pmid: 22914167
|
|
|
| [21] |
Kääb A, Treichler D, Nuth C, et al. 2015. Brief Communication: Contending estimates of 2003-2008 glacier mass balance over the Pamir-Karakoram-Himalaya. The Cryosphere, 9:557-564.
|
|
|
| [22] |
Kvas A, Behzadpour S, Ellmer M, et al. 2019. ITSG-Grace2018: Overview and evaluation of a new GRACE-only gravity field time series. Journal of Geophysical Research Solid Earth, 124(8):9332-9344.
|
|
|
| [23] |
Longuevergne L, Scanlon B R, Wilson C R. 2010. GRACE Hydrological estimates for small basins: Evaluating processing approaches on the High Plains Aquifer, USA. Water Resources Research, 46(11):W11517. doi: 10.1029/2009WR008564.
|
|
|
| [24] |
Matsuo K, Heki K. 2010. Time-variable ice loss in Asian high mountains from satellite gravimetry. Earth and Planetary Science Letters, 290(1-2):30-36.
|
|
|
| [25] |
Mayer-Gürr T, Behzadpour S, Ellmer M, et al. 2016. ITSG-Grace2016-monthly and daily gravity field solutions from GRACE. GFZ Data Services. doi: 10.5880/icgem.2016.007.
|
|
|
| [26] |
Muñoz-Sabater J. 2019. First ERA5-Land dataset to be released this spring. ECMWF Newsletter, 159:8-9.
|
|
|
| [27] |
Neckel N, Kropáček J, Bolch T, et al. 2014. Glacier mass changes on the Tibetan Plateau 2003-2009 derived from ICESat laser altimetry measurements. Environmental Research Letters, 9:014009. doi: 10.1088/1748-9326/9/1/014009.
|
|
|
| [28] |
Palazzi E, von Hardenberg J, Provenzale A. 2013. Precipitation in the Hindu-Kush Karakoram Himalaya: observations and future scenarios. Journal of Geophysical Research Atmosphere, 118(1):85-100.
|
|
|
| [29] |
Peidou A, Pagiatakis S. 2020. Stripe mystery in GRACE geopotential models revealed. Geophysical Research Letters, 47(4): e2019GL085497. doi: 10.1029/2019GL085497.
pmid: 32713977
|
|
|
| [30] |
Peltier W R, Argus D F, Drummond R. 2015. Space geodesy constrains ice-age terminal deglaciation: The global ICE-6G_C (VM5a) model. Journal of Geophysical Research Solid Earth, 120(1):450-487.
|
|
|
| [31] |
Pritchard H D. 2019. Asia's shrinking glaciers protect large populations from drought stress. Nature, 569:649-654.
doi: 10.1038/s41586-019-1240-1
pmid: 31142854
|
|
|
| [32] |
RGI Consortium. 2017. Randolph Glacier Inventory-A Dataset of Global Glacier Outlines: Version 6.0: Technical Report, Global Land Ice Measurements from Space, Colorado, USA. Digital Media, doi: 10.7265/N5-RGI-60.
|
|
|
| [33] |
Rodell M, Houser P R, Jambor U. 2004. The global land data assimilation system. Bulletin of the American Meteorological Society, 85(3):381-394.
|
|
|
| [34] |
Rodell M, Velicogna I, Famiglietti J S. 2009. Satellite-based estimates of groundwater depletion in India. Nature, 460:999-1002. doi: 10.1038/nature08238.
doi: 10.1038/nature08238
pmid: 19675570
|
|
|
| [35] |
Rodriguez E, Morris C S, Belz J E. 2006. A global assessment of the SRTM performance. Photogrammetric Engineering and Remote Sensing, 72(3):249-260.
|
|
|
| [36] |
Swenson S, Wahr J. 2006. Post-processing removal of correlated errors in GRACE data. Geophysical Research Letters, 33(8):L08402. doi: 10.1029/2005gl025285.
|
|
|
| [37] |
Swenson S, Chambers D, Wahr J. 2008. Estimating geocenter variations from a combination of GRACE and ocean model output. Journal of Geophysical Research, 113(8):B08410. doi: 10.1029/2007JB005338.
|
|
|
| [38] |
Wahr J, Molenaar M, Bryan F. 1998. Time variability of the Earth's gravity field: Hydrological and oceanic effects and their possible detection using GRACE. Journal of Geophysical Research, 103(B12):30205-30229.
|
|
|
| [39] |
Wang F, Bamber J L, Cheng X. 2015. Accuracy and performance of CryoSat-2 SARIn mode data over Antarctica. IEEE Geoscience and Remote Sensing Letters, 12(7):1516-1520.
|
|
|
| [40] |
Wang H, Xiang L, Jia L, et al. 2012. Load Love numbers and Green's functions for elastic Earth models PREM, iasp91, ak135, and modified models with refined crustal structure from Crust 2.0. Computers & Geosciences, 49:190-199.
|
|
|
| [41] |
Watkins M, Yuan D N. 2012. JPL Level-2 processing standards document for Level-2 product release 05. GRACE 327-744,(v 5.1), Jet Propulsion Laboratory, Pasadena, USA.
|
|
|
| [42] |
Xiang L, Wang H, Steffen H, et al. 2016. Groundwater storage changes in the Tibetan Plateau and adjacent areas revealed from GRACE satellite gravity data. Earth and Planetary Science Letters, 449:228-239.
|
|
|
| [43] |
Xiang L, Wang H, Jia L. 2017. The variability of terrestrial water storage changes in the Tibetan Plateau and adjacent areas retrieved by GRACE data. Journal of Geodesy and Geodynamics, 37(3):311-318.
|
|
|
| [44] |
Yao T D, Thompson L, Yang W, et al. 2012. Different glacier status with atmospheric circulations in Tibetan Plateau and surroundings. Nature Climate Change, 2:663-667.
|
|
|
| [45] |
Yi S, Sun W. 2014. Evaluation of glacier changes in high-mountain Asia based on 10 year GRACE RL05 models. Journal of Geophysical Research Solid Earth, 119(3):2504-2517.
|
|
|
| [46] |
Zhang G, Yao T, Xie H, et al. 2013. Increased mass over the Tibetan Plateau: from lakes or glaciers? Geophysical Research Letters, 40(10):2125-2130.
|
|
|
| [47] |
Zhou H, Luo Z, Zhou Z, et al. 2016. A new time series of GRACE monthly gravity field models: HUST-Grace2016. GFZ Data Services. doi: 10.5880/ICGEM.2016.009.
|
|
|
| [48] |
Zwally H J, Schutz B, Abdalati W, et al. 2002. ICESat's laser measurements of polar ice, atmosphere, ocean, and land. Journal of Geodynamics, 34(3-4):405-445.
|
|
|
|
Viewed |
|
|
|
Full text
|
|
|
|
|
Abstract
|
|
|
|
|
Cited |
|
|
|
|
| |
Shared |
|
|
|
|
| |
Discussed |
|
|
|
|