| Research article |
|

|
|
|
| Seasonal variations in glacier velocity in the High Mountain Asia region during 2015-2020 |
ZHANG Zhen1,*( ), XU Yangyang1, LIU Shiyin2, DING Jing1, ZHAO Jinbiao1 ), XU Yangyang1, LIU Shiyin2, DING Jing1, ZHAO Jinbiao1 |
1School of Geomatics, Anhui University of Science and Technology, Huainan 232001, China
2Institute of International Rivers and Eco-Security, Yunnan University, Kunming 650091, China |
|
|
|
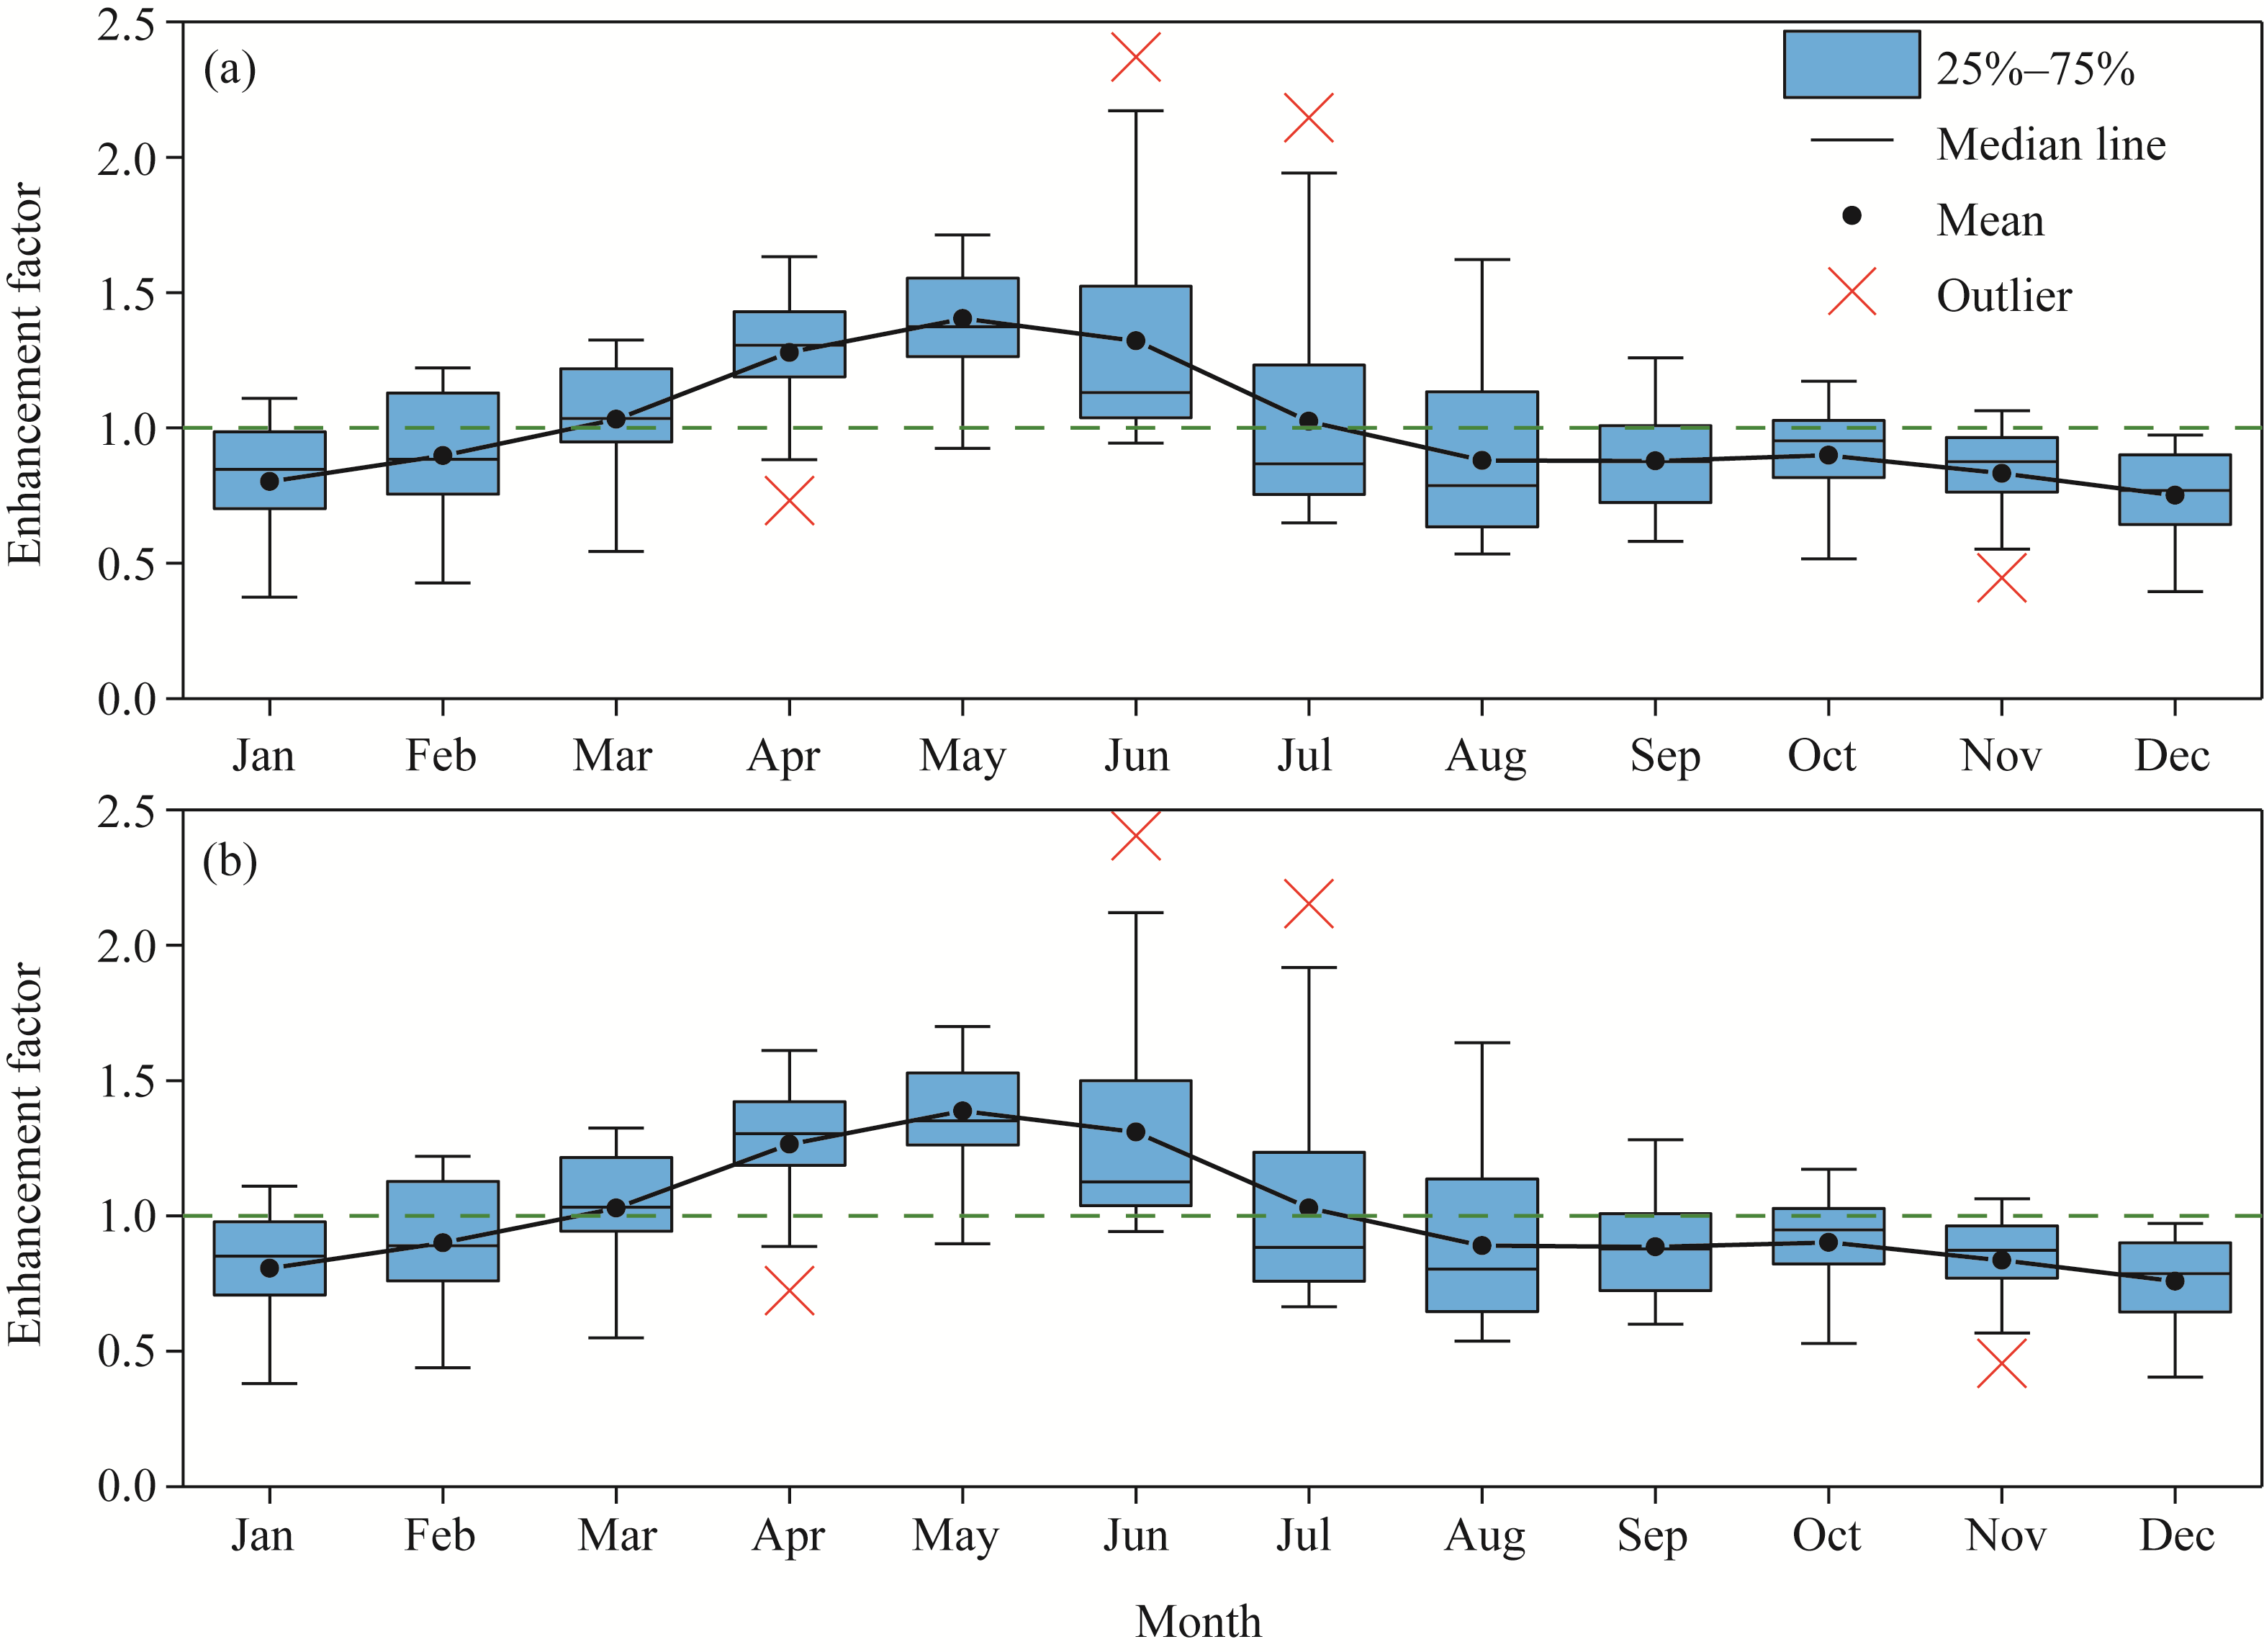
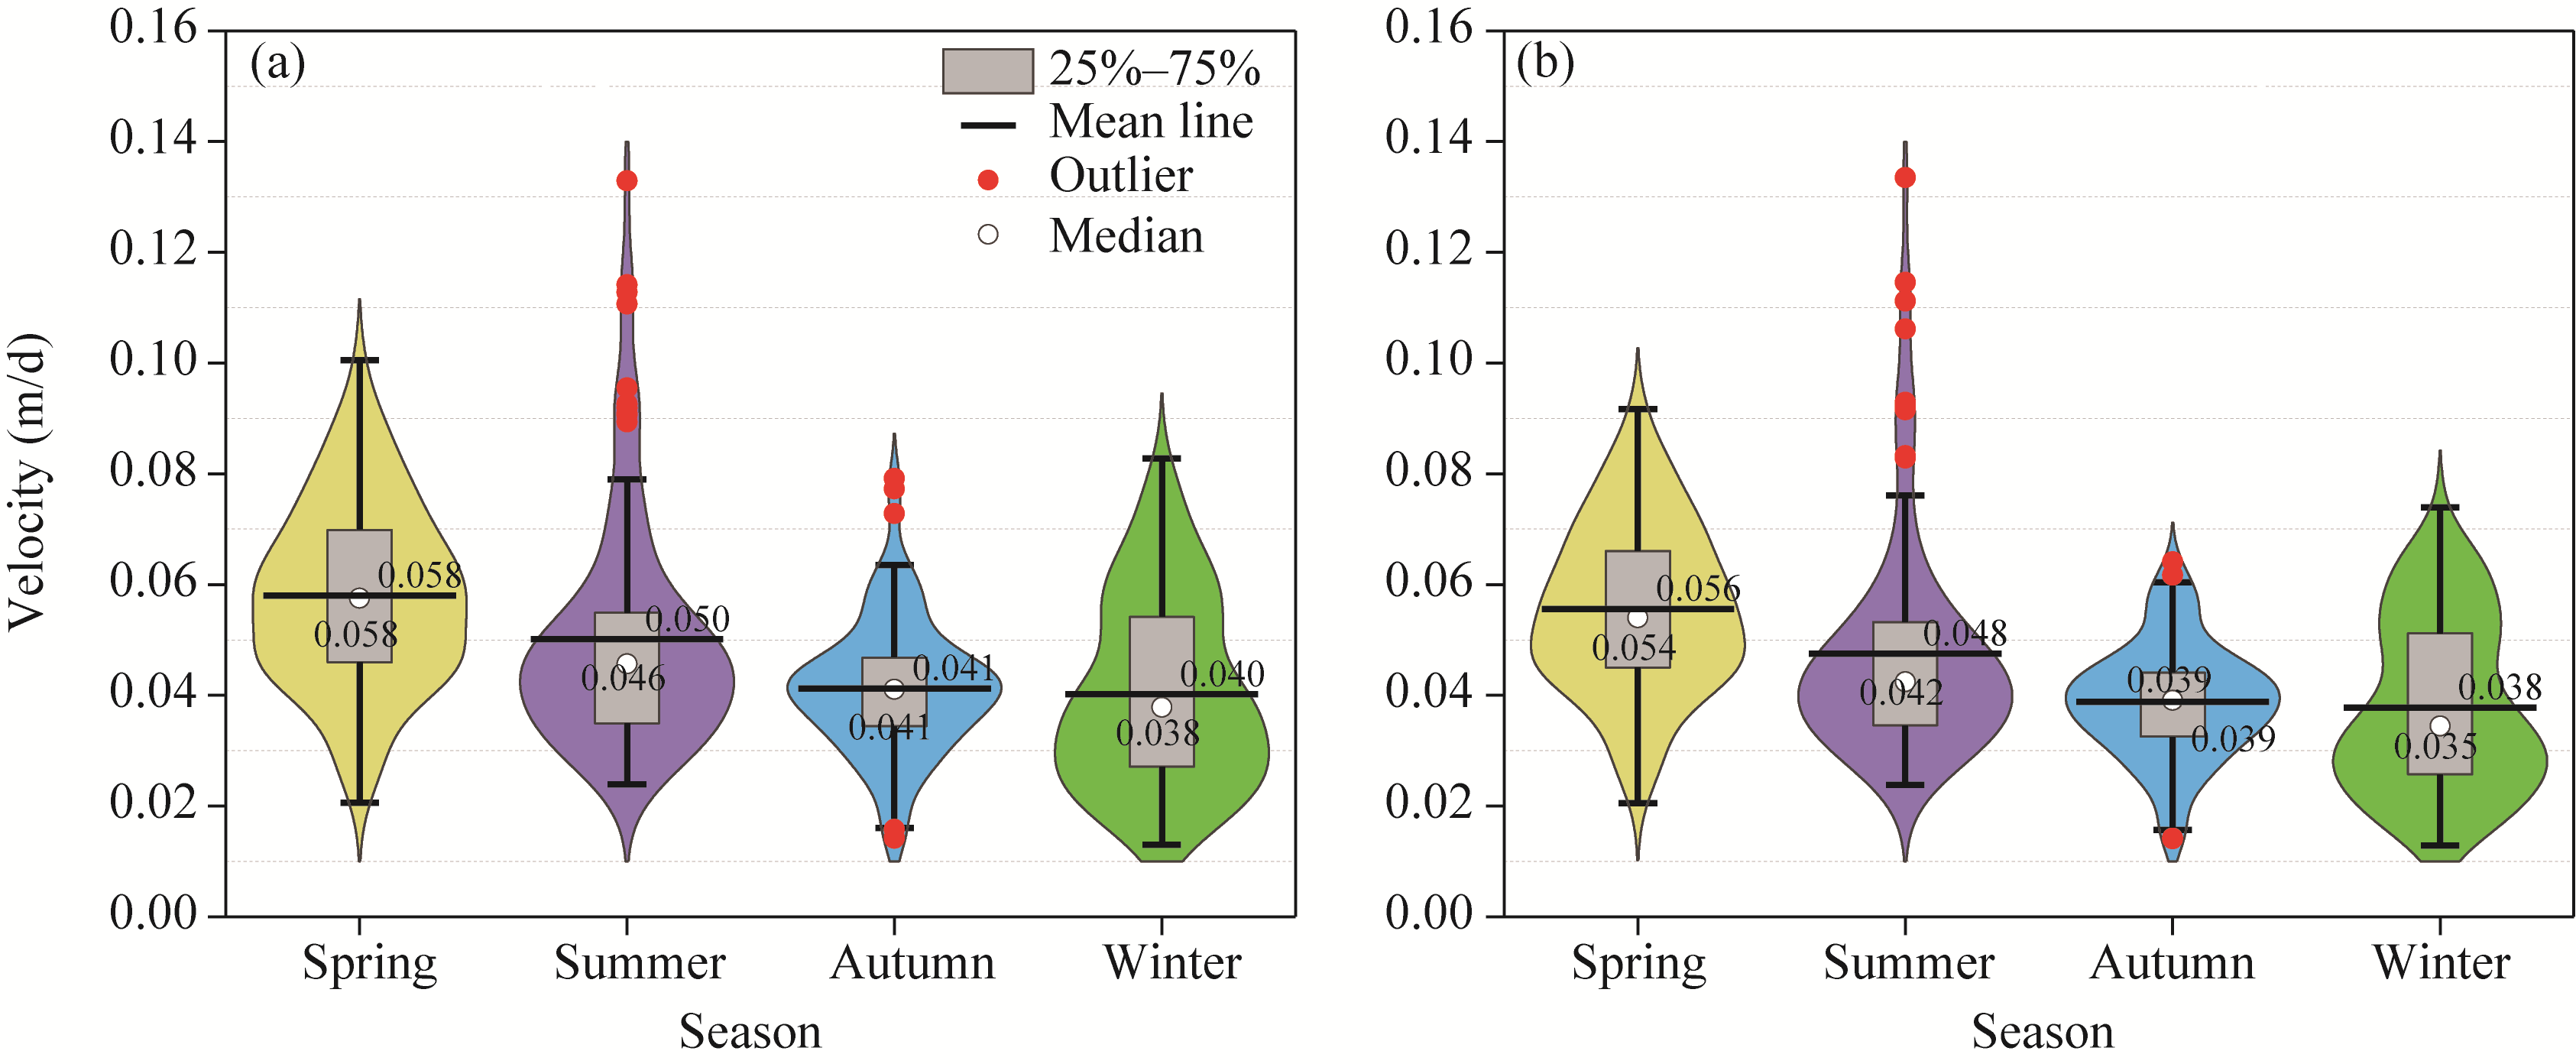
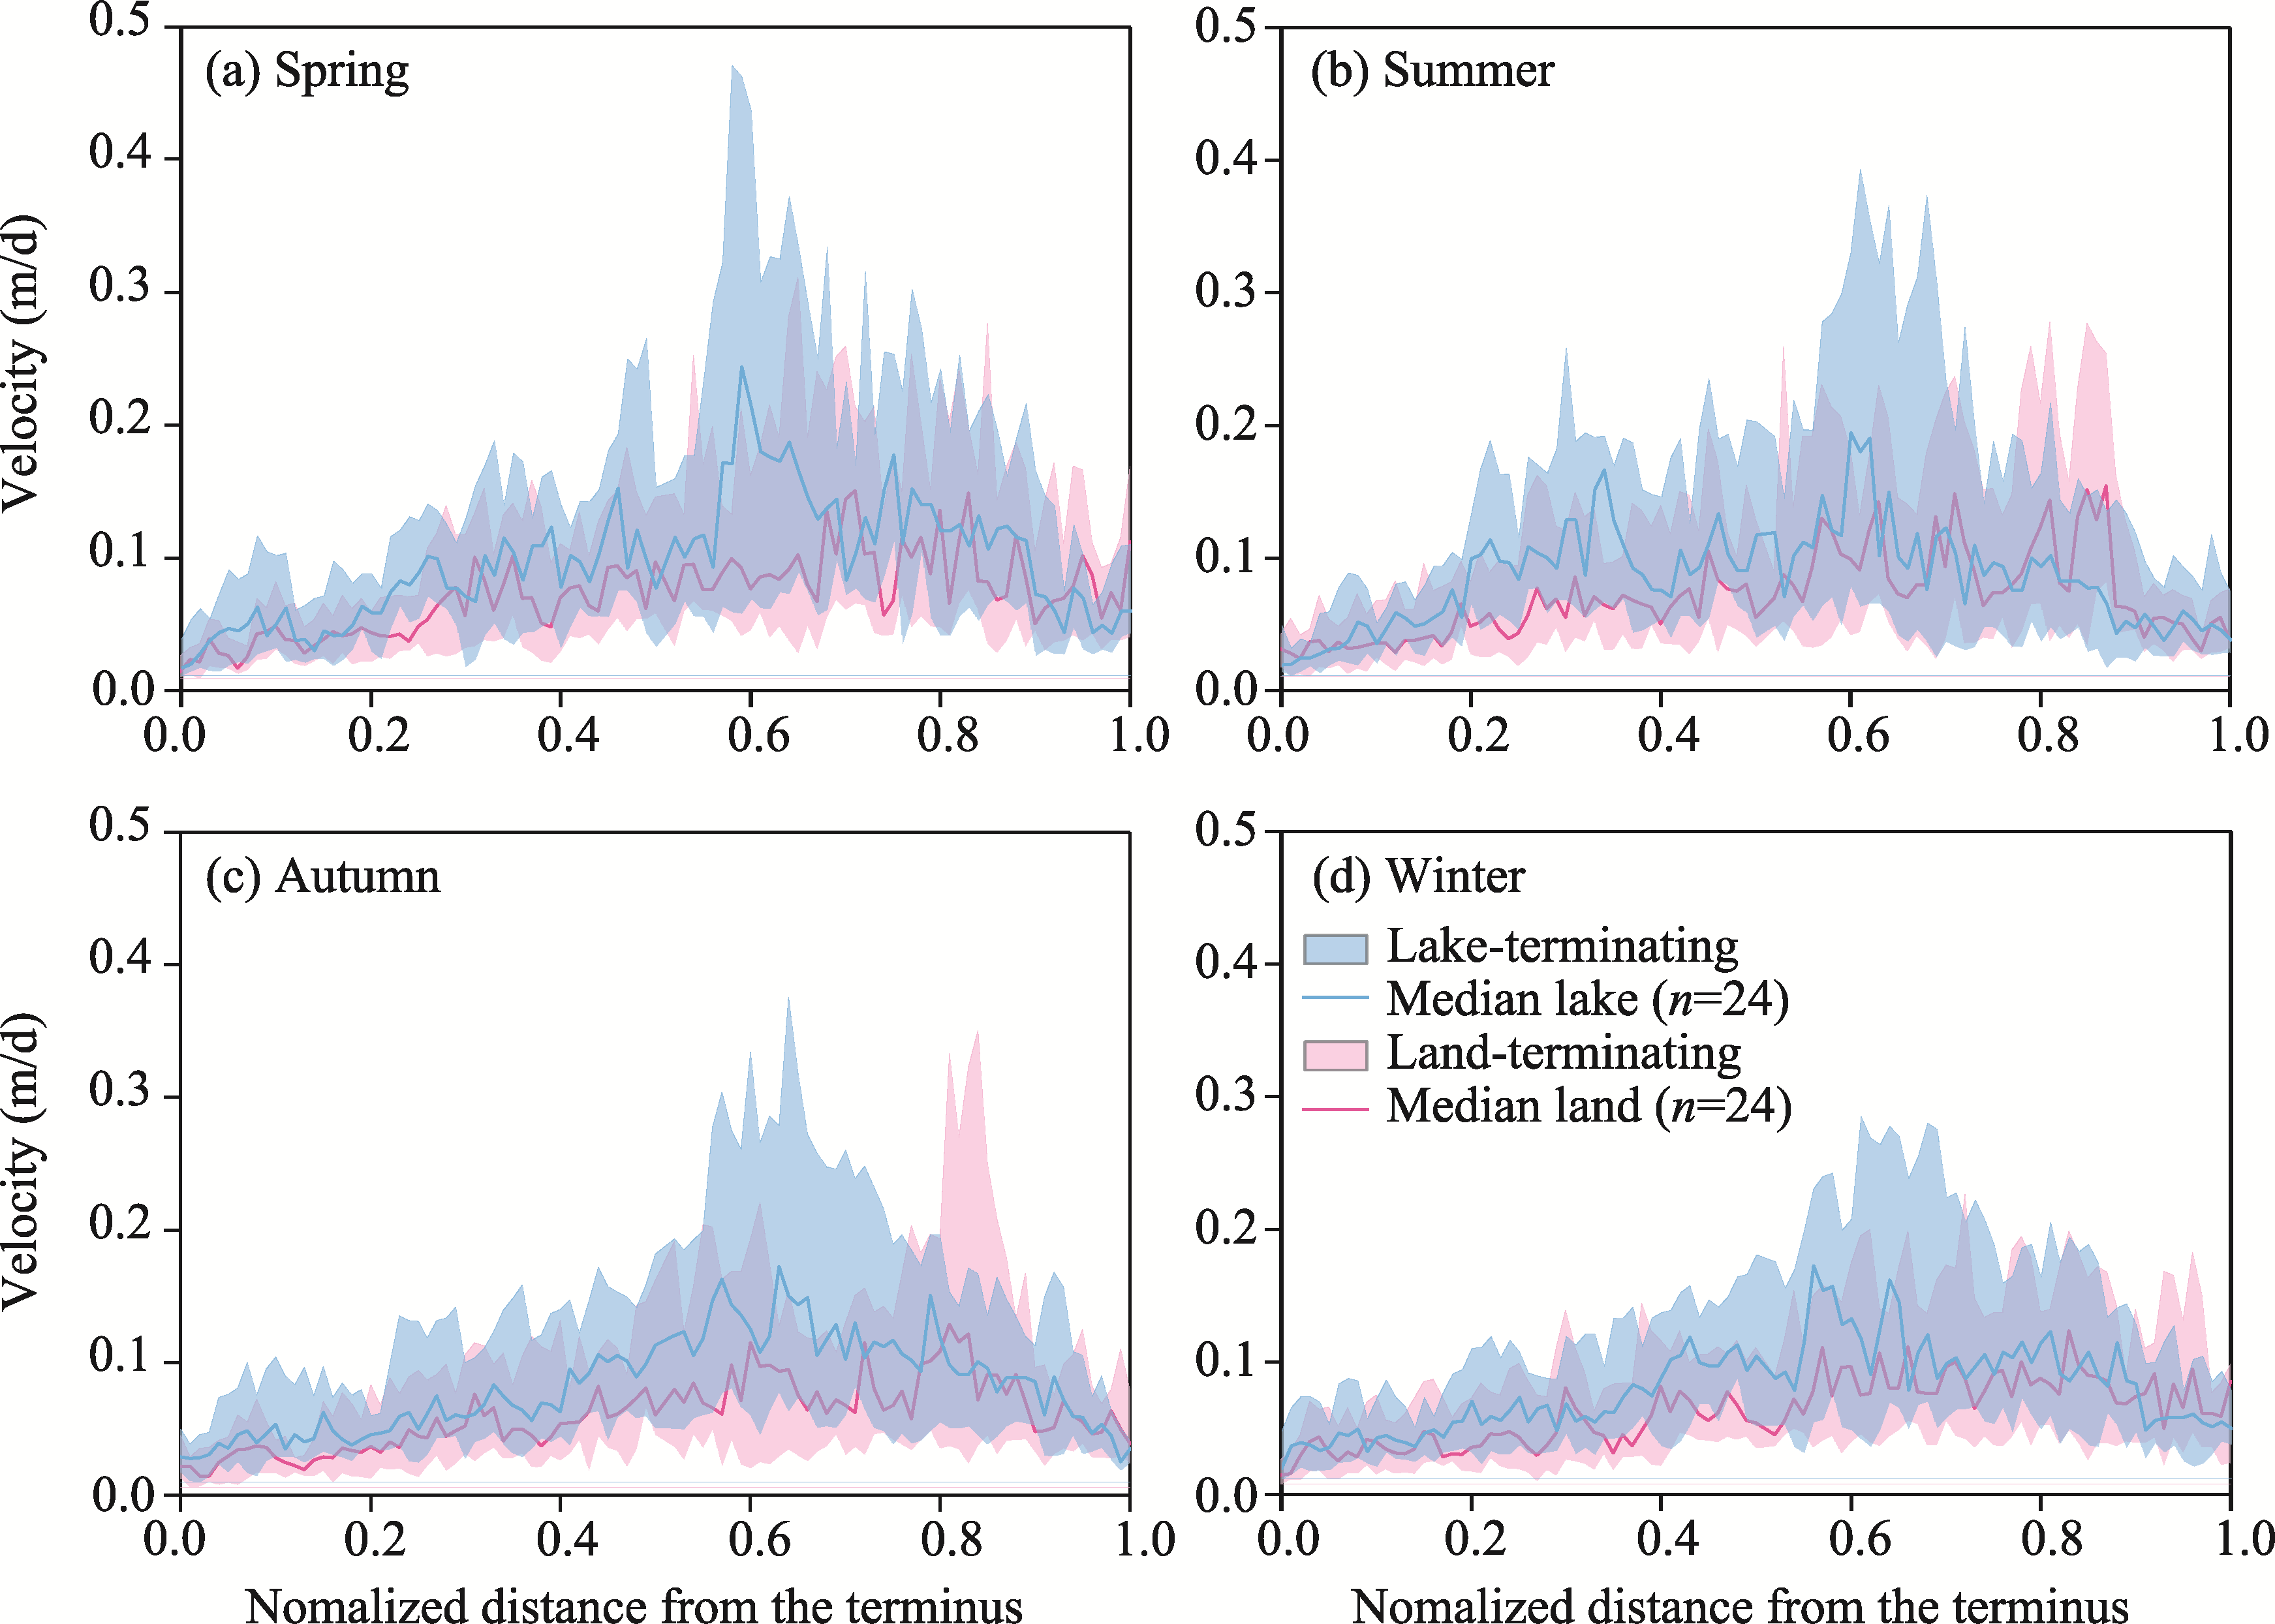
Abstract Velocity is an important component of glacier dynamics and directly reflects the response of glaciers to climate change. As a result, an accurate determination of seasonal variation in glacier velocity is very important in understanding the annual variation in glacier dynamics. However, few studies of glacier velocity in the High Mountain Asia (HMA) region were done. Along these lines, in this work, based on Sentinel-1 glacier velocity data, the distribution of glacier velocity in the HMA region was plotted and their seasonal variations during 2015-2020 were systematically analysed. The average glacier velocity in the HMA region was 0.053 m/d, and was positively correlated with the glacier area and slope. Glaciers in the Karakoram Mountains had the fastest average flow velocity (0.060 m/d), where the glaciers exhibited the largest average area and average slope. Moreover, glaciers in the Gangdisê Mountains had the slowest velocity (0.022 m/d) and the smallest average glacier area. The glacier flows were the fastest in spring (0.058 m/d), followed by summer (0.050 m/d), autumn (0.041 m/d), and winter (0.040 m/d). In addition, the glacier flows were the maximum in May, being 1.4 times of the annual average velocity. In some areas, such as the Qilian, Altun, Tibetan Interior, Eastern Kunlun, and Western Kunlun mountains, the peak glacier velocities appeared in June and July. The glacier velocity in the HMA region decreased in midsummer and reached the minimum in December when it was 75% of the annual average. These results highlight the role of meltwater in the seasonal variation in glacier flows in late spring and early summer. The seasonal velocity variation of lake-terminating glaciers was similar to that of land-terminating ones, but the former flowed faster. The velocity difference close to the mass balance line between the lake- and land-terminating glaciers was obviously greater in spring than in other seasons. In summer, the difference between the lake- and land-terminating glaciers at a normalized distance of 0.05-0.40 from the terminus was significantly greater than those of other seasons. The velocity difference between the lake- and land-terminating glaciers is closely related to the variable of ice thickness, and also to the frictional force of the terminal base reduced by proglacial lakes. Thus, it can be concluded that in addition to the variation of the glacier thickness and viscosity, the variation of glacier water input also plays a key role in the seasonal variation of glacier velocity.
|
|
Received: 17 January 2023
Published: 30 June 2023
|
|
Corresponding Authors:
* ZHANG Zhen (E-mail: zhangzhen@aust.edu.cn)
|
|
|
| [1] |
Armstrong W, Anderson R, Fahnestock M. 2017. Spatial patterns of summer speedup on south central Alaska Glaciers. Geophysical Research Letters, 44(18): 9379-9388.
doi: 10.1002/grl.v44.18
|
|
|
| [2] |
Brun F, Berthier E, Wagnon P, et al. 2017. A spatially resolved estimate of High Mountain Asia glacier mass balances, 2000-2016. Nature Geoscience, 10(9): 668-673.
|
|
|
| [3] |
Burgess E, Larsen C, Forster R. 2013. Summer melt regulates winter glacier flow speeds throughout Alaska. Geophysical Research Letters, 40(23): 6160-6164.
doi: 10.1002/grl.v40.23
|
|
|
| [4] |
Chen F, Zhang M, Guo H, et al. 2021. Annual 30 m dataset for glacial lakes in High Mountain Asia from 2008 to 2017. Earth System Science Data, 13(2): 741-766.
doi: 10.5194/essd-13-741-2021
|
|
|
| [5] |
Cuffey K, Paterson W. 2010. The Physics of Glaciers, Glaciology (4th ed.). Burlington: Elsevier, 285-398.
|
|
|
| [6] |
Das S, Sharma M. 2021. Glacier surface velocities in the Jankar Chhu Watershed, western Himalaya, India: Study using Landsat time series data (1992-2020). Remote Sensing Applications: Society and Environment, 24: 100615, doi: 10.1016/j.rsase.2021.100615.
doi: 10.1016/j.rsase.2021.100615
|
|
|
| [7] |
Dehecq A, Gourmelen N, Gardner A, et al. 2019. Twenty-first century glacier slowdown driven by mass loss in High Mountain Asia. Nature Geoscience, 12(1): 22-27.
doi: 10.1038/s41561-018-0271-9
|
|
|
| [8] |
Frappé T, Clarke G. 2007. Slow surge of Trapridge Glacier, Yukon Territory, Canada. Journal of Geophysical Research: Earth Surface, 112(F3): F03S32, doi: 10.1029/2006JF000607.
doi: 10.1029/2006JF000607
|
|
|
| [9] |
Friedl P, Seehaus T, Braun M. 2021. Global time series and temporal mosaics of glacier surface velocities derived from Sentinel-1 data. Earth System Science Data, 13(10): 4653-4675.
doi: 10.5194/essd-13-4653-2021
|
|
|
| [10] |
Fu Y, Liu Q, Liu G, et al. 2022. Seasonal ice dynamics in the lower ablation zone of Dagongba Glacier, southeastern Tibetan Plateau, from multitemporal UAV images. Journal of Glaciology, 68(270): 636-650.
doi: 10.1017/jog.2021.123
|
|
|
| [11] |
Guillet G, King O, Lv M, et al. 2022. A regionally resolved inventory of High Mountain Asia surge-type glaciers, derived from a multi-factor remote sensing approach. The Cryosphere, 16(2): 603-623.
doi: 10.5194/tc-16-603-2022
|
|
|
| [12] |
Herreid S, Truffer M. 2016. Automated detection of unstable glacier flow and a spectrum of speedup behaviour in the Alaska Range. Journal of Geophysical Research: Earth Surface, 121(1): 64-81.
doi: 10.1002/jgrf.v121.1
|
|
|
| [13] |
Horgan H, Anderson B, Alley R, et al. 2015. Glacier velocity variability due to rain-induced sliding and cavity formation. Earth and Planetary Science Letters, 432: 273-282.
doi: 10.1016/j.epsl.2015.10.016
|
|
|
| [14] |
Howat I, Box J, Ahn Y, et al. 2010. Seasonal variability in the dynamics of marine-terminating outlet glaciers in Greenland. Journal of Glaciology, 56(198): 601-613.
doi: 10.3189/002214310793146232
|
|
|
| [15] |
Immerzeel W, Lutz A, Andrade M, et al. 2019. Importance and vulnerability of the world's water towers. Nature, 577(7790): 364-369.
doi: 10.1038/s41586-019-1822-y
|
|
|
| [16] |
Kraaijenbrink P, Meijer S, Shea J, et al. 2016. Seasonal surface velocities of a Himalayan glacier derived by automated correlation of unmanned aerial vehicle imagery. Annals of Glaciology, 57(71): 103-113.
doi: 10.3189/2016AoG71A072
|
|
|
| [17] |
Kraaijenbrink P, Bierkens M, Lutz A, et al. 2017. Impact of a global temperature rise of 1.5 degrees Celsius on Asia's glaciers. Nature, 549(7671): 257-260.
doi: 10.1038/nature23878
|
|
|
| [18] |
Liu L, Jiang L, Sun Y, et al. 2019. Diurnal fluctuations of glacier surface velocity observed with terrestrial radar interferometry at Laohugou No. 12 Glacier, western Qilian Mountains, China. Journal of Glaciology, 65(250): 239-248.
doi: 10.1017/jog.2019.1
|
|
|
| [19] |
Lüttig C, Neckel N, Humbert A. 2017. A combined approach for filtering ice surface velocity fields derived from remote sensing methods. Remote Sensing, 9(10): 1062, doi: 10.3390/rs9101062.
doi: 10.3390/rs9101062
|
|
|
| [20] |
Maussion F, Butenko A, Champollion N, et al. 2019. The open global glacier model (OGGM) v1.1. Geoscientific Model Development, 12(3): 909-931.
doi: 10.5194/gmd-12-909-2019
|
|
|
| [21] |
Nie Y, Pritchard H, Liu Q, et al. 2021. Glacial change and hydrological implications in the Himalaya and Karakoram. Nature Reviews Earth & Environment, 2(2): 91-106.
|
|
|
| [22] |
Paul F, Bolch T, Kääb A, et al. 2015. The glaciers climate change initiative: Methods for creating glacier area, elevation change and velocity products. Remote Sensing of Environment, 162: 408-426.
doi: 10.1016/j.rse.2013.07.043
|
|
|
| [23] |
Pritchard H. 2019. Asia's shrinking glaciers protect large populations from drought stress. Nature, 569(7758): 649-654.
doi: 10.1038/s41586-019-1240-1
|
|
|
| [24] |
Pronk J, Bolch T, King O, et al. 2021. Contrasting surface velocities between lake- and land-terminating glaciers in the Himalayan Region. The Cryosphere, 15(12): 5577-5599.
doi: 10.5194/tc-15-5577-2021
|
|
|
| [25] |
RGI (Randolph Glacier Inventory). 2017. Randolph Glacier Inventory-Dataset of Global Glacier Outlines, Version 6. Boulder: National Snow and Ice Data Center, 3-16.
|
|
|
| [26] |
Sam L, Bhardwaj A, Kumar R, et al. 2018. Heterogeneity in topographic control on velocities of Western Himalayan glaciers. Scientific Reports, 8(1): 12843, doi: 10.1038/s41598-018-31310-y.
doi: 10.1038/s41598-018-31310-y
pmid: 30150785
|
|
|
| [27] |
Samsonov S, Tiampo K, Cassotto R. 2021. SAR-derived flow velocity and its link to glacier surface elevation change and mass balance. Remote Sensing of Environment, 258: 112343, doi: 10.1016/j.rse.2021.112343.
doi: 10.1016/j.rse.2021.112343
|
|
|
| [28] |
Sanchez-Gamez P, Navarro F. 2017. Glacier surface velocity retrieval using D-InSAR and offset tracking techniques applied to ascending and descending passes of Sentinel-1 data for southern Ellesmere Ice Caps, Canadian Arctic. Remote Sensing, 9(5): 442, doi: 10.3390/rs9050442.
doi: 10.3390/rs9050442
|
|
|
| [29] |
Schaffer N, Copland L, Zdanowicz C. 2017. Ice velocity changes on Penny Ice Cap, Baffin Island, since the 1950s. Journal of Glaciology, 63(240): 716-730.
doi: 10.1017/jog.2017.40
|
|
|
| [30] |
Schellenberger T, Dunse T, Kääb A, et al. 2015. Surface speed and frontal ablation of Kronebreen and Kongsbreen, NW Svalbard, from SAR offset tracking. The Cryosphere, 9(6): 2339-2355.
doi: 10.5194/tc-9-2339-2015
|
|
|
| [31] |
Shen C, Jia L, Ren S. 2022. Inter- and intra-annual glacier elevation change in High Mountain Asia region based on ICESat-1&2 Data using elevation-aspect bin analysis method. Remote Sensing, 14(7): 1630, doi: 10.3390/rs14071630.
doi: 10.3390/rs14071630
|
|
|
| [32] |
Singh D, Thakur P, Naithani B. 2021. Spatio-temporal analysis of glacier surface velocity in Dhauliganga basin using geo-spatial techniques. Environmental Earth Sciences, 80(1): 11, doi: 10.1007/s12665-020-09283-x.
doi: 10.1007/s12665-020-09283-x
|
|
|
| [33] |
Sun Y, Jiang L, Liu L, et al. 2017. Spatial-temporal characteristics of glacier velocity in the central Karakoram revealed with 1999-2003 Landsat-7 ETM+ pan images. Remote Sensing, 9(10): 1064, doi: 10.3390/rs9101064.
doi: 10.3390/rs9101064
|
|
|
| [34] |
Usman M, Furuya M. 2018. Interannual modulation of seasonal glacial velocity variations in the Eastern Karakoram detected by ALOS-1/2 data. Journal of Glaciology, 64(245): 465-476.
doi: 10.1017/jog.2018.39
|
|
|
| [35] |
Wegnüller U, Werner C, Strozzi T, et al. 2016. Sentinel-1 support in the GAMMA software. Procedia Computer Science, 100: 1305-1312.
doi: 10.1016/j.procs.2016.09.246
|
|
|
| [36] |
Wendleder A, Friedl P, Mayer C. 2018. Impacts of climate and supraglacial lakes on the surface velocity of Baltoro glacier from 1992 to 2017. Remote Sensing, 10(11): 1681, doi: 10.3390/rs10111681.
doi: 10.3390/rs10111681
|
|
|
| [37] |
Wu K, Liu S, Zhu Y, et al. 2020. Dynamics of glacier surface velocity and ice thickness for maritime glaciers in the southeastern Tibetan Plateau. Journal of Hydrology, 590: 125527, doi: 10.1016/j.jhydrol.2020.125527.
doi: 10.1016/j.jhydrol.2020.125527
|
|
|
| [38] |
Yan S, Li Y, Li Z, et al. 2018. An insight into the surface velocity of Inylchek Glacier and its effect on Lake Merzbacher during 2006-2016 with Landsat time-series imagery. Environmental Earth Sciences, 77: 773, doi: 10.1007/s12665-018-7964-7.
doi: 10.1007/s12665-018-7964-7
|
|
|
| [39] |
Yan X, Ma J, Ma X, et al. 2021. Hydrothermal combination and geometry control the spatial and temporal rhythm of glacier flow. Science of the Total Environment, 760: 144315, doi: 10.1016/j.scitotenv.2020.144315.
doi: 10.1016/j.scitotenv.2020.144315
|
|
|
| [40] |
Yang R, Hock R, Kang S, et al. 2022. Glacier surface speed variations on the Kenai Peninsula, Alaska, 2014-2019. Journal of Geophysical Research: Earth Surface, 127(3): 1-22.
|
|
|
| [41] |
Yang W, Zhao C, Westoby M, et al. 2020. Seasonal dynamics of a temperate Tibetan glacier revealed by high-resolution UAV photogrammetry and in situ measurements. Remote Sensing, 12(15): 2389, doi: 10.3390/rs12152389.
doi: 10.3390/rs12152389
|
|
|
| [42] |
Yao T, Thompson L, Yang W, et al. 2012. Different glacier status with atmospheric circulations in Tibetan Plateau and surroundings. Nature Climate Change, 2(9): 663-667.
doi: 10.1038/nclimate1580
|
|
|
| [43] |
Zhang J, Jia L, Menenti M, et al. 2020. Interannual and seasonal variability of glacier surface velocity in the Parlung Zangbo Basin, Tibetan Plateau. Remote Sensing, 13(1): 80, doi: 10.3390/rs13010080.
doi: 10.3390/rs13010080
|
|
|
| [44] |
Zhang Z, Gu Z, Hu K, et al. 2022a. Spatial variability between glacier mass balance and environmental factors in the High Mountain Asia. Journal of Arid Land, 14(4): 441-454.
doi: 10.1007/s40333-017-0014-z
|
|
|
| [45] |
Zhang Z, Tao P, Liu S, et al. 2022b. What controls the surging of Karayaylak glacier in eastern Pamir?. New insights from remote sensing data. Journal of Hydrology, 607: 127577, doi: 10.1016/j.jhydrol.2022.127577.
doi: 10.1016/j.jhydrol.2022.127577
|
|
|
|
Viewed |
|
|
|
Full text
|
|
|
|
|
Abstract
|
|
|
|
|
Cited |
|
|
|
|
| |
Shared |
|
|
|
|
| |
Discussed |
|
|
|
|