|
|
|
| Mathematical and statistical modeling of morphometric and planar parameters of barchans in Pashoeyeh Erg in the west of Lut Desert, Iran |
Hossein GHAZANFARPOUR1, Mohsen POURKHOSRAVANI1,*( ), Sayed H MOUSAVI2, Ali MEHRABI3 ), Sayed H MOUSAVI2, Ali MEHRABI3 |
1 Department of Geography and Urban Planning, Shahid Bahonar University of Kerman, Kerman 7618965984, Iran
2 Department of Geography and Ecotourism, Faculty of Natural Resources and Geosciences, University of Kashan, Kashan 8731753153, Iran
3 Department of Geography and Urban Planning, Shahid Bahonar University of Kerman, Kerman 7618965984, Iran |
|
|
|
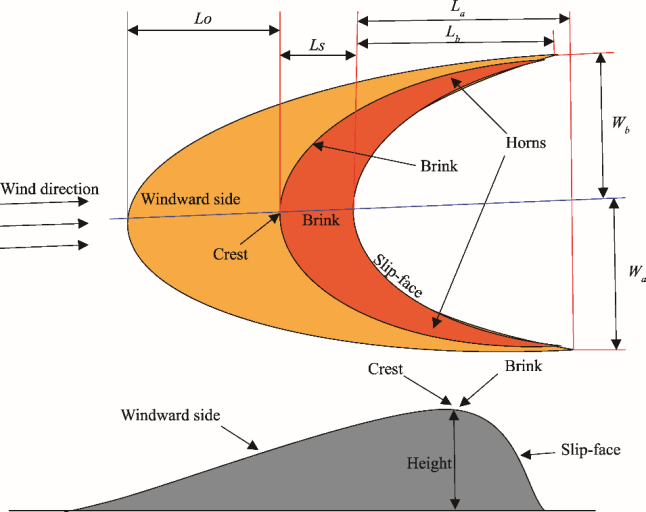
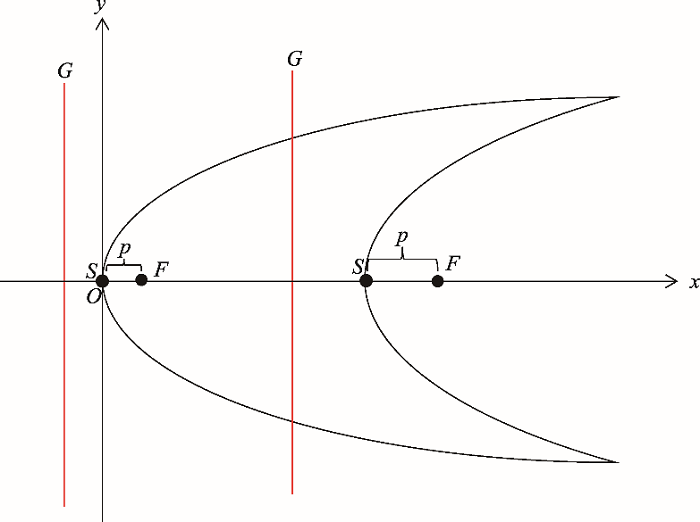
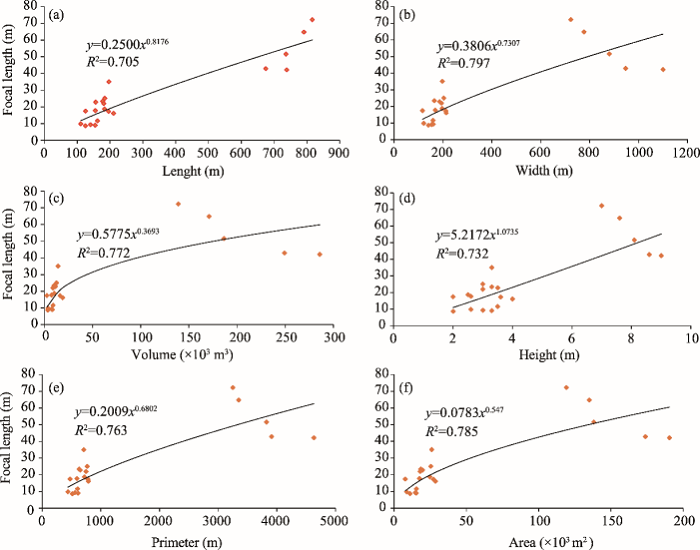
Abstract Barchan dunes are among the most common accumulative phenomena made by wind erosion, which are usually formed in regions where the prevailing wind direction is almost constant throughout the year and there is not enough sand to completely cover the land surface. Barchans are among the most common windy landscapes in Pashoueyeh Erg in the west of Lut Desert, Iran. This study aims to elaborate on morphological properties of barchans in this region using mathematical and statistical models. The results of these methods are very important in investigating barchan shapes and identifying their behavior. Barchan shapes were mathematically modeled by simulating them in the coordinate system through nonlinear parabolic equations, so that two separate equations were calculated for barchan windward and slip-face parabolas. The type and intensity of relationships between barchan morphology and mathematical parameters were determined by the statistical modeling. The results indicated that the existing relationships followed the power correlation with the maximum coefficient of determination and minimum error of estimate. Combining the above two methods is a powerful basis for stimulating barchans in virtual and laboratory environments. The most important result of this study is to convert the mathematical and statistical models of barchan morphology to each other. Focal length is one of the most important parameters of barchan parabolas, suggesting different states of barchans in comparison with each other. As the barchan's focal length decreases, its opening becomes narrower, and the divergence of the barchan's horns reduces. Barchans with longer focal length have greater width, dimensions, and volume. In general, identifying and estimating the morphometric and planar parameters of barchans is effective in how they move, how much they move, and how they behave in the environment. These cases play an important role in the management of desert areas.
|
|
Received: 21 November 2020
Published: 10 August 2021
|
|
Corresponding Authors:
|
|
|
| [1] |
Alvarez C A, Franklin E M. 2019. Horns of subaqueous barchan dunes: A study at the grain scale. Physical Review E, 100(4): 042904, doi: 10.1103/PhysRevE.100.042904.
|
|
|
| [2] |
Anton D, Vincent P. 1986. Parabolic dunes of the Jafurah Desert, Eastern Province, Saudi Arabia. Journal of Arid Environments, 11(3):187-198.
|
|
|
| [3] |
Anthonsen K L, Clemmensen L B, Jensen J H. 1996. Evolution of a dune from crescentic to parabolic form in response to short-term climatic changes: Rabjerg Mile, Skagen Odde, Denmark. Geomorphology, 17(1-3):63-77.
|
|
|
| [4] |
Bagnold R A. 1941. The Physics of Blown Sand and Desert Dunes. London: Methuen Press,232.
|
|
|
| [5] |
Cooke R, Warren A, Goudie A. 1993. Desert Geomorphology. London: UCL Press,325.
|
|
|
| [6] |
Daniell J, Hughes M. 2007. The morphology of barchan-shaped sand banks from western Torres Strait, northern Australia. Sedimentary Geology, 202(4):638-652.
|
|
|
| [7] |
Durán O, Schwämmle V, Lind P G, et al. 2011. Size distribution and structure of Barchan dune fields. Nonlinear Processes in Geophysics, 18(4):455-467.
|
|
|
| [8] |
Engel M, Boesl F, Brückner H. 2018. Migration of barchan dunes in qatar-controls of the shamal, teleconnections, sea-level changes and human impact. Geosciences, 8(7): 240, doi: 10.3390/geosciences8070240.
|
|
|
| [9] |
Finkel H J. 1959. The barchans of Southern Peru. Journal of Geology, 67(6):614-647.
|
|
|
| [10] |
Hamdan M A, Refaat A A,Abdel Wahed M. 2016. Morphologic characteristics and migration rate assessment of barchan dunes in the Southeastern Western Desert of Egypt. Geomorphology, 257:57-74.
|
|
|
| [11] |
Hersen P. 2004. On the crescentic shape of barchan dunes. The European Physical Journal, 37(4):507-514.
|
|
|
| [12] |
Hersen P. 2005. Flow effects on the morphology and dynamics of Aeolian and subaqueous barchan dunes. Journal of Geophysical Research, 110(F4):2-10.
|
|
|
| [13] |
Hesp P A, Hastings K. 1998. Width, height and slope relationships and aerodynamic maintenance of barchans. Geomorphology, 22(2):193-204.
|
|
|
| [14] |
Hesse R. 2008. Do swarms of migrating barchan dunes record paleenvironmental changes? A case study spanning the middle to late Holocene in the Pampa de Jaguay, southern Peru. Geomorphology, 104(3-4):185-190.
|
|
|
| [15] |
Howard A D, Morton J B, Mohamed G. 1978. Sand transport model of barchan dune equilibrium. Sedimentology, 25(3):307-338.
|
|
|
| [16] |
Kocurek G, Townsley M, Yeh E, et al. 1992. Dune and dune-field development on Padre Island, Texas, with implications for interdune deposition and water-table-controlled accumulation. Journal of Sedimentary Research, 62(4):622-635.
|
|
|
| [17] |
Landsberg S Y. 1956. The orientation of dunes in Britain and Denmark in relation to wind. Geographical Journal, 122(2):176-189.
|
|
|
| [18] |
Leithold L. 1992. Calculus, Integral and Analytic Geometry, Volume II (Part I)(3rd ed.). In: Behzad M, Razaghi M, Kazemi S, et al. Tehran: Tehran University Press,375.
|
|
|
| [19] |
Lettau K, Lettau H. 1969. Bulk transport of sand by the barchans of the Pampa de La Joya in Southern Peru. Geomorphology, 13(2):182-195.
|
|
|
| [20] |
Mousavi S H, Dorgouie M, Vali A A, et al. 2010. Statistical modeling of morphological parameters of barchan dunes (Case study: Chah Jam Erg in South of Haj Ali GHoli Playa, in Central Part of Semnan Province, IRAN). Journal of Geography and Geology, 2(1):98-113.
|
|
|
| [21] |
Sauermann G, Rognon P, Poliakov A, et al. 2000. The shape of the barchan dunes of Southern Morocco. Geomorphology, 36(1-2):47-62.
|
|
|
| [22] |
Tsoar H, Parteli E J R. 2016. Bidirectional winds, barchan dune asymmetry and formation of seif dunes from barchans: a discussion. Environmental Earth Sciences, 75(18): 1237, doi: 10.1007/s12665-016-6040-4.
|
|
|
| [23] |
Wippermann F K, Gross G. 1986. The wind-induced shaping and migration of an isolated dune: A numerical experiment. Boundary-Layer Meteorology, 36(4):319-334.
|
|
|
| [24] |
Wang Z T, Tao S C, Xie Y W, et al. 2007. Barchans of Minqin: Morphometry. Geomorphology, 89(3-4):405-411.
|
|
|
| [25] |
Yang J H. Dong Z B. Liu Z Y, et al. 2019. Migration of barchan dunes in the western Quruq Desert, northwestern China. Earth Surface Processes and Landforms, 44(10):2016-2029.
|
|
|
| [26] |
Zhang Z C, Dong Z B, Hu G Y, et al. 2018. Migration and morphology of asymmetric barchans in the Central Hexi Corridor of northwest China. Geosciences, 8(6): 204, doi: 10.3390/geosciences8060204.
|
|
|
|
Viewed |
|
|
|
Full text
|
|
|
|
|
Abstract
|
|
|
|
|
Cited |
|
|
|
|
| |
Shared |
|
|
|
|
| |
Discussed |
|
|
|
|