| Research article |
|


|
|
|
| Spatiotemporal variations and driving factors of habitat quality in the loess hilly area of the Yellow River Basin: A case study of Lanzhou City, China |
DONG Jianhong1, ZHANG Zhibin2, LIU Benteng1,*( ), ZHANG Xinhong1,*(), ZHANG Wenbin2, CHEN Long2 ), ZHANG Xinhong1,*(), ZHANG Wenbin2, CHEN Long2 |
1School of Design and Art, Lanzhou University of Technology, Lanzhou 730050, China
2School of Geography and Environment Science, Northwest Normal University, Lanzhou 730070, China |
|
|
|
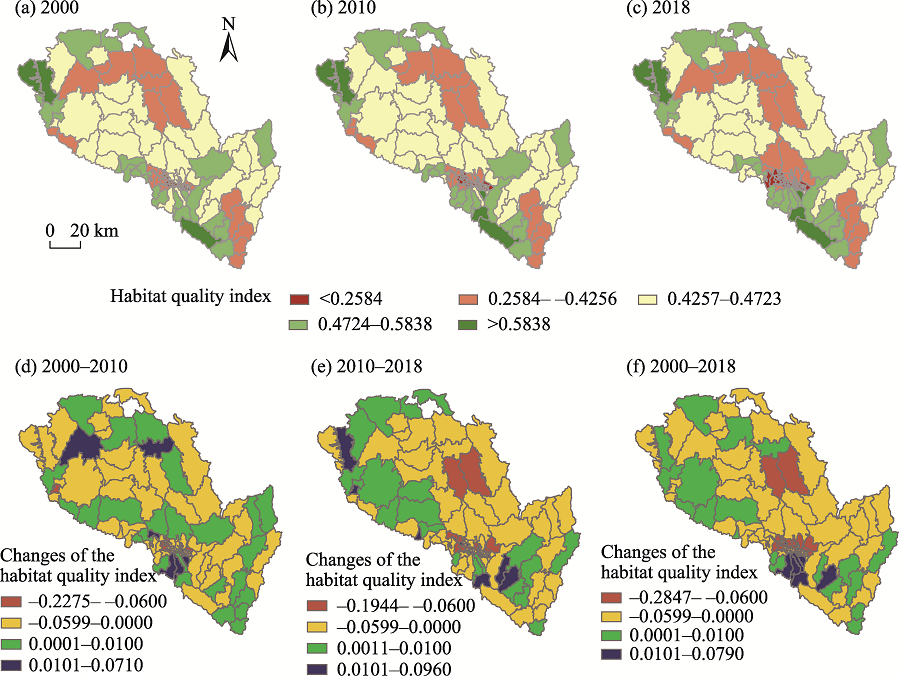
Abstract Rapid industrialization and urbanization have led to the most serious habitat degradation in China, especially in the loess hilly area of the Yellow River Basin, where the ecological environment is relatively fragile. The contradiction between economic development and ecological environment protection has aroused widespread concern. In this study, we used the habitat quality of Integrated Valuation of Ecosystem Services and Tradeoffs (InVEST-HQ) model at different scales to evaluate the dynamic evolution characteristics of habitat quality in Lanzhou City, Gansu Province of China. The spatiotemporal variations of habitat quality were analyzed by spatial autocorrelation. A Geographical Detector (Geodetector) model was used to explore the driving factors that influencing the spatial differentiation of habitat quality, including natural factors, socio-economic factors, and ecological protection factors. The results showed that the habitat quality index of Lanzhou City decreased from 0.4638 to 0.4548 during 2000-2018. The areas with reduced the habitat quality index were mainly located in the Yellow River Basin and Qinwangchuan Basin, where are the main urban areas and the new economic development areas, respectively. The spatial distribution of habitat quality presented a trend of high in the surrounding areas and low in the middle, and showed a significant positive spatial autocorrelation. With the increase of study scale, the spatial distribution of habitat quality changed from concentrated to dispersed. The spatial differentiation of habitat quality in the study area was the result of multiple factors. Among them, topographic relief and slope were the key factors. The synergistic enhancement among these driving factors intensified the spatial differentiation of habitat quality. The findings of this study can provide a scientific basis for land resources utilization and ecosystem restoration in the arid and semi-arid land.
|
|
Received: 30 March 2022
Published: 30 June 2022
|
|
Corresponding Authors:
* LIU Benteng (E-mail: liubt@lut.edu.cn);ZHANG Xinhong (E-mail: zhangxh1981@lut.edu.cn)
|
|
|
| [1] |
Aguilar R, Cristóbal-Pérez E J, Balvino-Olvera F J, et al. 2019. Habitat fragmentation reduces plant progeny quality: a global synthesis. Ecology Letters, 22(7): 1163-1173.
doi: 10.1111/ele.13272
pmid: 31087604
|
|
|
| [2] |
Shirmohammadi B, Malekian A, Salajegheh A, et al. 2020a. Impacts of future climate and land use change on water yield in a semiarid basin in Iran. Land Degradation & Development, 31(10): 1252-1264.
doi: 10.1002/ldr.3554
|
|
|
| [3] |
Shirmohammadi B, Malekian A, Salajegheh A, et al. 2020b. Scenario analysis for integrated water resources management under future land use change in the Urmia Lake region, Iran. Land Use Policy, 90: 104299, doi: 10.1016/j.landusepol.2019.104299.
doi: 10.1016/j.landusepol.2019.104299
|
|
|
| [4] |
Balkanlou K R, Müller B, Cord A F, et al. 2020. Spatiotemporal dynamics of ecosystem services provision in a degraded ecosystem: A systematic assessment in the Lake Urmia basin, Iran. Science of the Total Environment, 716: 137100, doi: 10.1016/j.scitotenv.2020.137100.
doi: 10.1016/j.scitotenv.2020.137100
|
|
|
| [5] |
Baral H, Keenan R J, Sharma S K, et al. 2014. Spatial assessment and mapping of biodiversity and conservation priorities in a heavily modified and fragmented production landscape in north-central Victoria, Australia. Ecological Indicators, 36: 552-562.
doi: 10.1016/j.ecolind.2013.09.022
|
|
|
| [6] |
Cardoso de Mendonça M J, Sachsida A, Loureiro P R A. 2003. A study on the valuing of biodiversity: the case of three endangered species in Brazil. Ecological Economics, 46(1): 9-18.
doi: 10.1016/S0921-8009(03)00080-6
|
|
|
| [7] |
Coates P S, Casazza M L, Ricca M A, et al. 2016. Integrating spatially explicit indices of abundance and habitat quality: an applied example for greater sage-grouse management. Journal of Applied Ecology, 53: 83-95.
pmid: 26877545
|
|
|
| [8] |
Costa G C, Nogueira C, Machado R B, et al. 2009. Sampling bias and the use of ecological niche modeling in conservation planning: a field evaluation in a biodiversity hotspot. Biodiversity and Conservation, 19: 883-899.
doi: 10.1007/s10531-009-9746-8
|
|
|
| [9] |
Hao R F, Yu D Y, Liu Y P, et al. 2017. Impacts of changes in climate and landscape pattern on ecosystem services. Science of the Total Environment, 579: 718-728.
doi: 10.1016/j.scitotenv.2016.11.036
|
|
|
| [10] |
He B, Chang J X, Guo A J, et al. 2022. Assessment of river basin habitat quality and its relationship with disturbance factors: A case study of the Tarim River Basin in Northwest China. Journal of Arid Land, 14(2): 167-185.
doi: 10.1007/s40333-022-0058-0
|
|
|
| [11] |
He J H, Huang J L, Li C. 2017. The evaluation for the impact of land use change on habitat quality: A joint contribution of cellular automata scenario simulation and habitat quality assessment model. Ecological Modelling, 366: 58-67.
doi: 10.1016/j.ecolmodel.2017.10.001
|
|
|
| [12] |
Hu X Y, Pan J H. 2016. The Stability of landscape pattern in Lanzhou, Gansu, China. Journal of Desert Research, 36(2): 556-563. (in Chinese)
|
|
|
| [13] |
Kefalas G, Kalogirou S, Poirazidis K, et al. 2019. Landscape transition in Mediterranean islands: The case of Ionian islands, Greece 1985-2015. Landscape and Urban Planning, 191: 103641, doi: 10.1016/j.landurbplan.2019.103641.
doi: 10.1016/j.landurbplan.2019.103641
|
|
|
| [14] |
Krauss J, Bommarco R, Guardiola M, et al. 2010. Habitat fragmentation causes immediate and time-delayed biodiversity loss at different trophic levels. Ecology Letters, 13: 597-605.
doi: 10.1111/j.1461-0248.2010.01457.x
|
|
|
| [15] |
Lanzhou Municipal Bureau of Statistics. 2019. Lanzhou Statistical Yearbook. [2021-12-29]. http://tjj.lanzhou.gov.cn/art/2019/12/11/art_4866_834601.html. (in Chinese)
|
|
|
| [16] |
Lanzhou Municipal Bureau of Statistics. 2021. Lanzhou Statistical Yearbook. [2021-12-29]. http://tjj.lanzhou.gov.cn/art/2021/12/29/art_4866_1083444.html. (in Chinese)
|
|
|
| [17] |
Li F X, Wang L Y, Chen Z J, et al. 2018. Extending the SLEUTH model to integrate habitat quality into urban growth simulation. Journal of Environmental Management, 217: 486-498.
doi: 10.1016/j.jenvman.2018.03.109
|
|
|
| [18] |
Li H L, Peng J, Liu Y X, et al. 2017. Urbanization impact on landscape patterns in Beijing City, China: A spatial heterogeneity perspective. Ecological Indicators, 82: 50-60.
doi: 10.1016/j.ecolind.2017.06.032
|
|
|
| [19] |
Liu C F, Wang C, Liu L C. 2018. Spatio-temporal variation on habitat quality and its mechanism within the transitional area of the Three Natural Zones: A case study in Yuzhong county. Geographical Research, 37(2): 419-432. (in Chinese)
|
|
|
| [20] |
Liu M Y, Jiang F, Liu Yong, 2016. Land use pattern changes over the last two decades in Qinwangchuan area, Lanzhou, China. Journal of Arid Land Resources and Environment, 30(11): 111-116. (in Chinese)
|
|
|
| [21] |
Lin D, Ma H L, Ren Z C, et al. 2015. Dynamic analysis of ecosystem service value based on land use/cover change in Lanzhou City. Ecological Science, 35(2): 134-142. (in Chinese)
|
|
|
| [22] |
Maes J, Paracchini M L, Zulian G, et al. 2012. Synergies and trade-offs between ecosystem service supply, biodiversity, and habitat conservation status in Europe. Biological Conservation, 155: 1-12.
doi: 10.1016/j.biocon.2012.06.016
|
|
|
| [23] |
McDonald R I, Forman R T T, Kareiva P, et al. 2009. Urban effects, distance, and protected areas in an urbanizing world. Landscape and Urban Planning, 93: 63-75.
doi: 10.1016/j.landurbplan.2009.06.002
|
|
|
| [24] |
McDonald R I, Güneralp B, Huang C W, et al. 2018. Conservation priorities to protect vertebrate endemics from global urban expansion. Biological Conservation, 224: 290-299.
doi: 10.1016/j.biocon.2018.06.010
|
|
|
| [25] |
Miller J R, Groom M, Hess G R, et al. 2009. Biodiversity conservation in local planning. Conservation Biology, 23(1): 53-63.
doi: 10.1111/j.1523-1739.2008.01110.x
pmid: 19016822
|
|
|
| [26] |
Moreira M, Fonseca C, Vergílio M, et al. 2018. Spatial assessment of habitat conservation status in a Macaronesian island based on the InVEST model: a case study of Pico Island (Azores, Portugal). Land Use Policy, 78: 637-649.
doi: 10.1016/j.landusepol.2018.07.015
|
|
|
| [27] |
Newbold T, Hudson L N, Hill S L, et al. 2015. Global effects of land use on local terrestrial biodiversity. Nature, 520: 45-50.
doi: 10.1038/nature14324
|
|
|
| [28] |
Poniatowski D, Stuhldreher G, Löffler F, et al. 2018. Patch occupancy of grassland specialists: Habitat quality matters more than habitat connectivity. Biological Conservation, 225: 237-244.
doi: 10.1016/j.biocon.2018.07.018
|
|
|
| [29] |
Riedler B, Lang S. 2018. A spatially explicit patch model of habitat quality, integrating spatio-structural indicators. Ecological Indicators, 94: 128-141.
doi: 10.1016/j.ecolind.2017.04.027
|
|
|
| [30] |
Sala O E, Chapin F S, Armesto J J, et al. 2000. Global biodiversity scenarios for the year 2100. Science, 287: 1770-1774.
pmid: 10710299
|
|
|
| [31] |
Sallustio L, De Toni A D, Strollo A, et al. 2017. Assessing habitat quality in relation to the spatial distribution of protected areas in Italy. Journal of Environmental Management, 201: 129-137.
doi: S0301-4797(17)30613-8
pmid: 28651222
|
|
|
| [32] |
Sharp R, Douglass J, Wolny S, et al. 2020. InVEST User Guide. [2021-12-11]. https://invest-userguide.readthedocs.io/en/latest/index.html.
|
|
|
| [33] |
Song S X, Liu Z F, He C Y, et al. 2020. Evaluating the effects of urban expansion on natural habitat quality by coupling localized shared socioeconomic pathways and the land use scenario dynamics-urban model. Ecological Indicators, 112: 106071, doi: 10.1016/j.ecolind.2020.106071.
doi: 10.1016/j.ecolind.2020.106071
|
|
|
| [34] |
Sun X, Lu Z M, Li F, et al. 2018. Analyzing spatio-temporal changes and trade-offs to support the supply of multiple ecosystem services in Beijing, China. Ecological Indicators, 94: 117-129.
doi: 10.1016/j.ecolind.2018.06.049
|
|
|
| [35] |
Sun X Y, Jiang Z, Liu F, et al. 2019. Monitoring spatio-temporal dynamics of habitat quality in Nansihu Lake basin, eastern China, from 1980 to 2015. Ecological Indicators, 102: 716-723.
doi: 10.1016/j.ecolind.2019.03.041
|
|
|
| [36] |
Tang F, Fu M C, Wang L, et al. 2020. Land-use change in Changli County, China: Predicting its spatio-temporal evolution in habitat quality. Ecological Indicators, 117: 106719, doi: 10.1016/j.ecolind.2020.106719.
doi: 10.1016/j.ecolind.2020.106719
|
|
|
| [37] |
Tang X G, Li H P, Xu X B, et al. 2016. Changing land use and its impact on the habitat suitability for wintering Anseriformes in China's Poyang Lake region. Science of the Total Environment, 557-558: 296-306.
doi: 10.1016/j.scitotenv.2016.03.108
|
|
|
| [38] |
Terrado M, Sabater S, Chaplin-Kramer B, et al. 2016. Model development for the assessment of terrestrial and aquatic habitat quality in conservation planning. Science of the Total Environment, 540: 63-70.
doi: 10.1016/j.scitotenv.2015.03.064
|
|
|
| [39] |
Vellend M, Lilley P L, Starzomski B M. 2008. Using subsets of species in biodiversity surveys. Journal of Applied Ecology, 45: 161-169.
doi: 10.1111/j.1365-2664.2007.01413.x
|
|
|
| [40] |
Wilson M C, Chen X Y, Corlett R T, et al. 2015. Habitat fragmentation and biodiversity conservation: key findings and future challenges. Landscape Ecology, 31: 219-227.
doi: 10.1007/s10980-015-0312-3
|
|
|
| [41] |
Xie Y J, Ng C N. 2013. Exploring spatio-temporal variations of habitat loss and its causal factors in the Shenzhen River cross-border watershed. Applied Geography, 39: 140-150.
doi: 10.1016/j.apgeog.2013.01.001
|
|
|
| [42] |
Xu B R, Liu Y C, Dong Y, et al. 2021. Evaluation of habitat quality in Lanzhou Region based on InVEST model. Journal of Desert Research, 41(5): 120-129. (in Chinese)
|
|
|
| [43] |
Yang J, Xie B P, Zhang D G. 2021. Spatial-temporal heterogeneity of ecosystem services trade-off synergy in the Yellow River Basin. Journal of Desert Research, 41(6): 78-87. (in Chinese)
|
|
|
| [44] |
Zhou K H, Liu Y L, Tan R H, et al. 2014. Urban dynamics, landscape ecological security, and policy implications: A case study from the Wuhan area of central China. Cities, 41: 141-153.
doi: 10.1016/j.cities.2014.06.010
|
|
|
| [45] |
Zhou W X, Shi P J, Wang Y N, et al. 2017. Effect of ecosystem service values of river valley city: A case study of Lanzhou. Arid Zone Research, 34(1): 232-241. (in Chinese)
|
|
|
| [46] |
Zhu C M, Zhang X L, Zhou M M, et al. 2020. Impacts of urbanization and landscape pattern on habitat quality using OLS and GWR models in Hangzhou, China. Ecological Indicators, 117: 106654, doi: 10.1016/j.ecolind.2020.106654.
doi: 10.1016/j.ecolind.2020.106654
|
|
|
|
Viewed |
|
|
|
Full text
|
|
|
|
|
Abstract
|
|
|
|
|
Cited |
|
|
|
|
| |
Shared |
|
|
|
|
| |
Discussed |
|
|
|
|