Ecozone-dependent reorganization of multifactor interactions controls actual evapotranspiration across arid mountain-basin systems
MA Zhenrong1,2, WANG Yongdong1,2,*(), ZHOU Zhibin1,2, CHEN Yusen1,2
1National Engineering Research Center for Desert-Oasis Ecological Construction Technology, Xinjiang Institute of Ecology and Geography, Chinese Academy of Sciences, Xinjiang 830011, China 2University of Chinese Academy of Sciences, Beijing 100049, China
Actual evapotranspiration (ETa) is a key regulator of land-atmosphere water and energy exchanges in arid regions. However, the coupled effects of its controlling factors along mountain-basin gradients remain poorly quantified, limiting precise water resource management. Based on multi-source data (2001-2022) from Xinjiang Uygur Autonomous Region, China, this study analyzed the spatiotemporal patterns of ETa across five eco-zones: the Altay Mountains, Junggar Basin, Tianshan Mountains, Tarim Basin, and Kunlun Mountains. Using Mann-Kendall and Theil-Sen trend analyses, GeoDetector, and Random Forest model, we quantified the contributions and interactions of seven environmental drivers: air temperature, precipitation, soil moisture, wind speed, net radiation, vapour pressure deficit, and leaf area index. The multi-year mean ETa over Xinjiang was 193.15(±21.16) mm/a, showing a distinct ''high in mountains and low in basins'' spatial pattern. A significant increasing trend of 1.60 mm/a was observed regionally, yet with clear spatial divergence, i.e., ETa increased in the major mountain ranges but decreases or stabilized in the hyper-arid Tarim Basin and transitional Junggar Basin. Water-supply factors (precipitation and soil moisture) explained about 40% of the spatial variance individually, while factor interactions enhanced the explanatory power substantially (maximum interaction gain (Δq)=0.18), indicating that bivariate and nonlinear combinations captured ETa patterns more effectively than single driver. Interaction regimes were strongly ecozone-dependent and varied between wet and dry years. Through comparing the wet year (2003) with the dry year (2022), we found a reorganization of dominant interaction pairs: the hyper-arid Tarim Basin shifted from hydrothermal control to vegetation-water-stress coupling; the Junggar Basin maintained persistent vegetation-energy coupling; the Altay and Tianshan Mountains strengthened vegetation-mediated interactions during drought; and the Kunlun Mountains transition from hydrothermal to moisture-aerodynamic control. These results clarify how complex topography and vegetation physiology modulate macroclimatic forcing in this arid mountain-basin system. These findings offer a process-based foundation for ecohydrological zoning, and provide critical insights for adaptive water ecosystem management and sustainable development in response to the "warming and wetting" trend in global drylands.
Received: 12 January 2026
Published: 31 August 2026
Conceptualization, methodology, software, formal analysis, investigation, data curation, visualization, and writing - original draft preparation: MA Zhenrong; Writing - review and editing: WANG Yongdong; ZHOU Zhibin, CHEN Yusen; Supervision: CHEN Yushen. All authors approved the manuscript.
MA Zhenrong, WANG Yongdong, ZHOU Zhibin, CHEN Yusen. Ecozone-dependent reorganization of multifactor interactions controls actual evapotranspiration across arid mountain-basin systems. Journal of Arid Land, 2026, 18(8): 1354-1377.
Fig. 1Division of ecozones (R1-R5) of the study area, China. DEM, digital elevation model. The figure is based on the standard map (GS(2024)0650) provided by the National Platform for Common Geospatial Information Services (http://bzdt.ch.mnr.gov.cn/), and the boundary of the base map has not been modified.
No.
Ecozone name
Geographic name
Landscape
R1
Altay-western Junggar mountain forest-steppe zone
Altay Mountains
Mountain
R2
Junggar Basin desert zone
Junggar Basin
Basin
R3
Tianshan mountain forest-steppe zone
Tianshan Mountains
Mountain
R4
Tarim Basin-eastern Xinjiang desert zone
Tarim Basin
Basin
R5
Pamir-Kunlun-Altun alpine frigid desert-steppe zone
Kunlun Mountains
Mountain
Table 1 Classification of the five ecozones
Dataset
Data product
Spatial resolution
Temporal resolution
Source
Administrative boundary
Xinjiang administrative boundary (GS(2024)0650)
-
-
Tianditu (http:// cloudcenter.tianditu.gov.cn)
Ecozones
R1-R5 ecozones
-
-
Peking University GeoData (http://geodata.pku.edu.cn)
ETa
PML_V2 v0.1.8 (coupled ET and GPP) via GEE
500 m (resampled to 1 km)
8-d, monthly, and annual scales
GEE (Zhang et al., 2016; Gan et al., 2018; Zhang et al., 2019)
Meteorology
ERA5-Land monthly means (T, P, SM, Wind, Rn, and VPD)
Native grid (resampled to 1 km)
Monthly
Copernicus Data Store (Muñoz-Sabater et al., 2021)
Drought index
HSPEI
1 km
Multi-scale (1/12-month)
10.57760/sciencedb.ecodb.00090
Topography
DEM
30 m (resampled to 1 km)
-
USGS/NASA LP DAAC (Farr et al., 2007)
Vegetation
MOD15A2H.061
500 m (resampled to 1 km)
8-d
GEE/LP DAAC
Table 2 Information of the data used in the study
Data range
Trend
Probability (P')
ΔP'
SPEI≥2.00
Extremely wet (EW)
0.977-1.000
0.023
1.50≤SPEI≤1.99
Severely wet (SW)
0.933-0.977
0.044
1.00≤SPEI≤1.49
Moderately wet (MW)
0.841-0.933
0.092
-0.99≤SPEI≤0.99
Near normal (N)
0.159-0.841
0.682
-1.49≤SPEI≤ -1.00
Moderate drought (MD)
0.067-0.159
0.092
-1.99≤SPEI≤ -1.50
Severe drought (SD)
0.023-0.067
0.044
SPEI≤ -2.00
Extreme drought (ED)
0.000-0.023
0.023
Table 3 Classification of dry and wet periods
Description
Interaction
q12<min(q1, q2)
Weakened and nonlinear
min(q1, q2)<q12<max(q1, q2)
Weakened and univariate
max(q1, q2)<q12<q1+q2
Enhanced and bivariate
q12=q1+q2
Independent
q12>q1+q2
Enhanced and nonlinear
Table 4 Categories of interactions between two factors and their interactive relationship
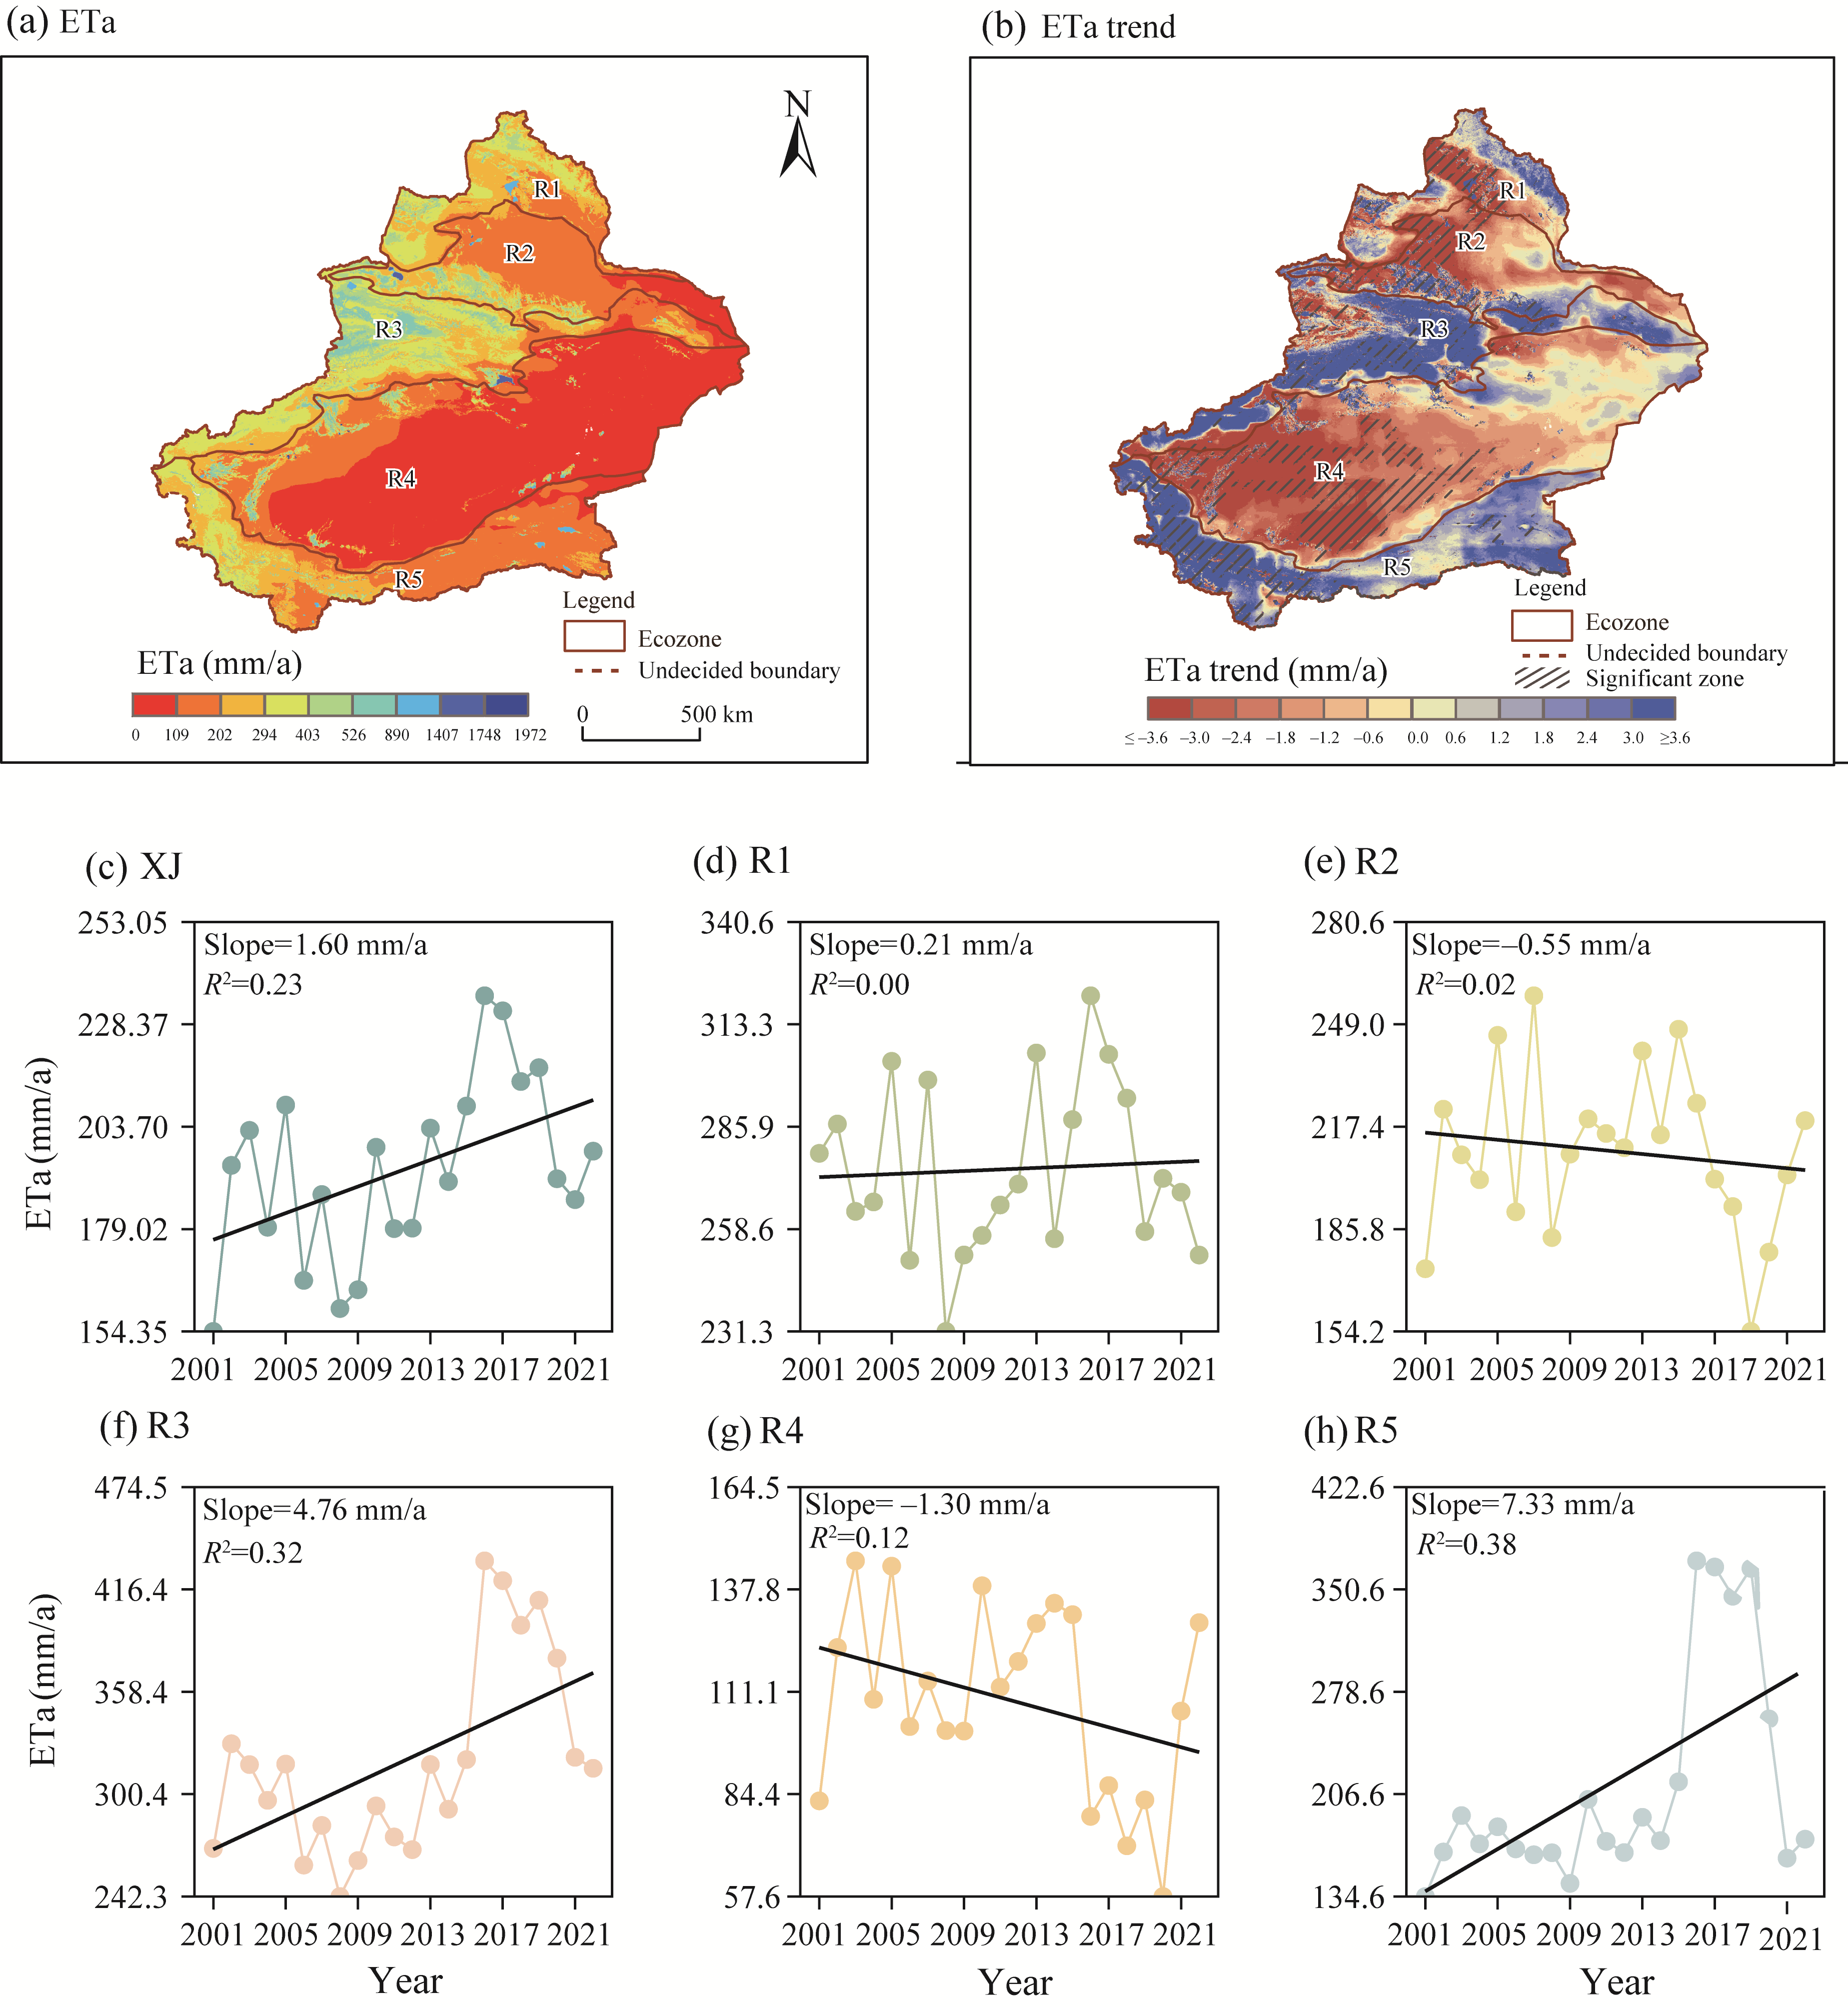
Fig. 2Spatial and temporal patterns of actual evapotranspiration (ETa) in Xinjiang (XJ) and its five ecozones during 2001-2022. (a), ETa; (b), ETa trend; (c-f), annual ETa time series and linear trends for XJ as a whole and its five ecozones (R1-R5).
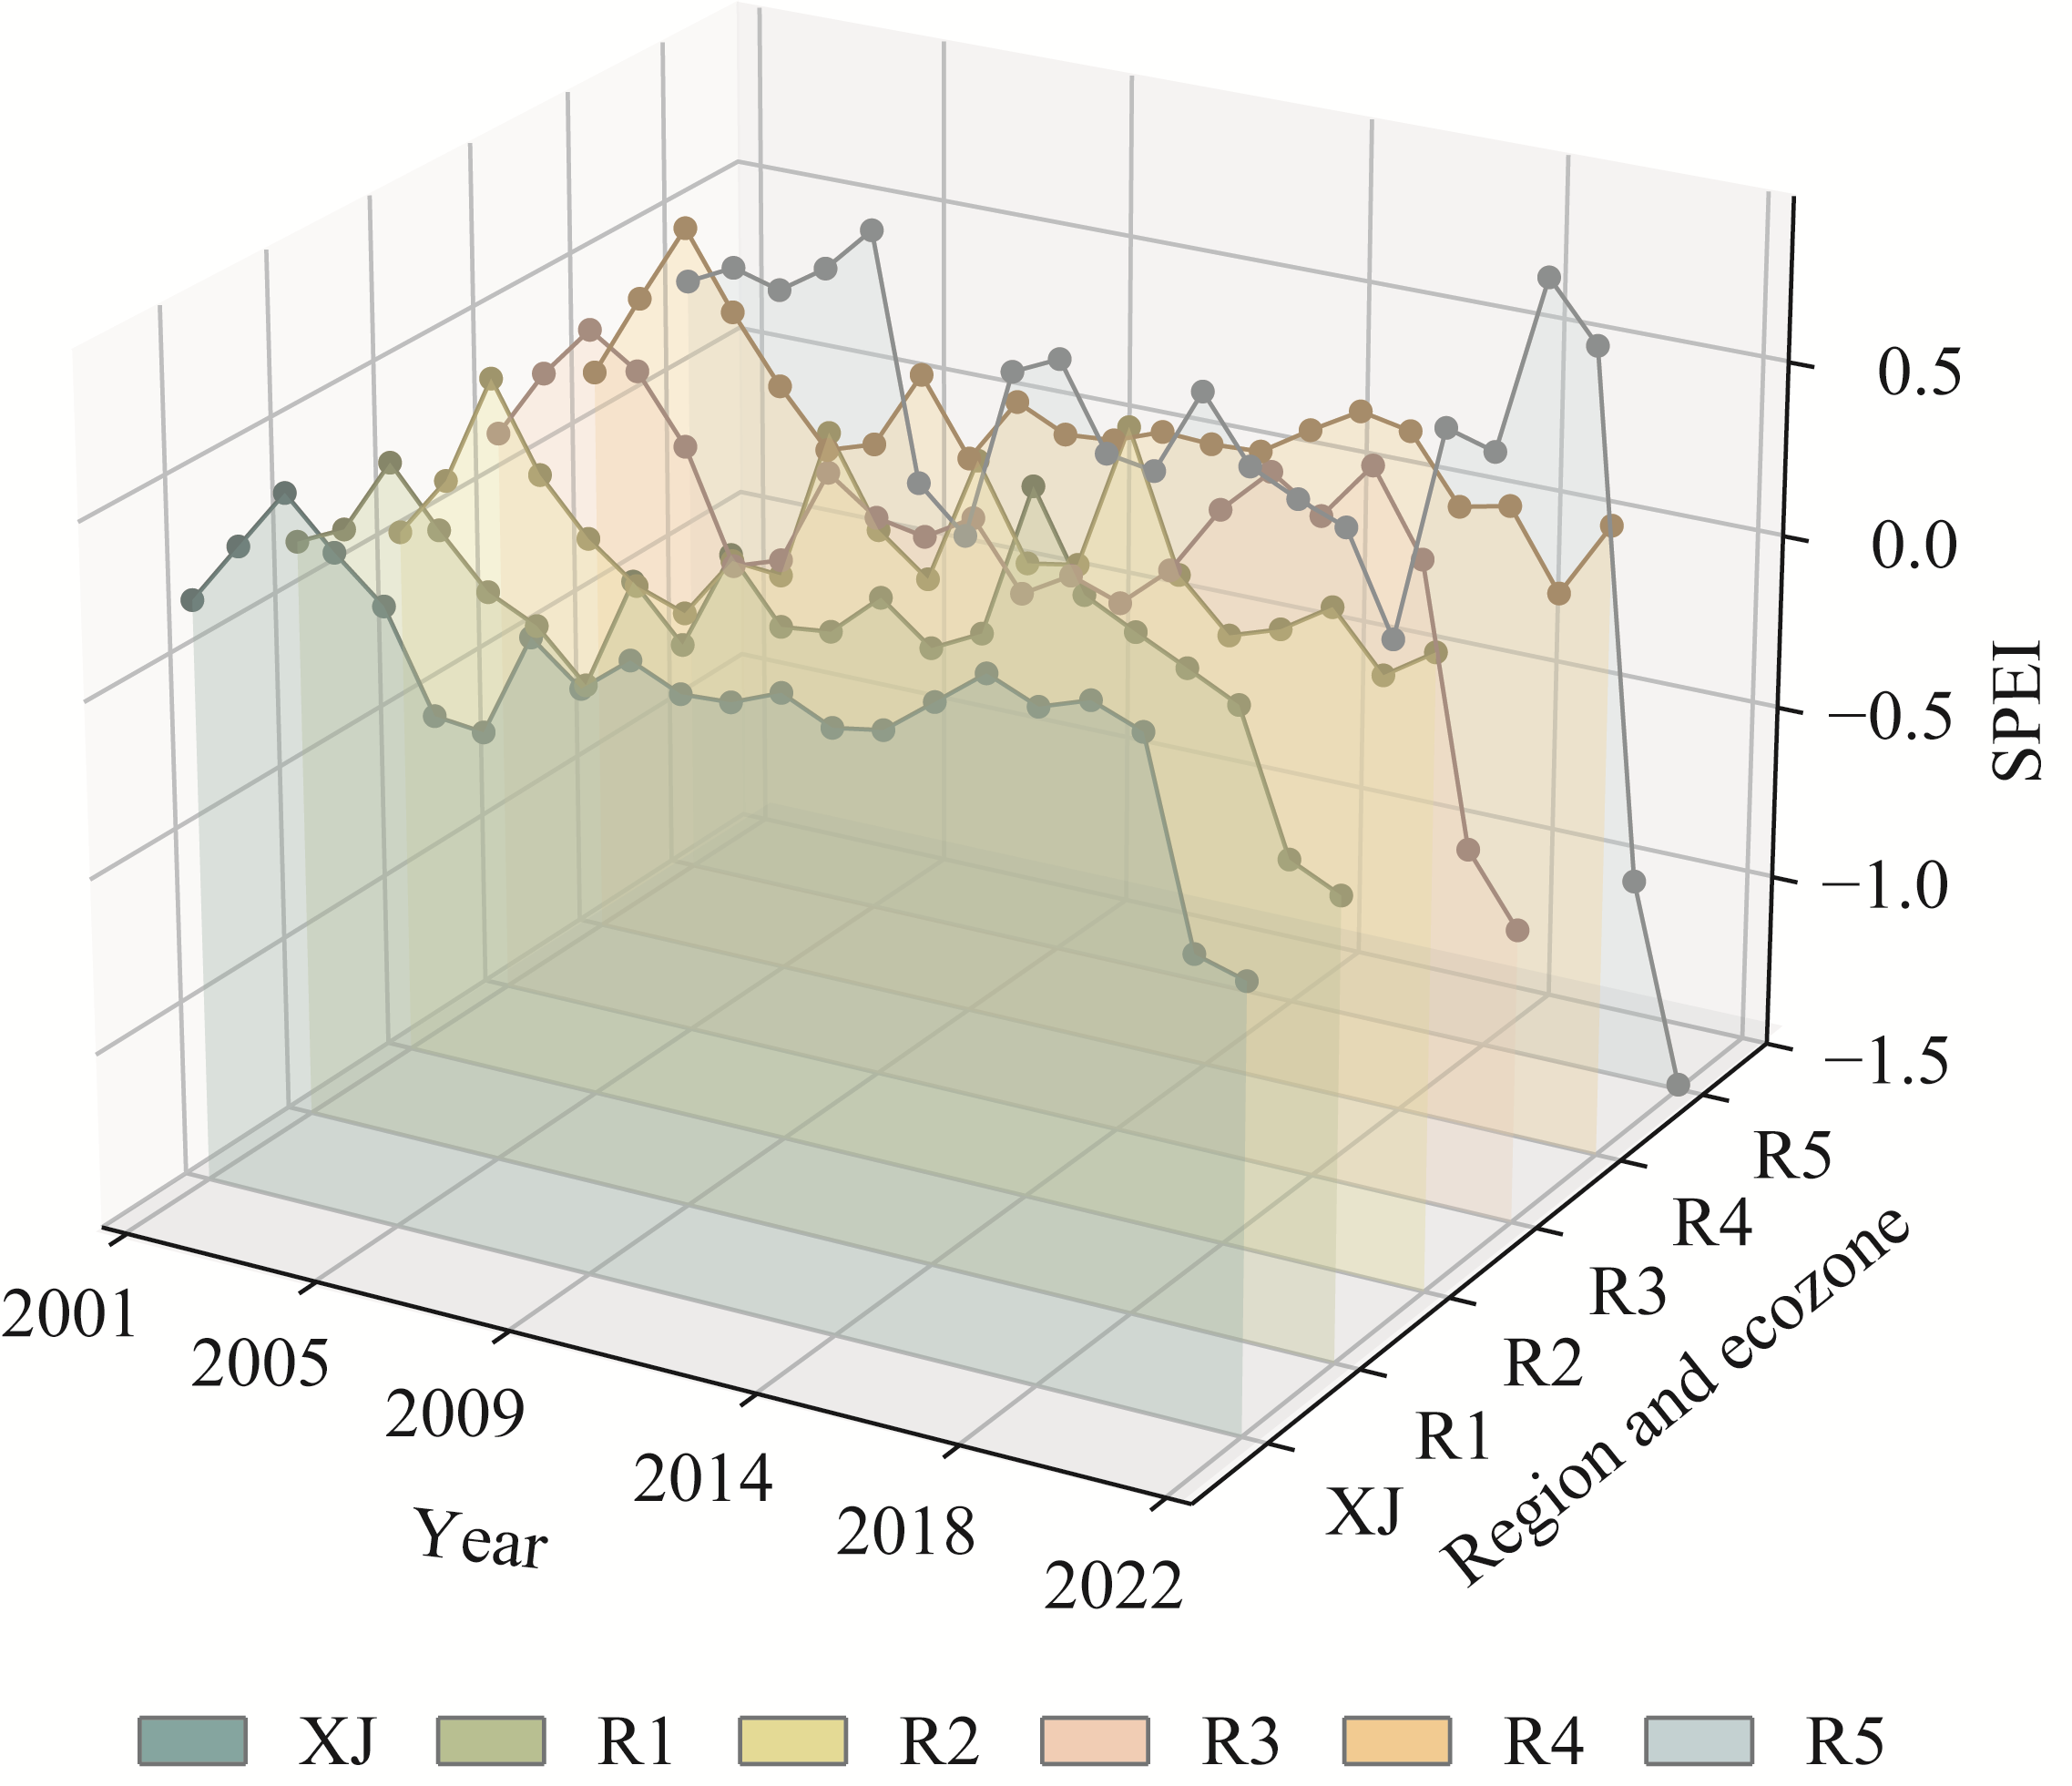
Fig. 3Inter-annual variation of standardized precipitation evapotranspiration index (SPEI) in XJ and its five ecozones during 2001-2022
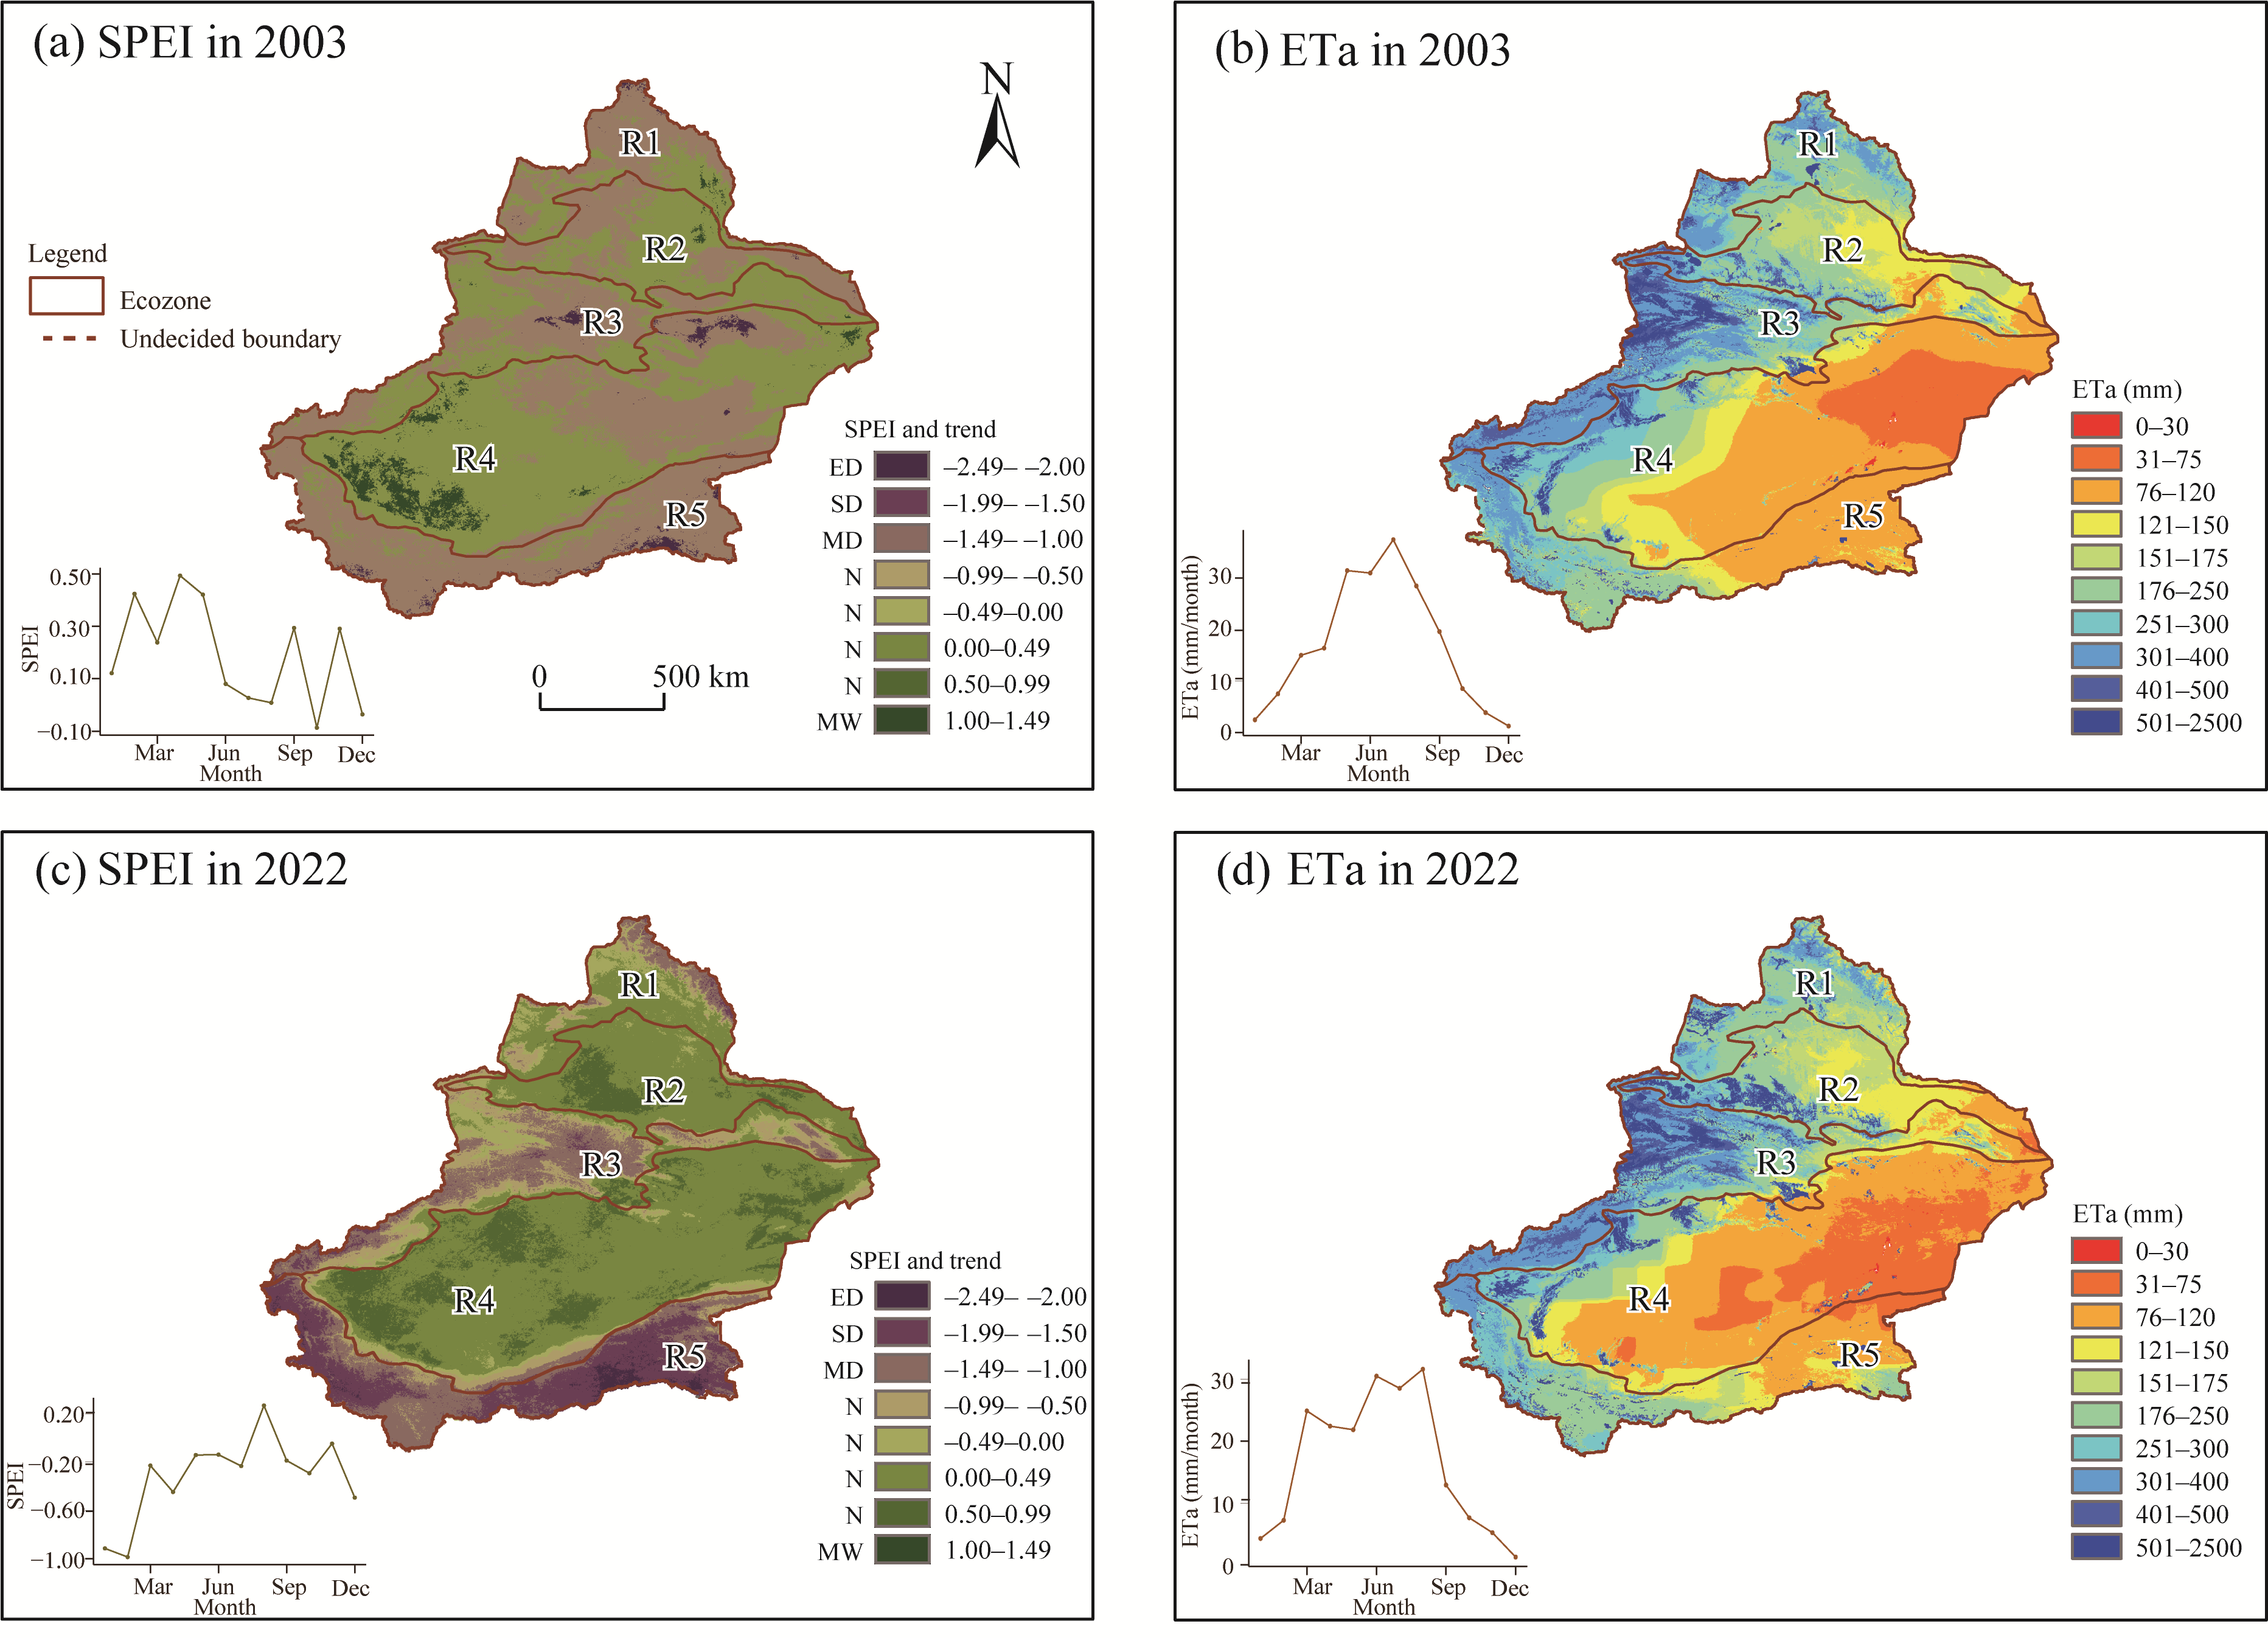
Fig. 4Spatial patterns and monthly trends of SPEI (a and c) and ETa (b and d) in 2003 (the wet year) and 2022 (the dry year). ED, extreme drought; SD, severe drought; MD, moderate drought; N, near normal; MW, moderately wet. The details of classification criteria are shown in Table 3.
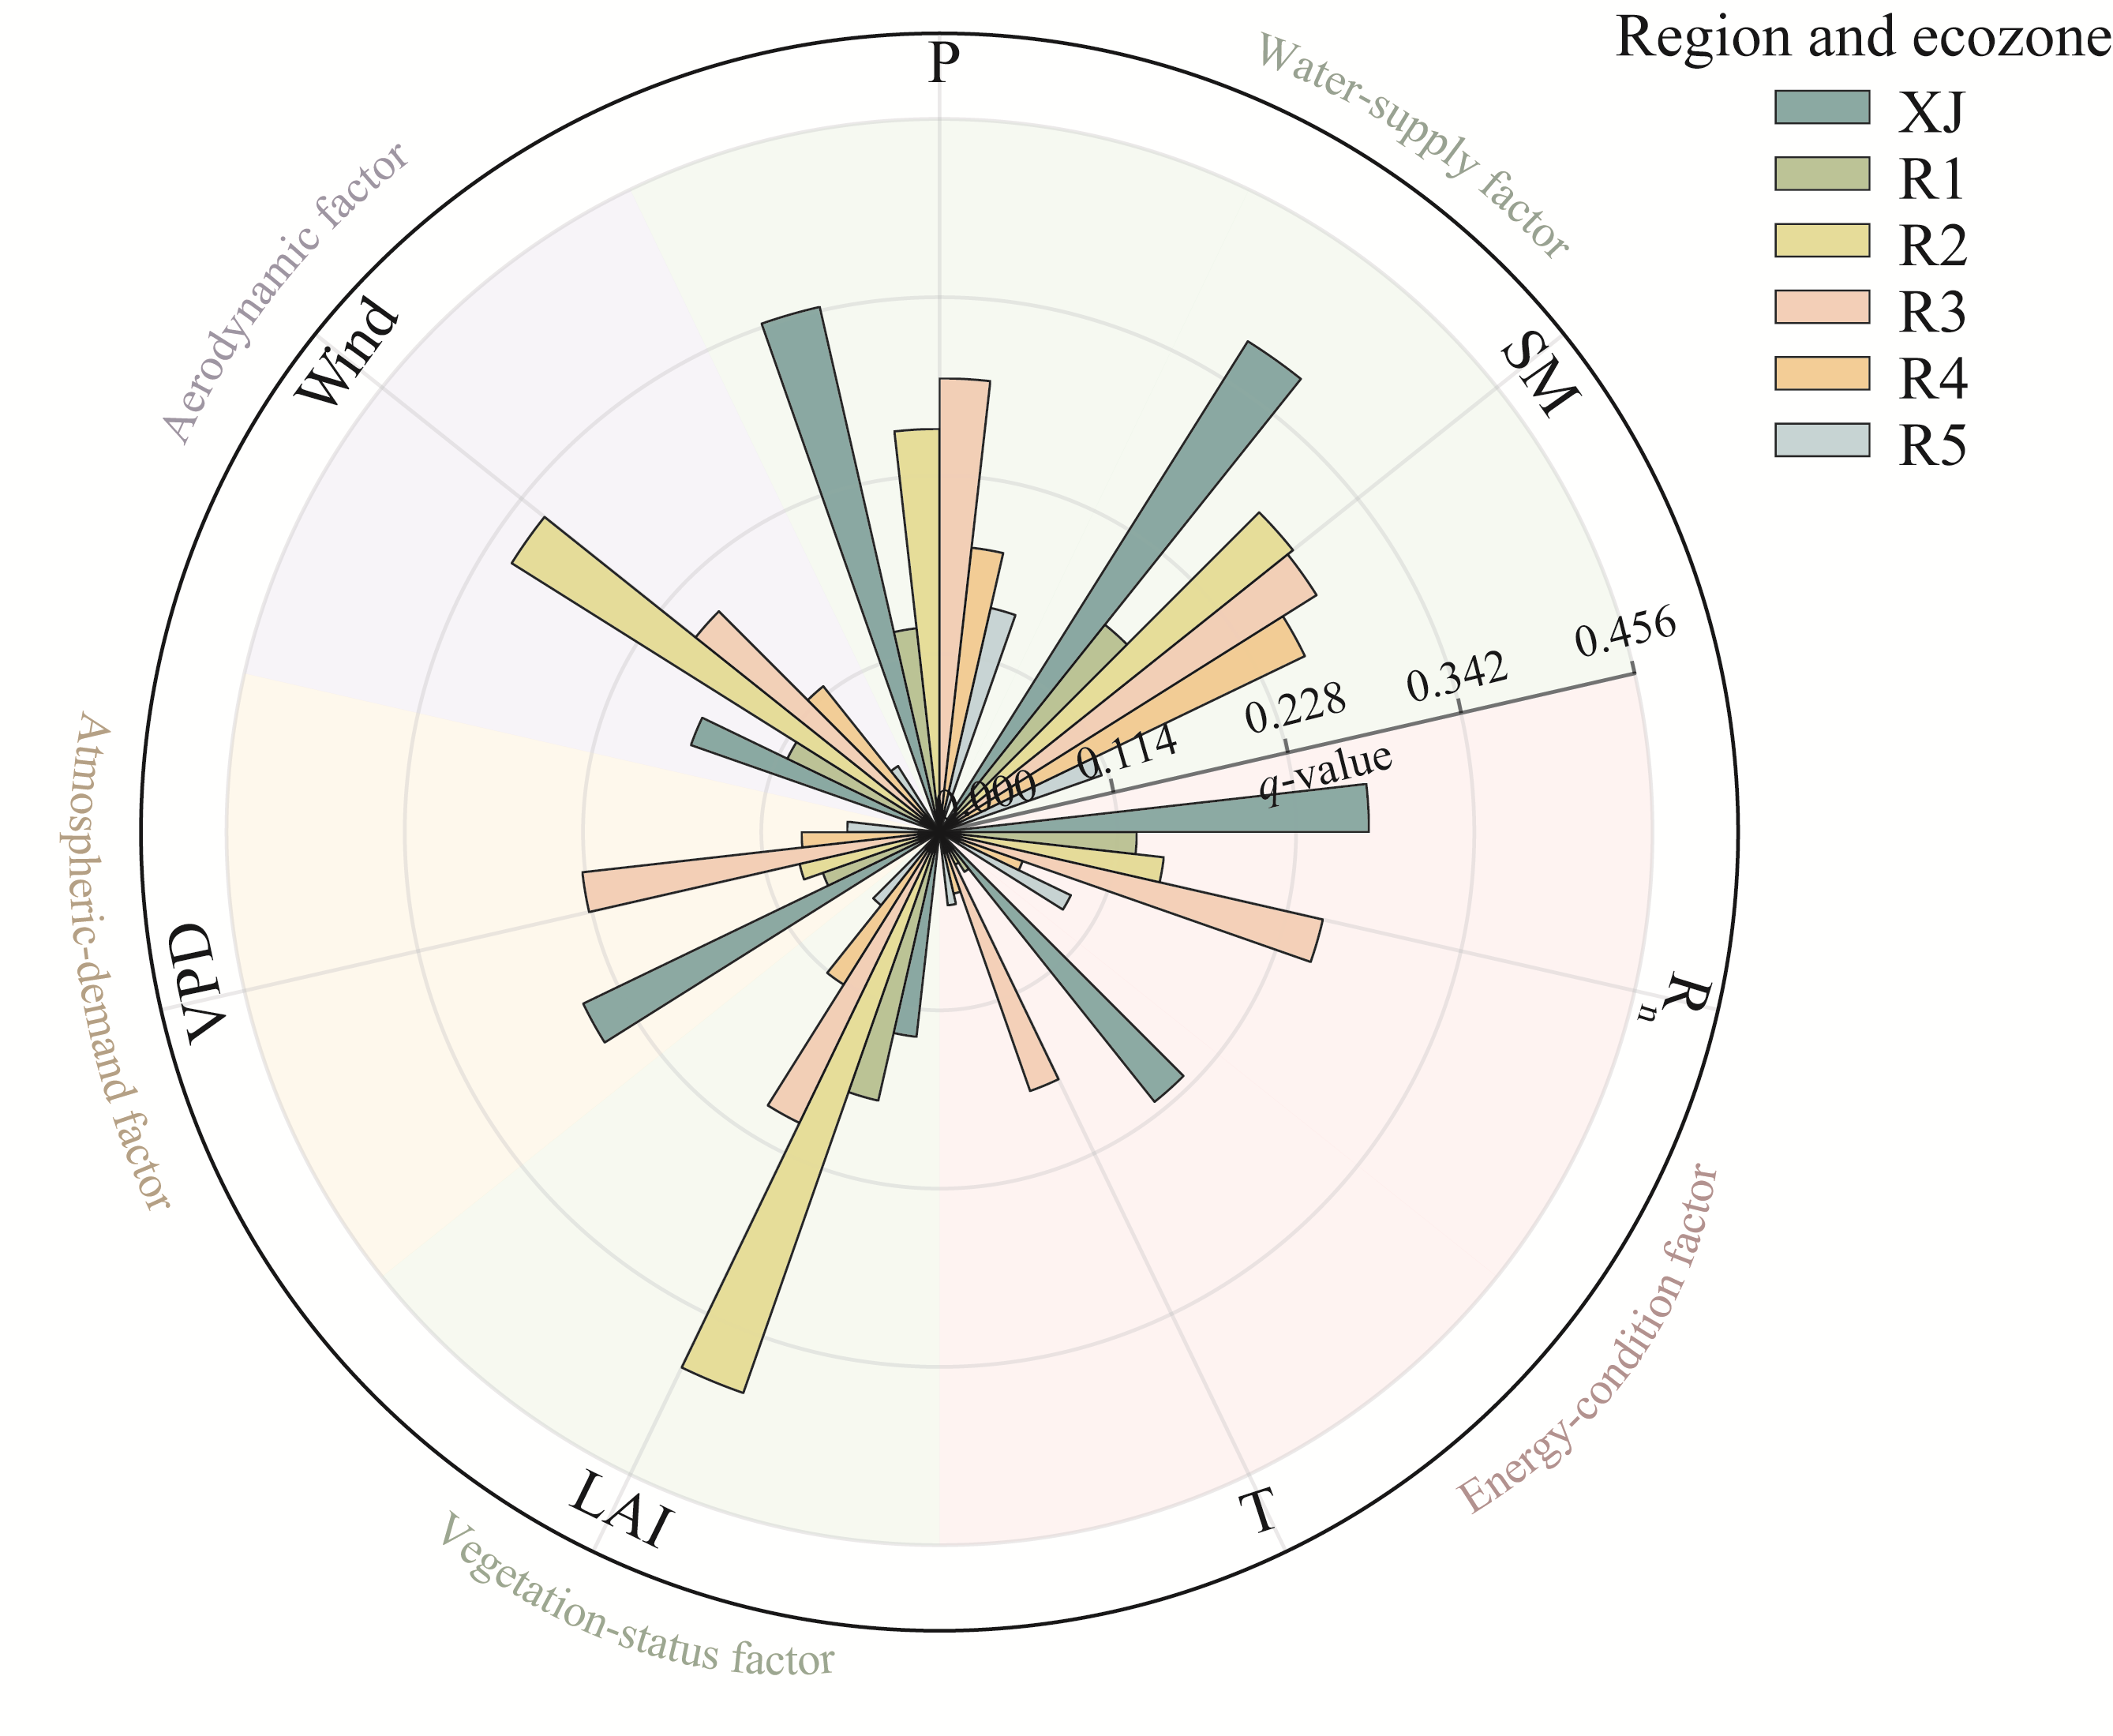
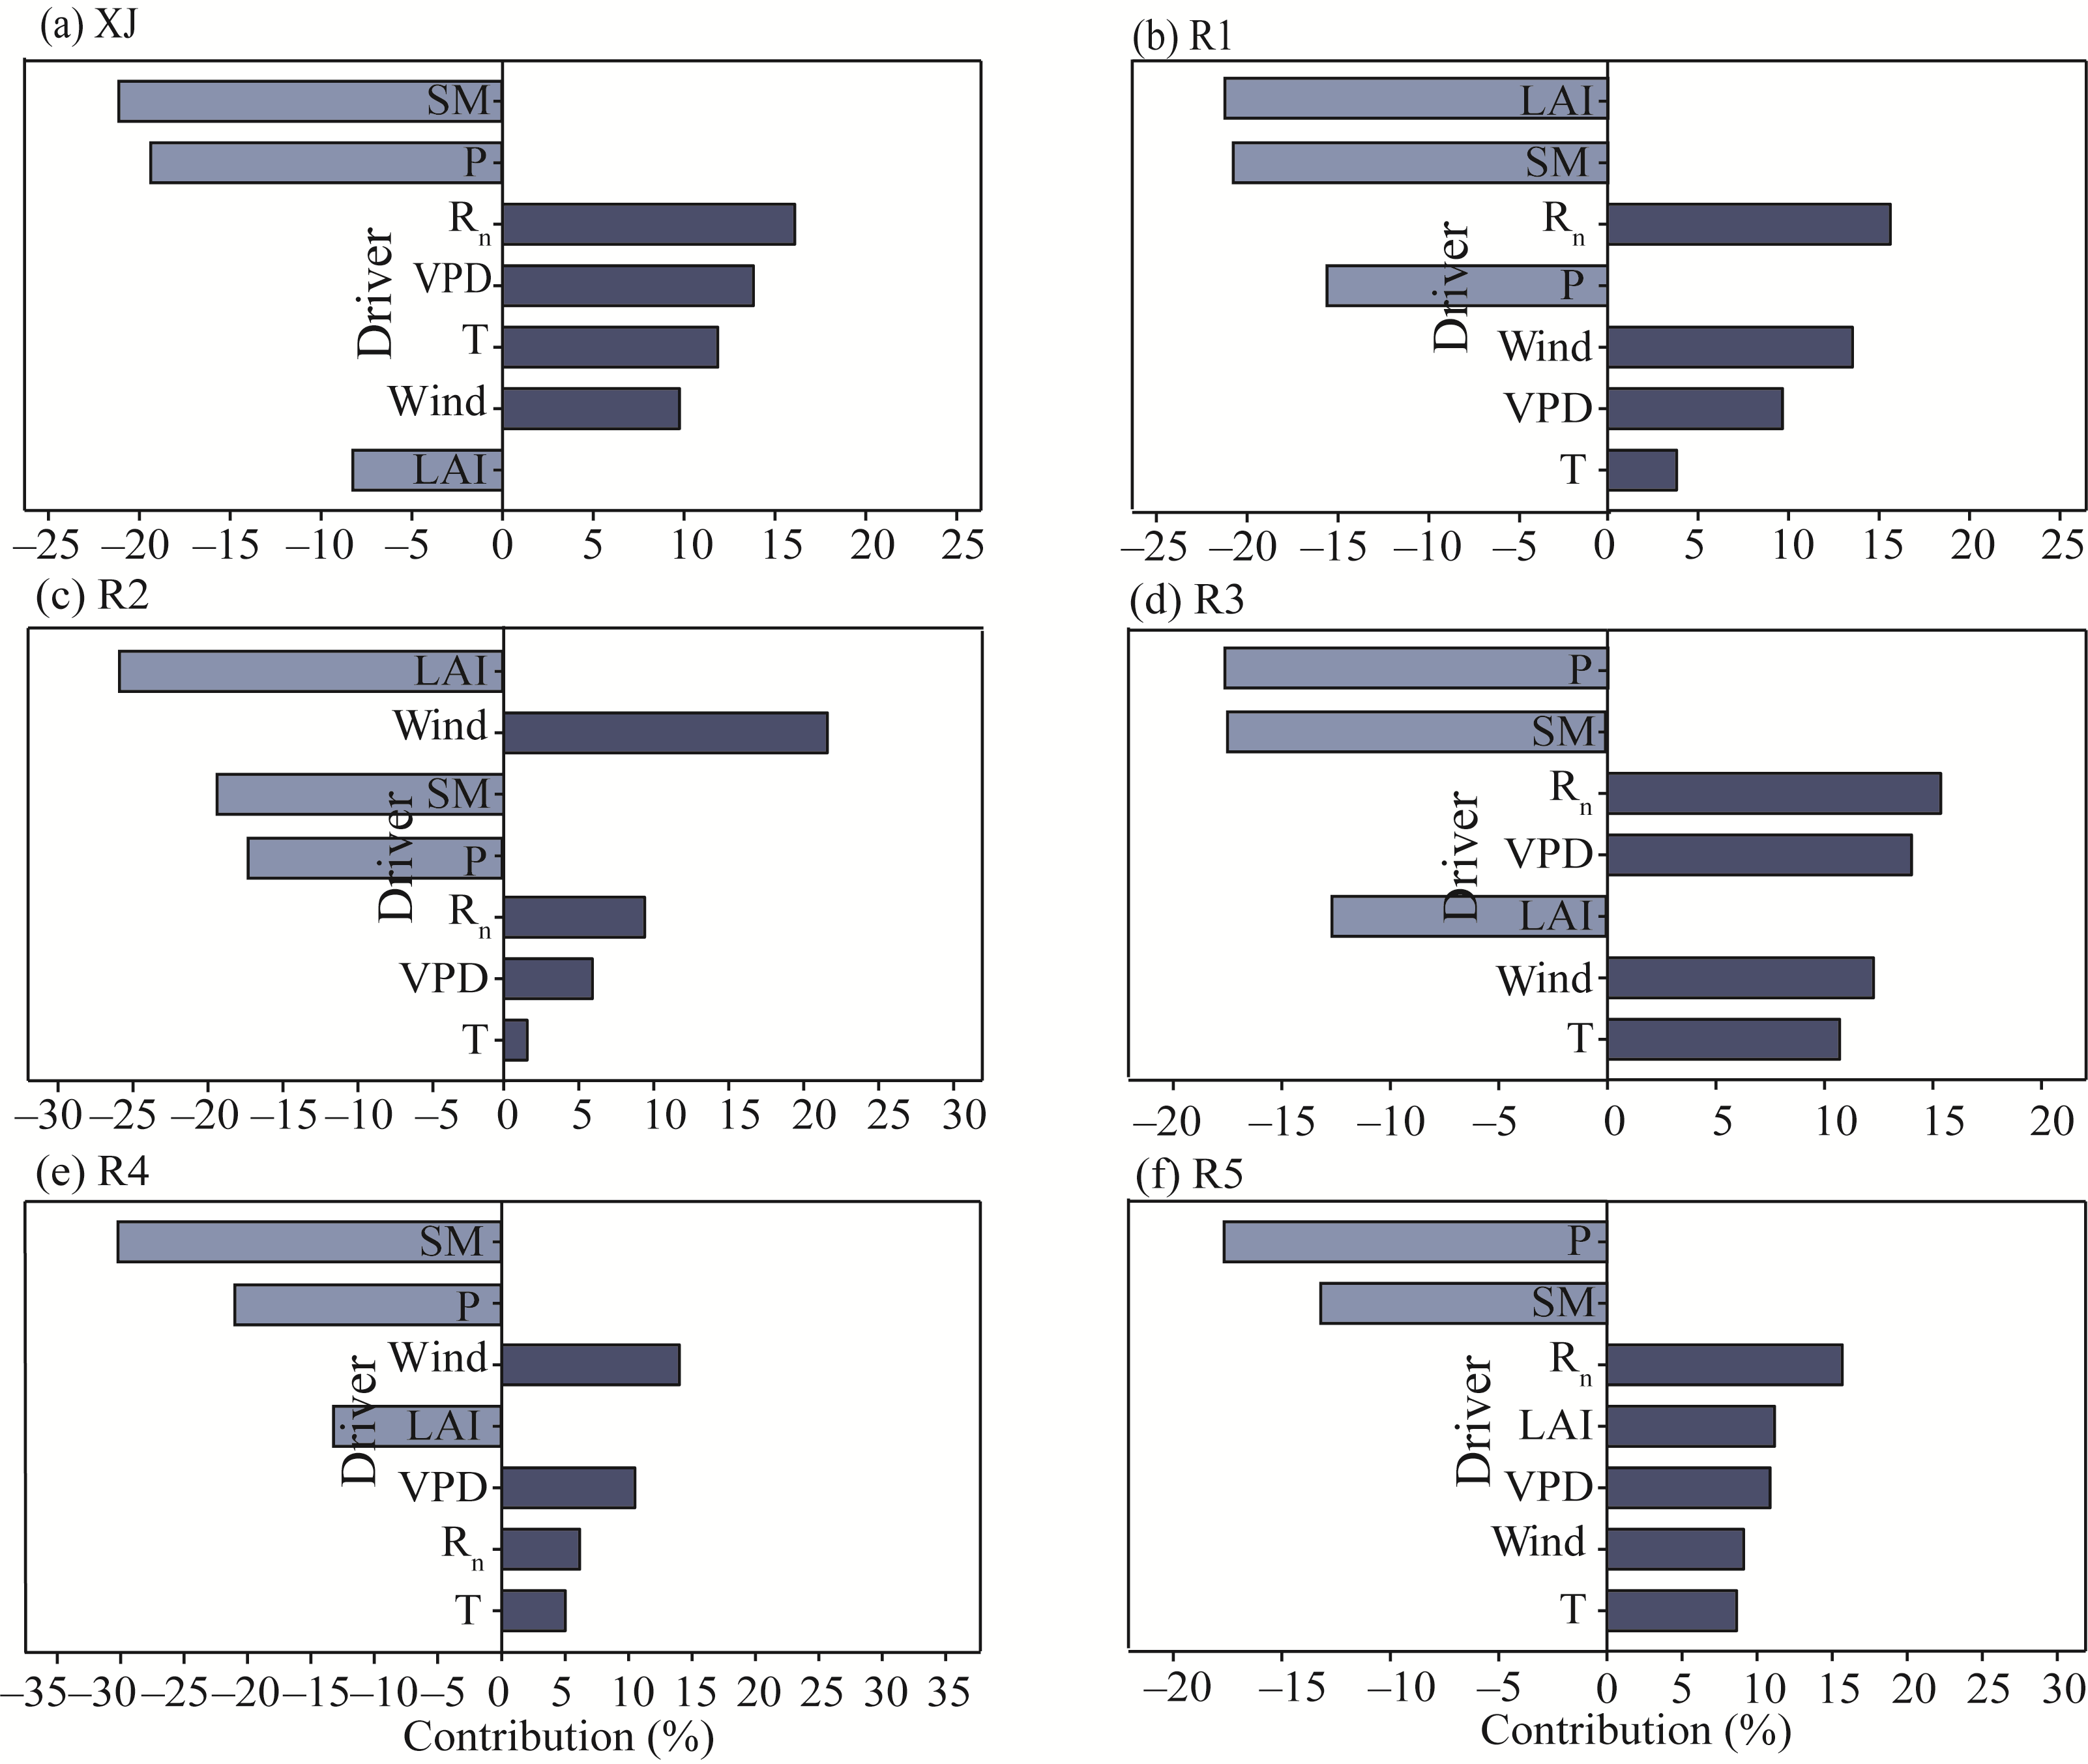
Fig. 5Multi-year mean GeoDetector contributions of individual driver across to the spatial heterogeneity of ETa in XJ and its five ecozones during 2001-2022. P, precipitation; SM, soil moisture; Rn, net radiation; T, temperature; LAI, leaf area index; VPD, vapor pressure deficit.
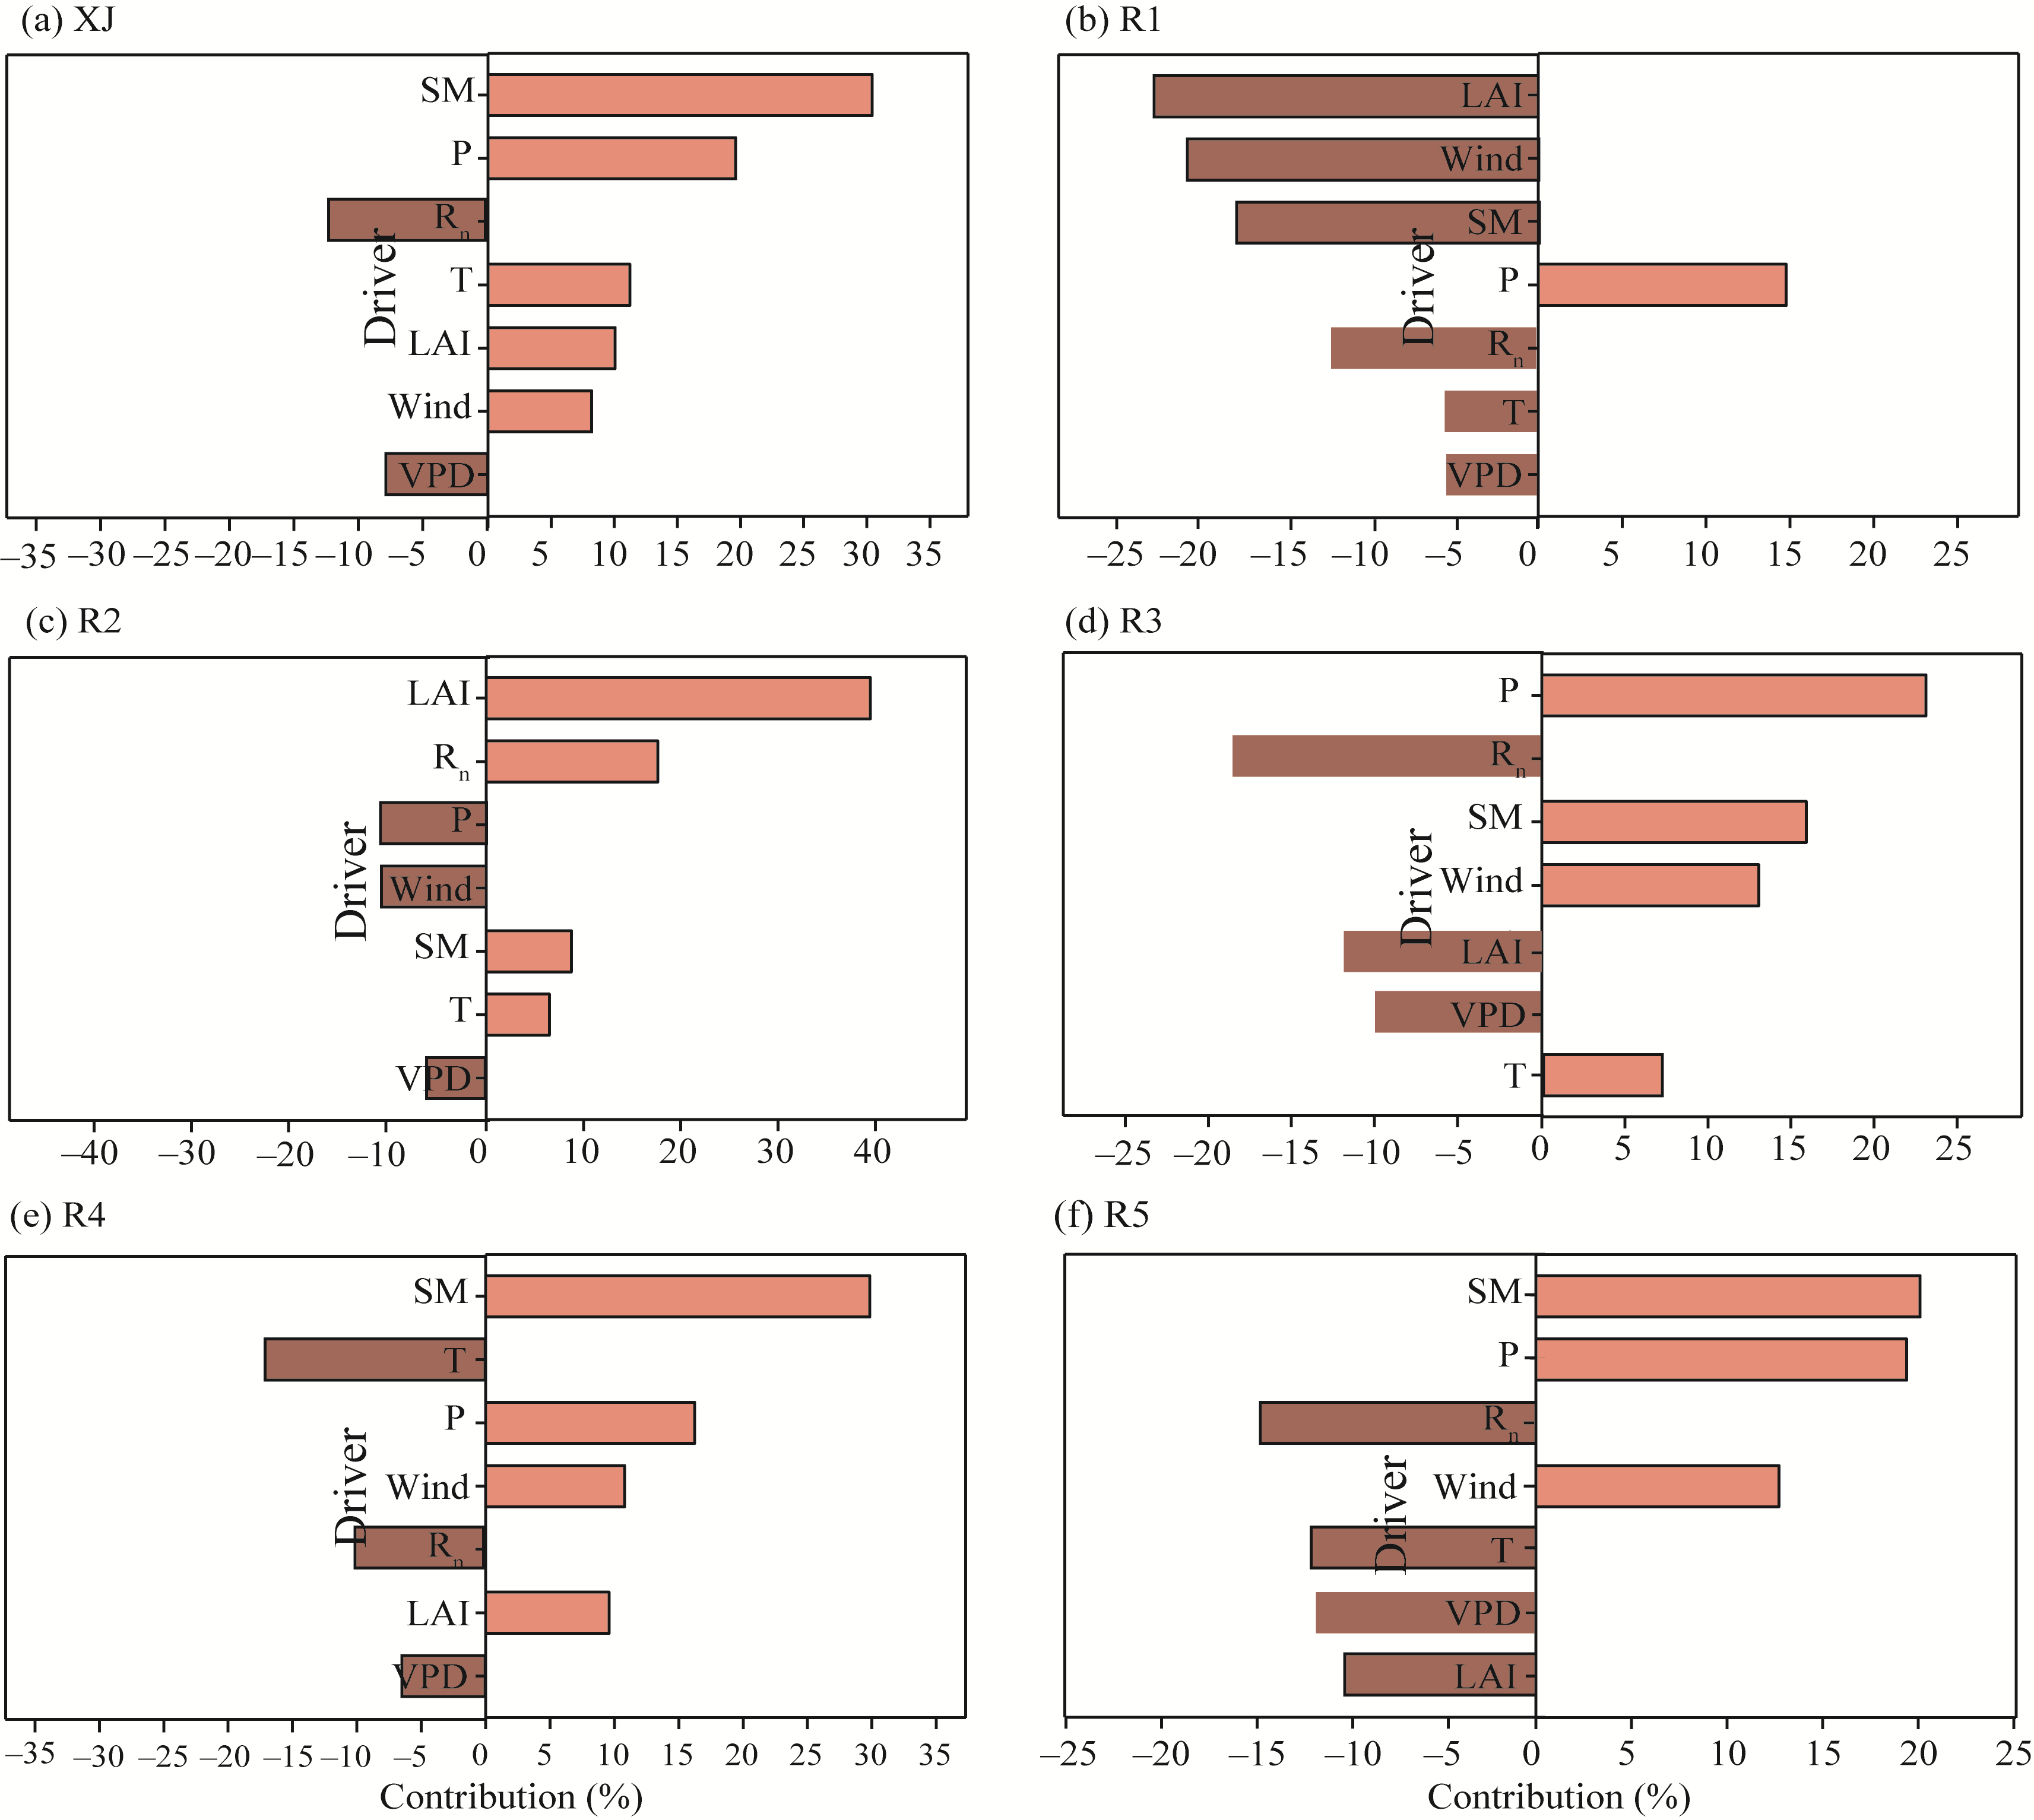
Fig. 6Contribution of GeoDetector to ETa drivers in XJ (a) and its ecozones (b-f) during 2001-2022
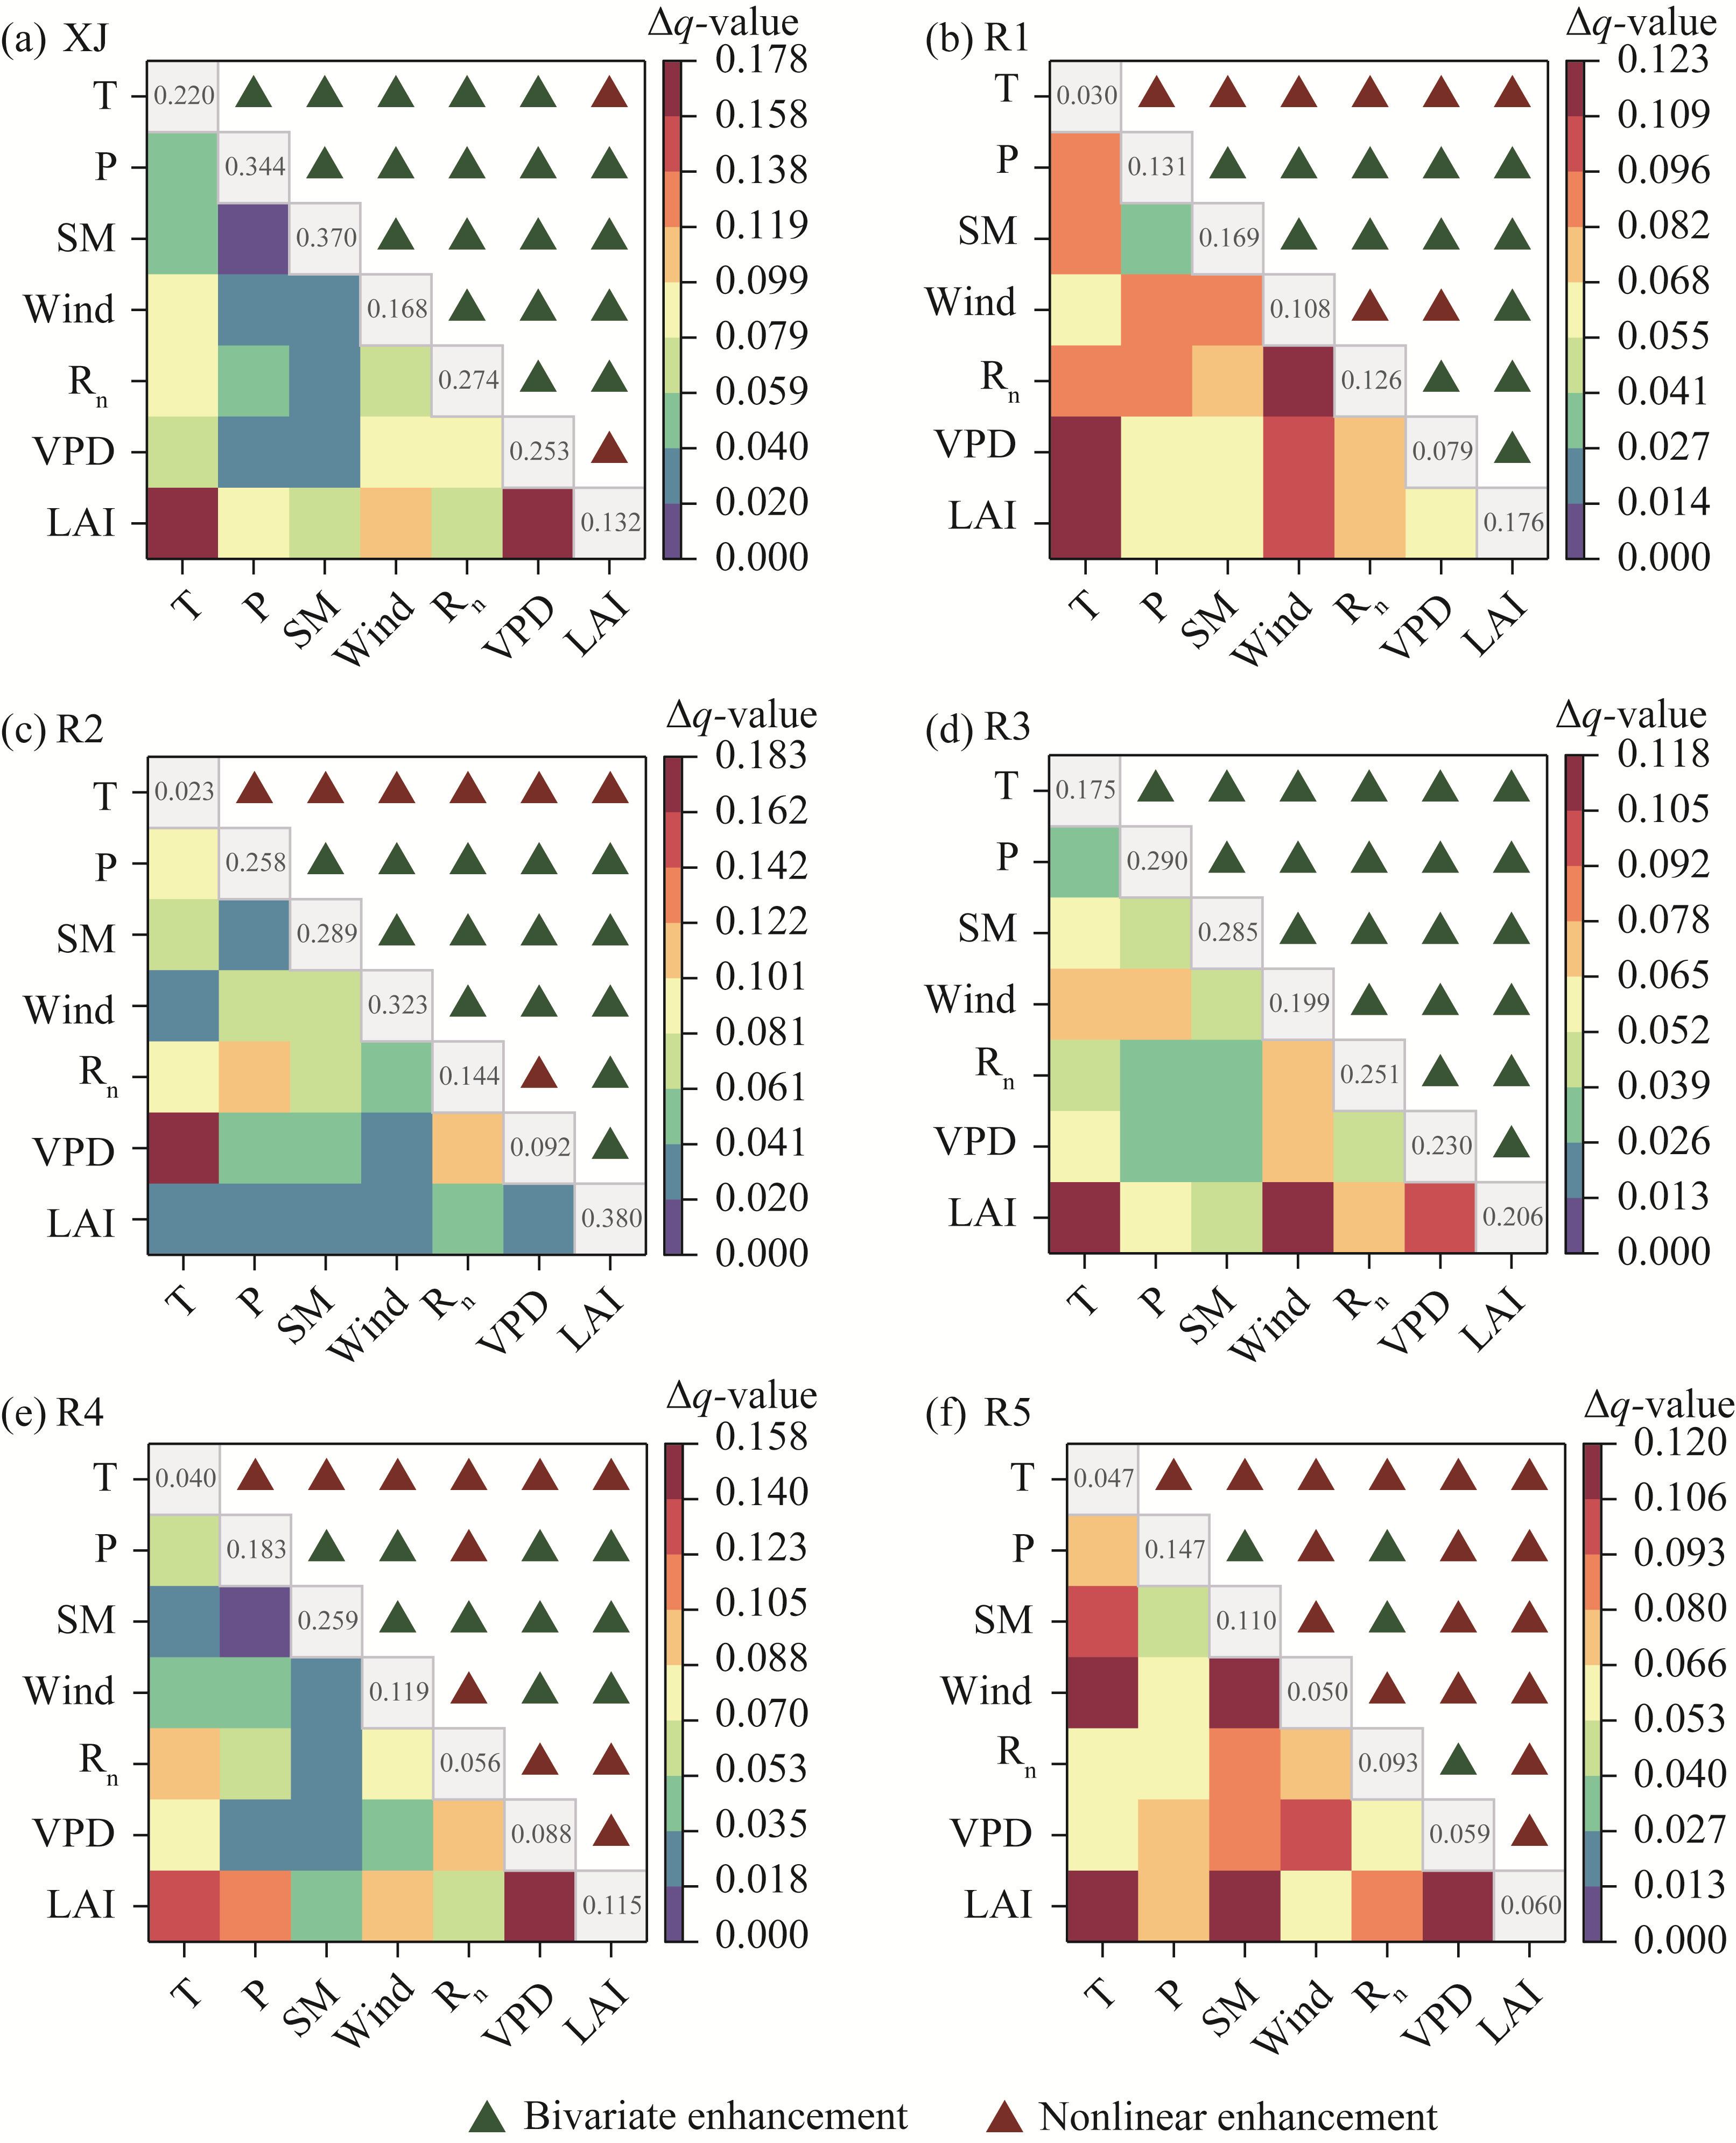
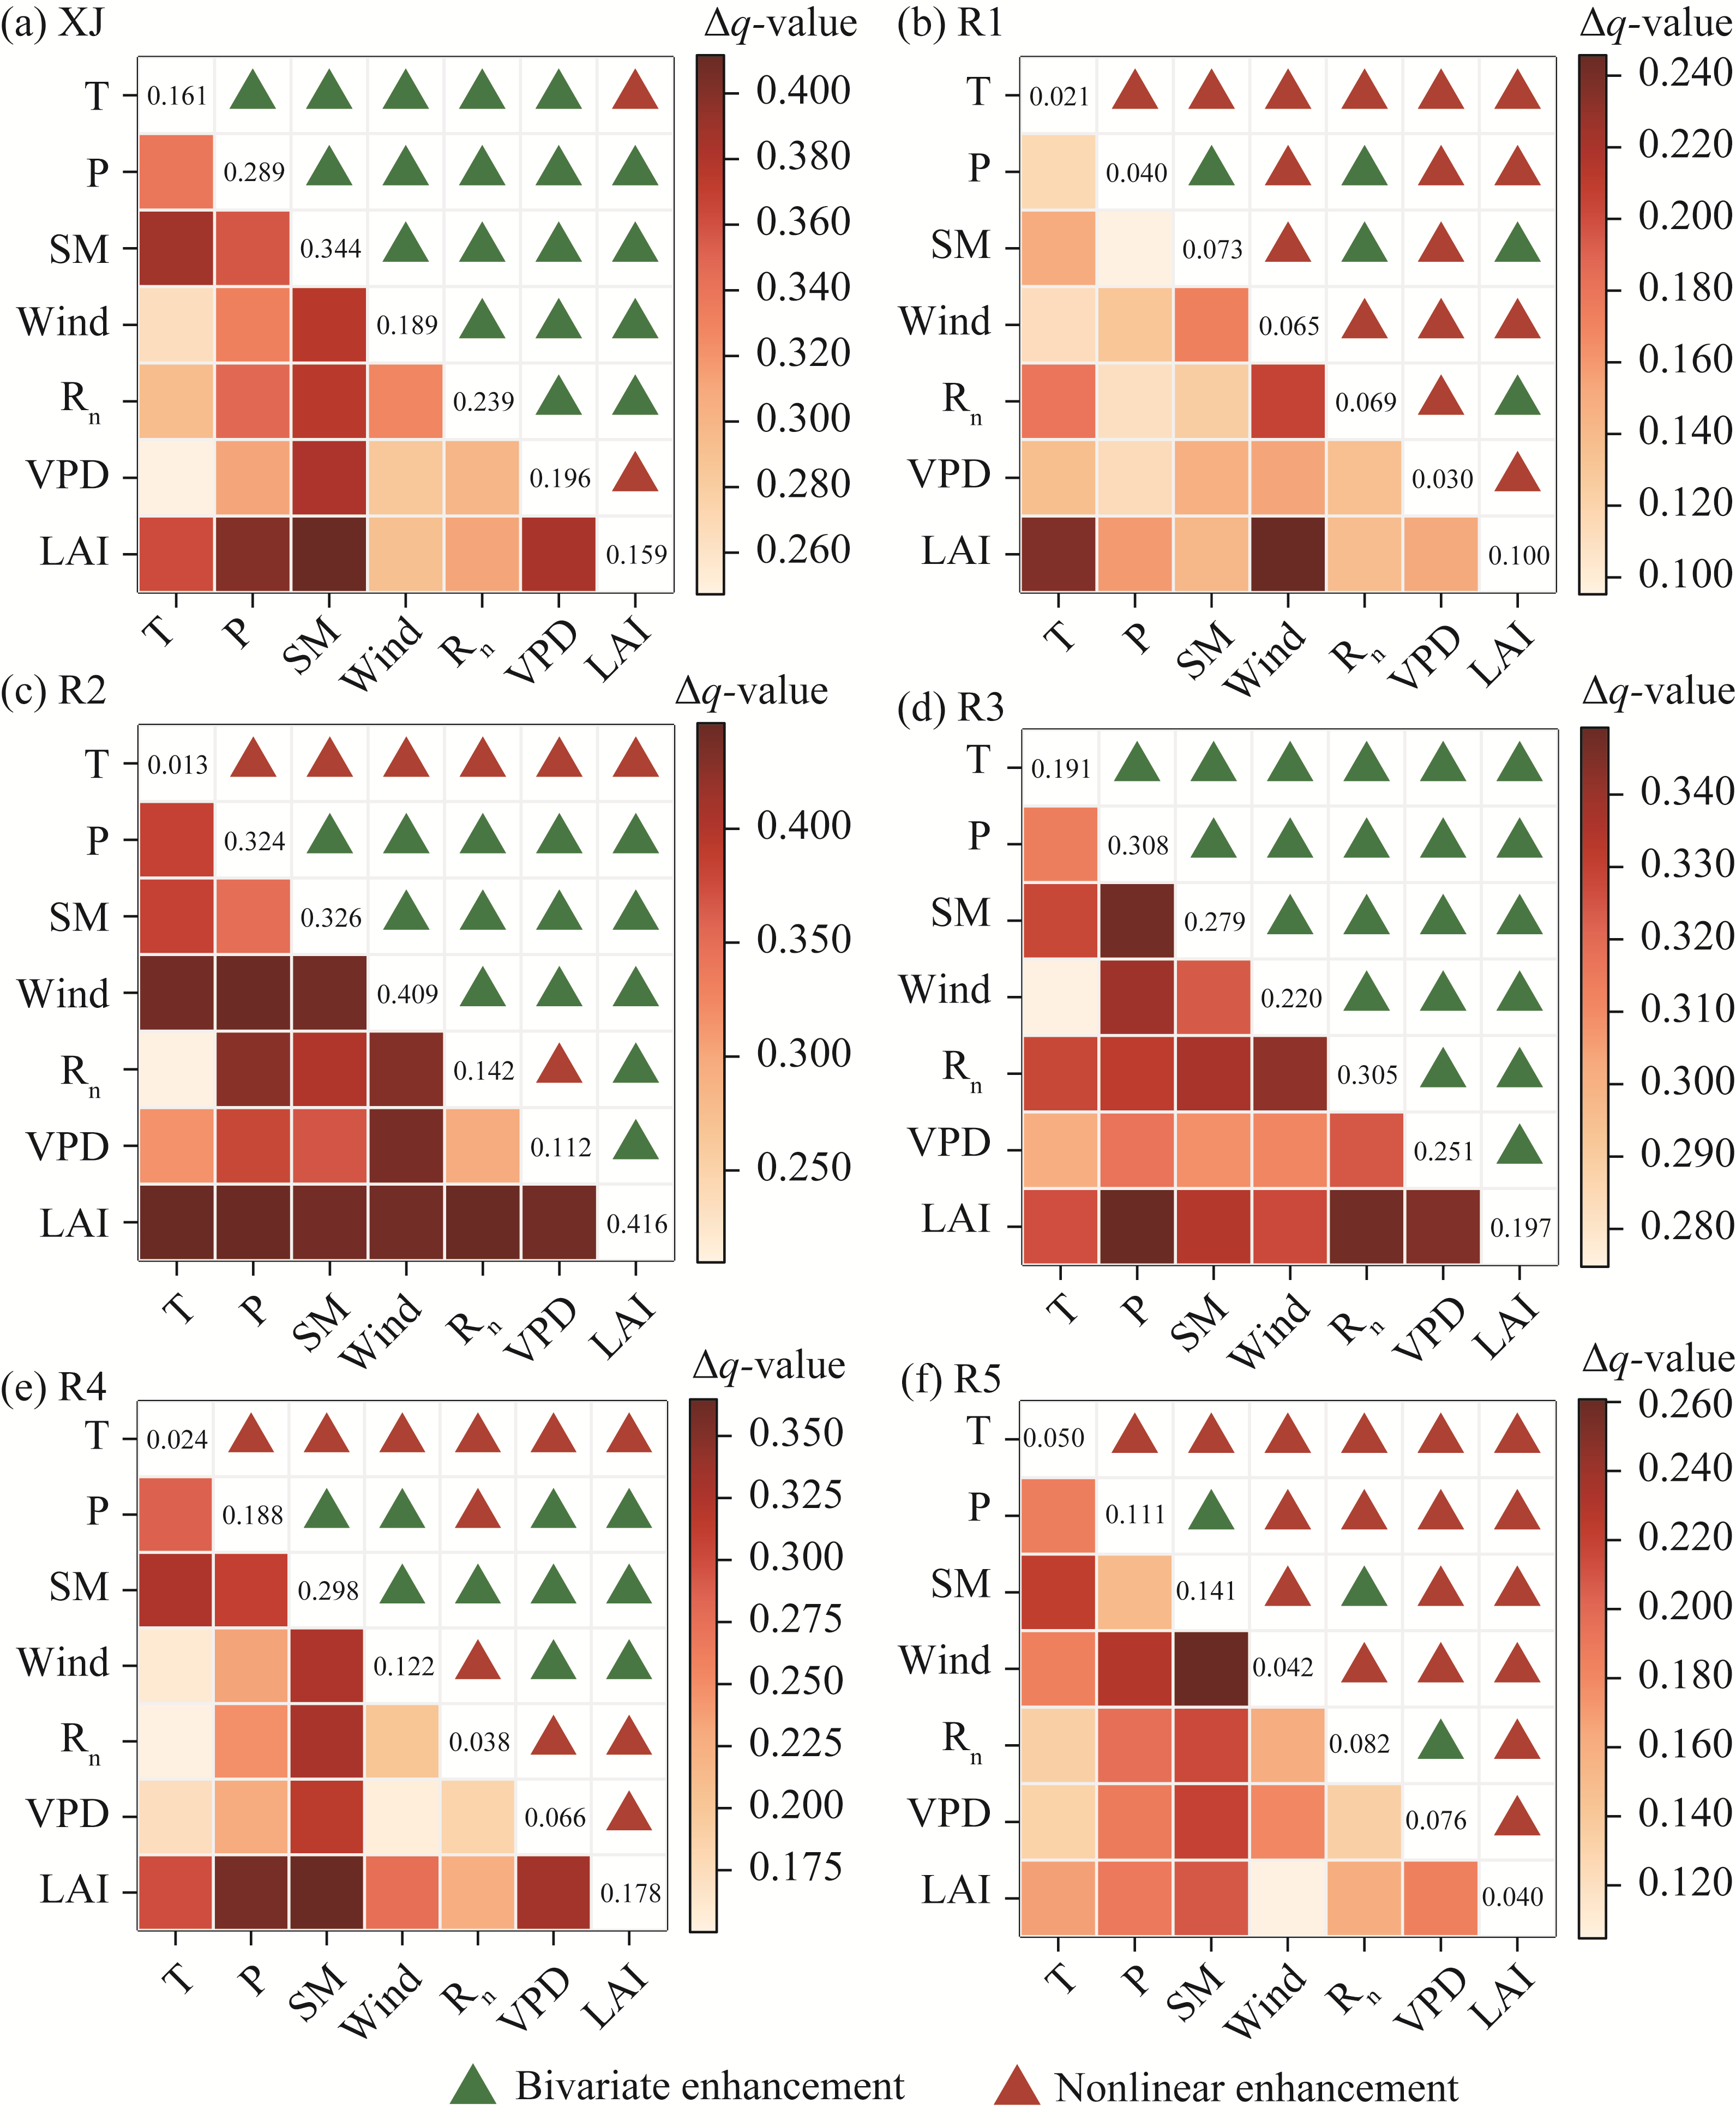
Fig. 7Interaction strength and type between ETa drivers in XJ (a) and its five ecozones (b-f) during 2001-2022
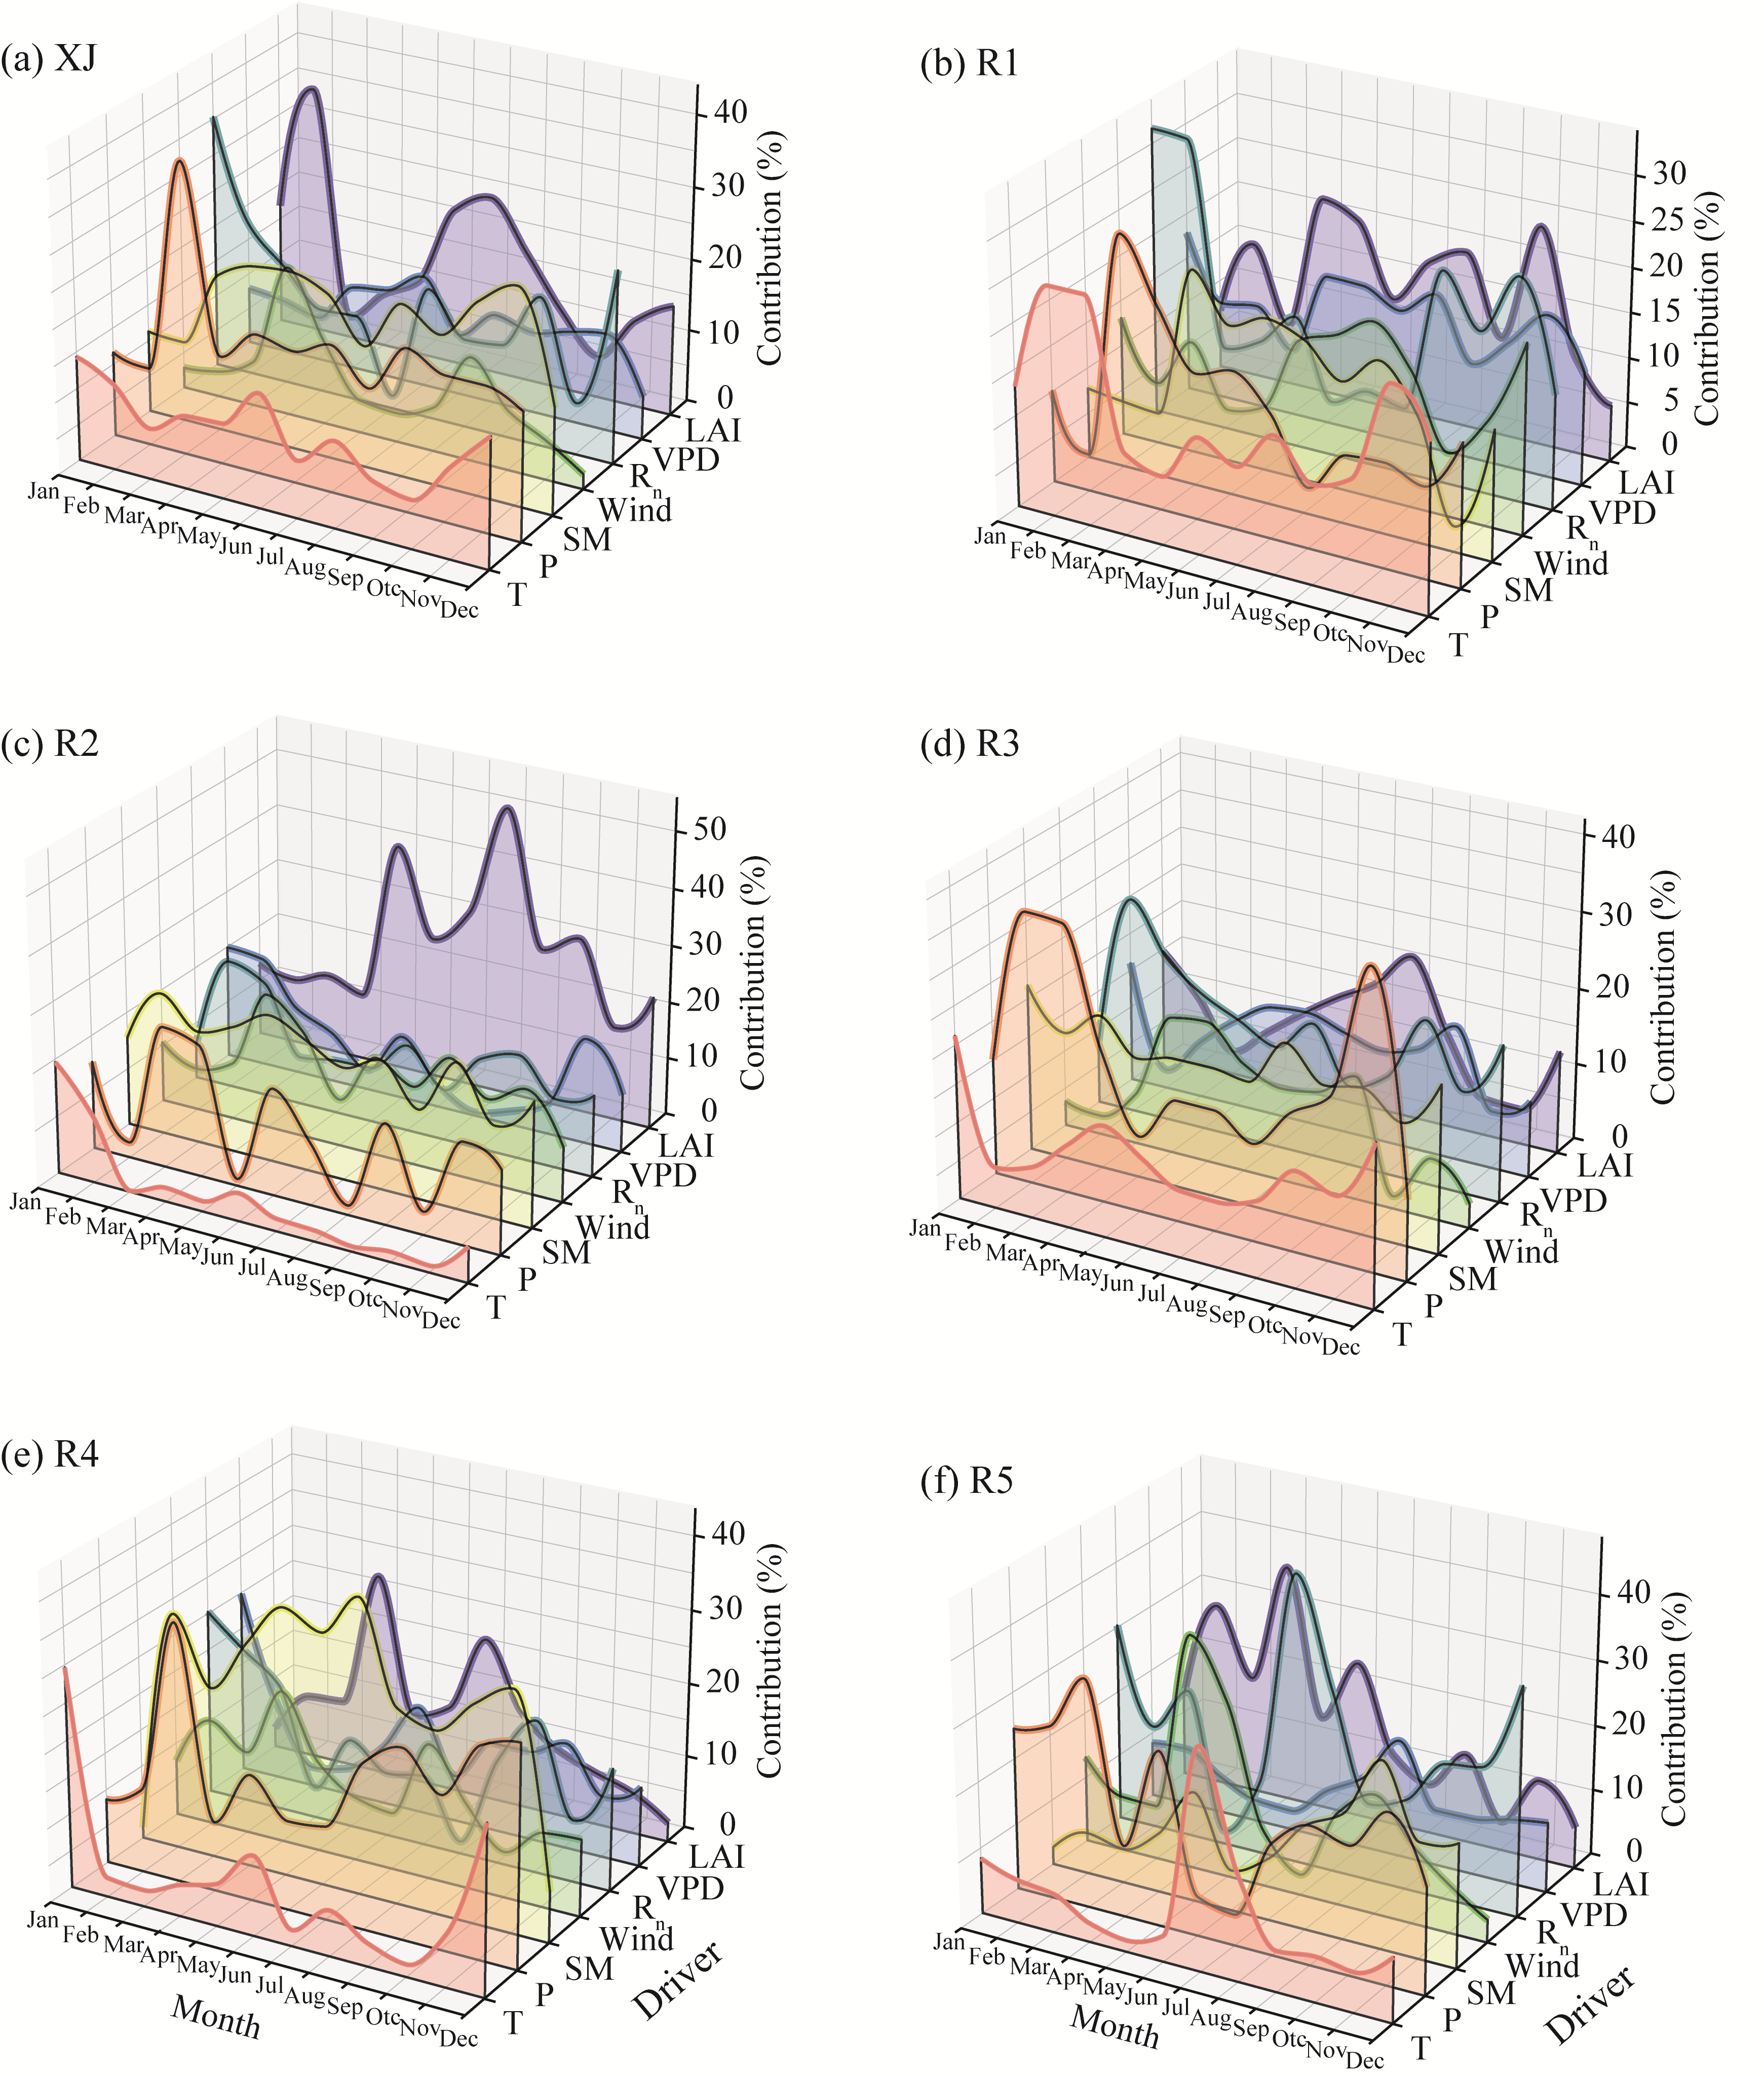
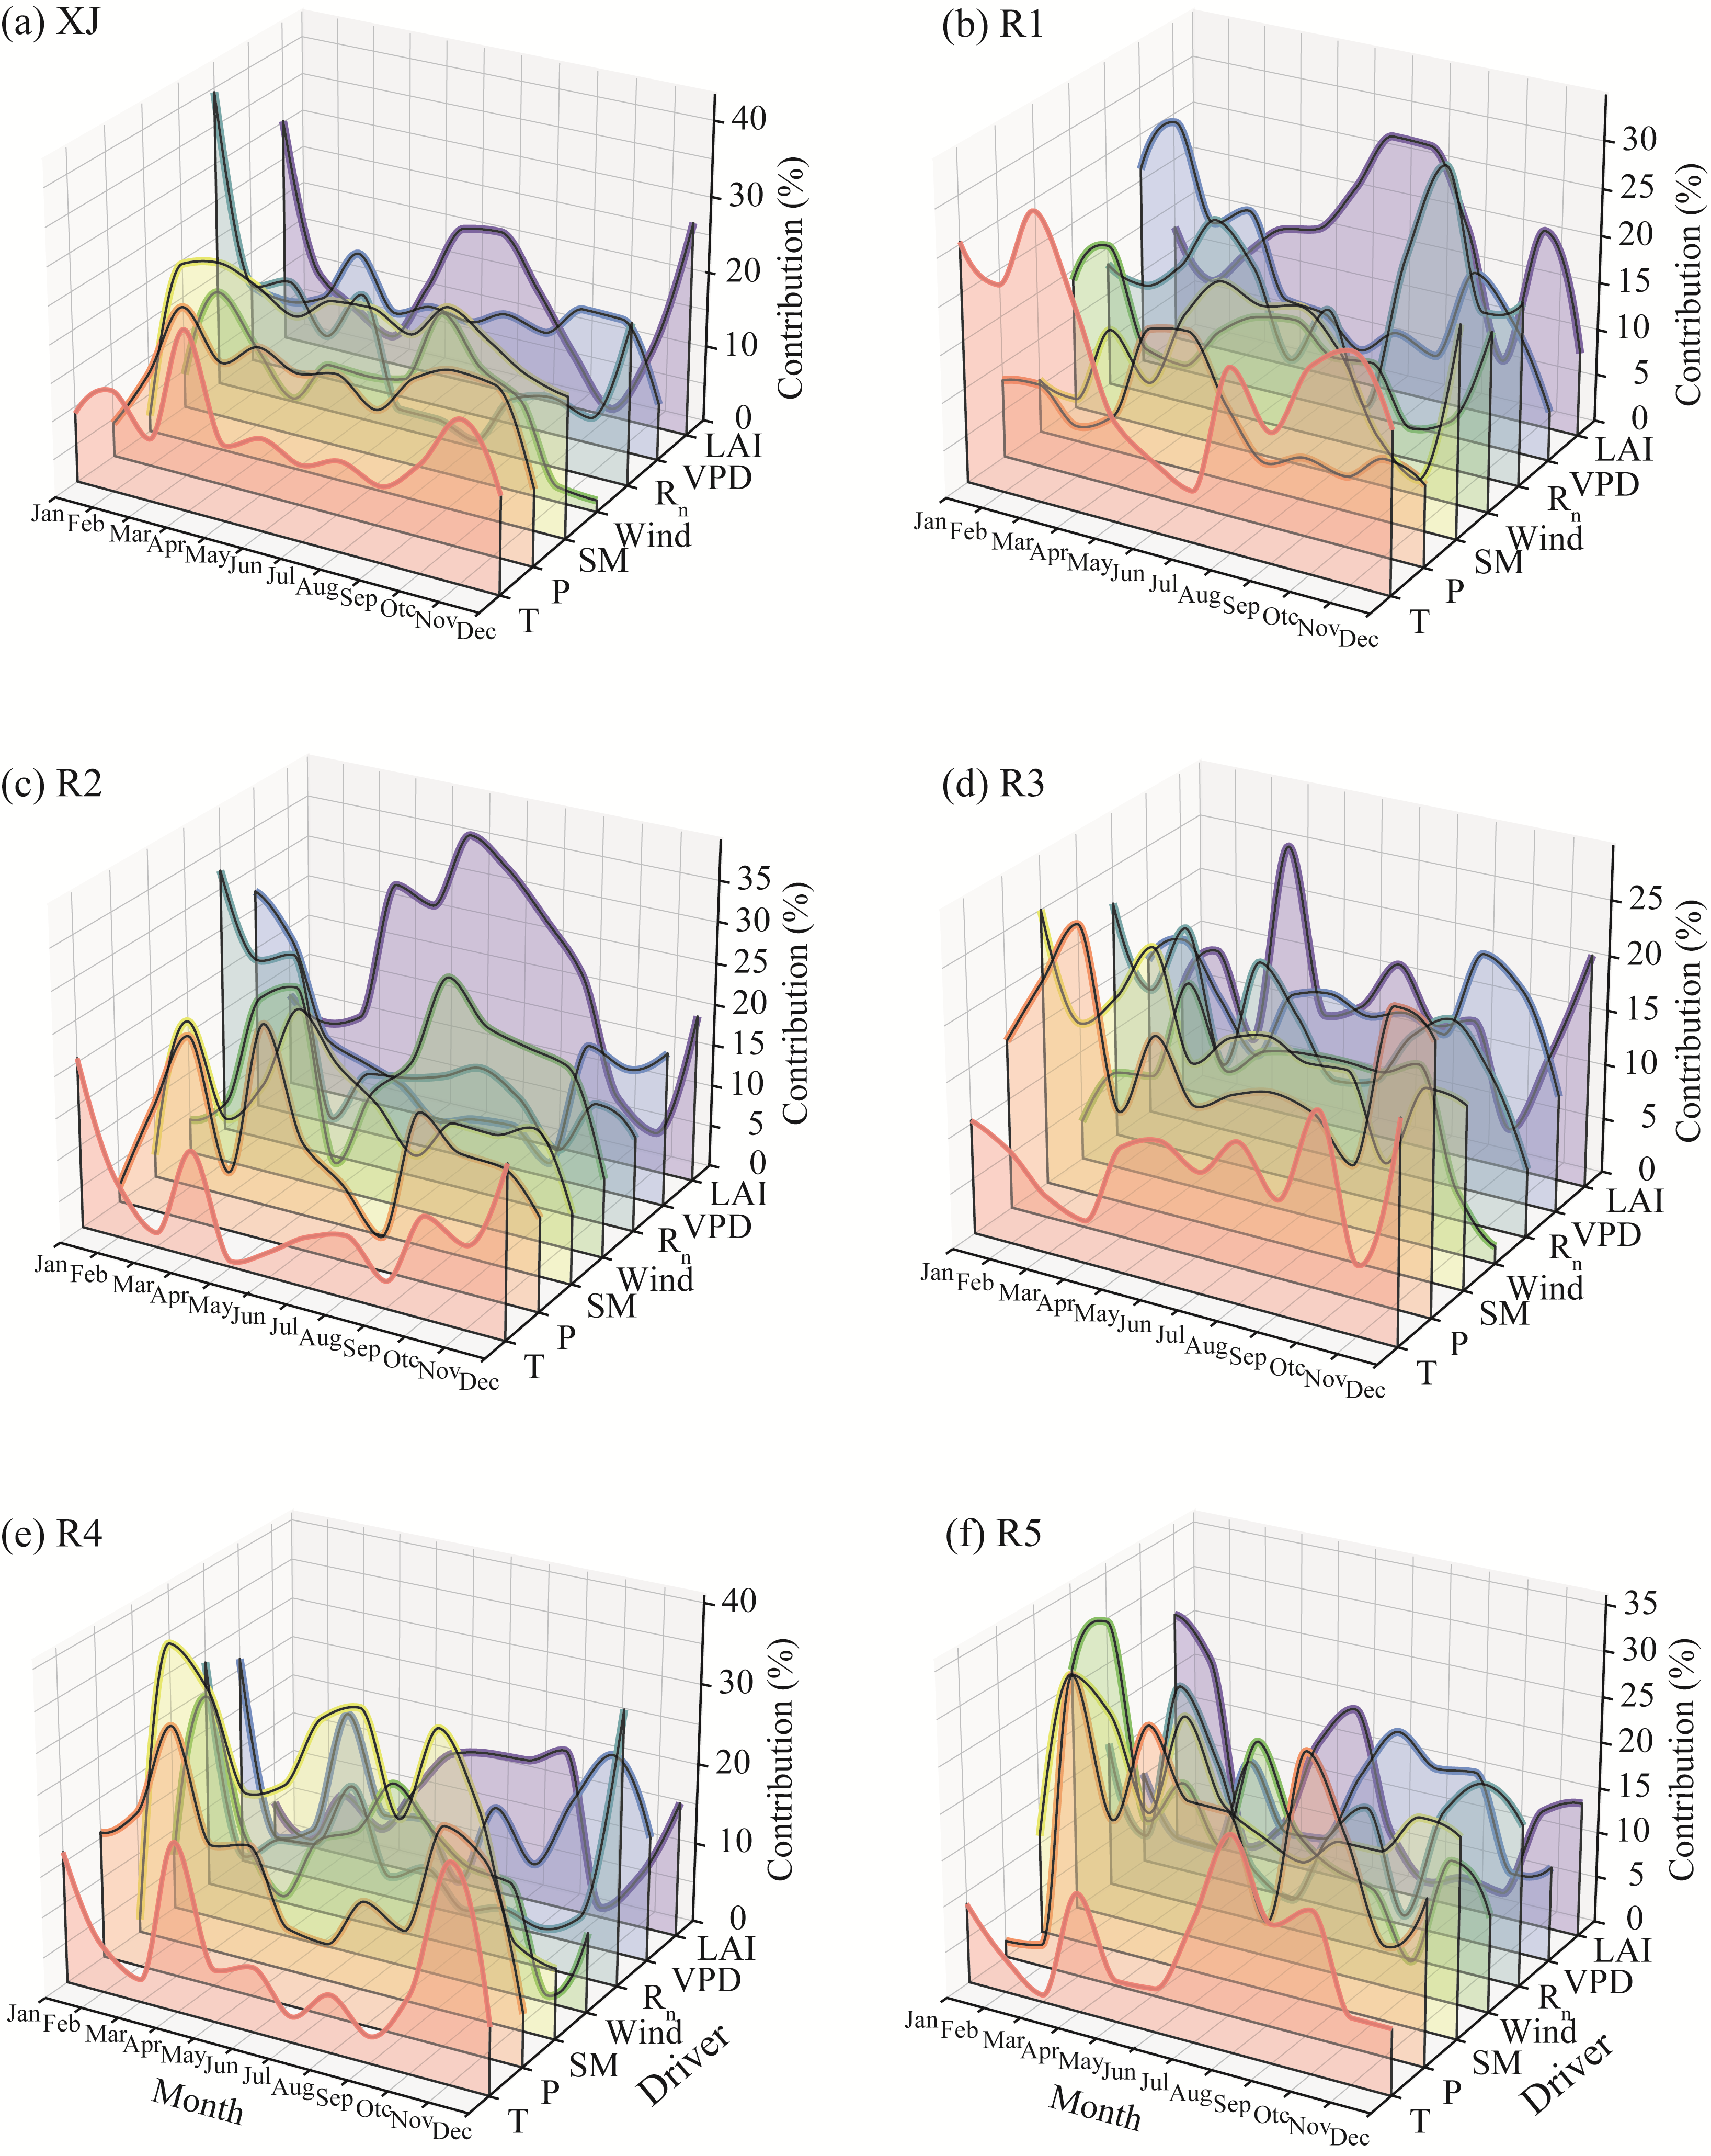
Fig. 8Contributions of GeoDetector to intra-annual ETa drivers for XJ (a) and its five ecozones (b-f) in 2003 (the wet year)
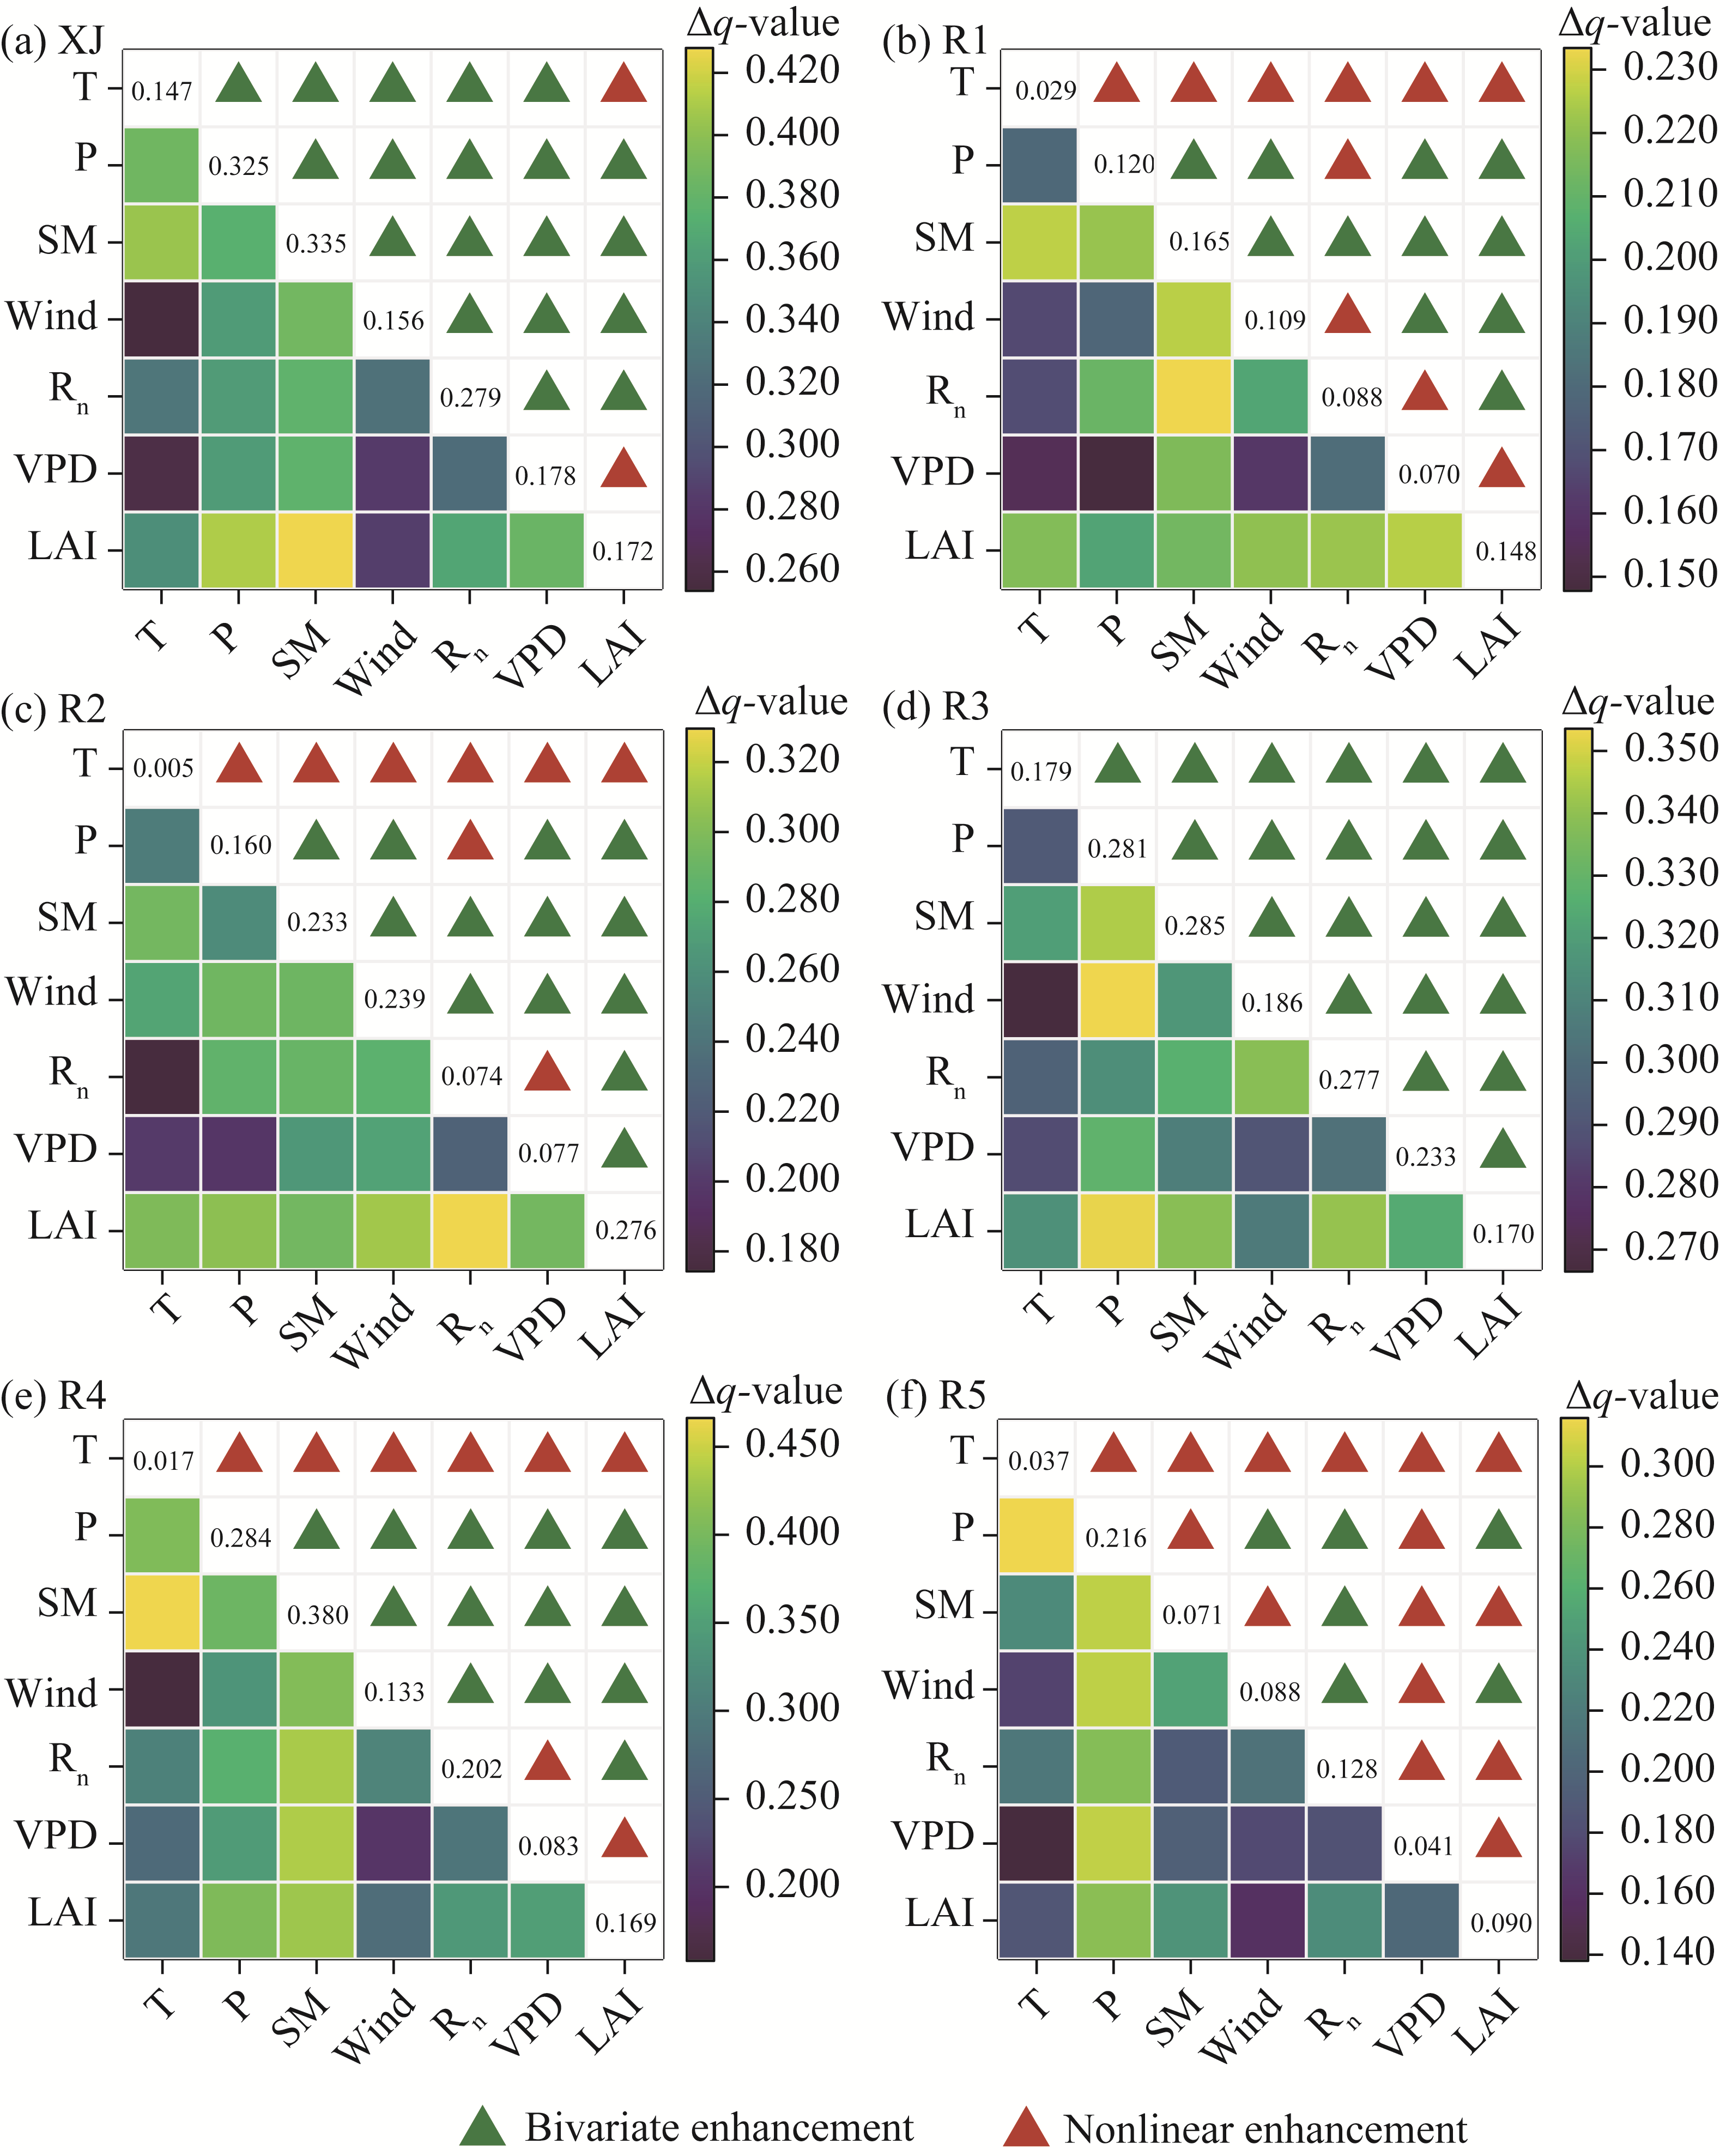
Fig. 9Interaction strength and type between ETa driver in XJ (a) and its five ecozones (b-f) in 2003 (the wet year)
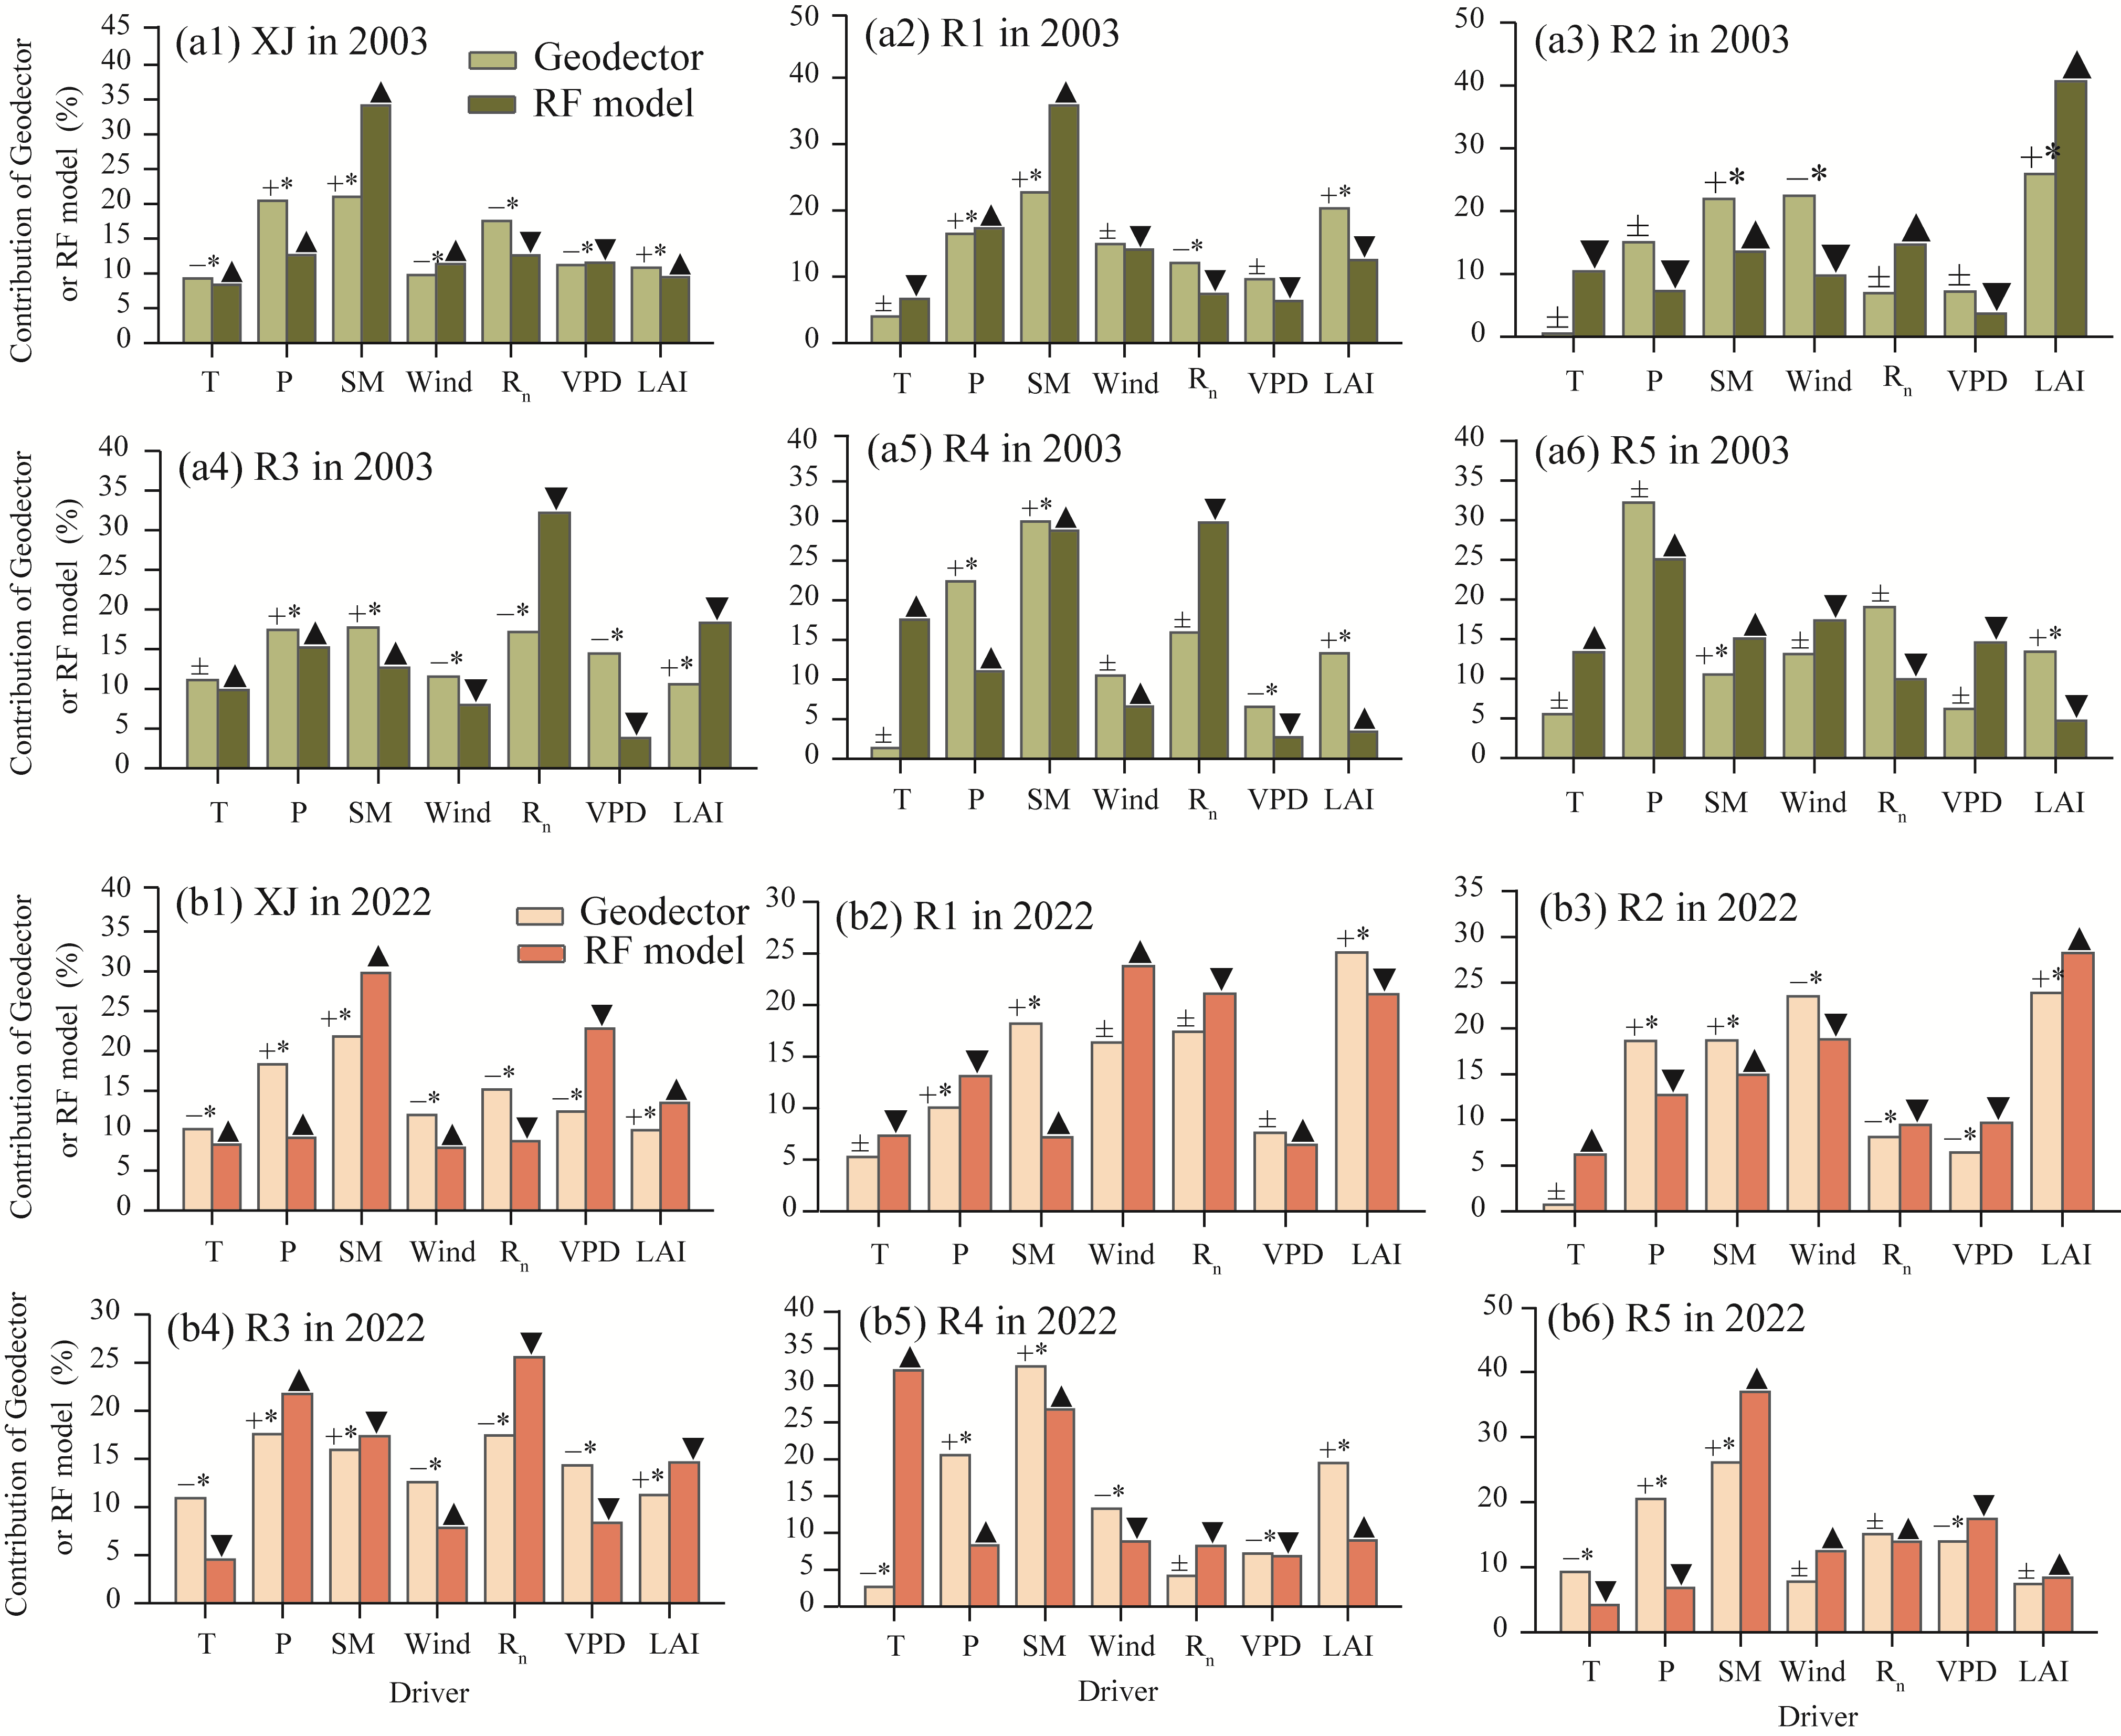
Fig. 10Comparison of the contribution of GeoDetector and Random Forest (RF) models to ETa drivers for XJ (a1 and b1) and its five ecozones (a2-a6 and b2-b6) in 2003 (the wet year) and 2022 (the dry year). +, positive association; -, negative association; ±, no significant directional association; *, P<0.05 level; ▲, positive accumulated local effect (ALE); ▼, negative ALE.
Region and ecozone
Period
No. of model
R2val
R2OOB
Average sample size
XJ
Annual (2003-2022)
20
0.779±0.052
0.781±0.051
100,000
Monthly (2003, 2022)
24
0.790±0.072
0.792±0.075
100,000
R1 (Altay Mountains)
Annual (2003-2022)
20
0.898±0.013
0.888±0.014
100,000
Monthly (2003, 2022)
24
0.868±0.105
0.860±0.097
100,000
R2 (Junggar Basin)
Annual (2003-2022)
20
0.868±0.022
0.890±0.018
100,000
Monthly (2003, 2022)
24
0.870±0.057
0.878±0.056
100,000
R3 (Tianshan Mountains)
Annual (2003-2022)
20
0.868±0.039
0.872±0.039
100,000
Monthly (2003, 2022)
24
0.865±0.050
0.860±0.049
100,000
R4 (Tarim Basin)
Annual (2003-2022)
20
0.708±0.049
0.700±0.050
100,000
Monthly (2003, 2022)
24
0.765±0.113
0.767±0.105
100,000
R5 (Kunlun Mountains)
Annual (2003-2022)
20
0.763±0.078
0.761±0.081
100,000
Monthly (2003, 2022)
24
0.786±0.106
0.786±0.106
100,000
Table S1 Predictive performance metrics of Random Forest (RF) model for actual evaporation (ETa) across Xinjiang (XJ) and its five ecozones (R1-R5)
Fig. S1Contribution of permutation importance (PI) from Random Forest (RF) model to actual evaporation (ETa) drivers for Xinjiang (XJ; a) and its ecozones (b-f) during 2001-2022. P, precipitation; SM, soil moisture; Rn, net radiation; T, temperature; LAI, leaf area index; VPD, vapor pressure deficit.
Region and ecozone
ρ
ALE vs. risk-detector
XJ
0.54 [0.36, 0.71]
71 [57, 71]
R1
0.64 [0.51, 0.75]
67 [60, 75]
R2
0.45 [0.37, 0.71]
80 [76, 100]
R3
0.48 [0.37, 0.71]
69 [67, 83]
R4
0.41 [0.29, 0.54]
83 [67, 96]
R5
0.43 [0.29, 0.53]
75 [53, 79]
Table S2 Consistency between RF and GeoDetector for ETa drivers across XJ and its five ecozones during 2001-2022
Fig. S2Contributions of GeoDetector to intra-annual ETa drivers for XJ (a) and its five ecozones (b-f) in 2022 (the dry year)
Fig. S3Pairwise interactions between ETa drivers in XJ (a) and its five ecozones (b-f) in 2022 (the dry year)
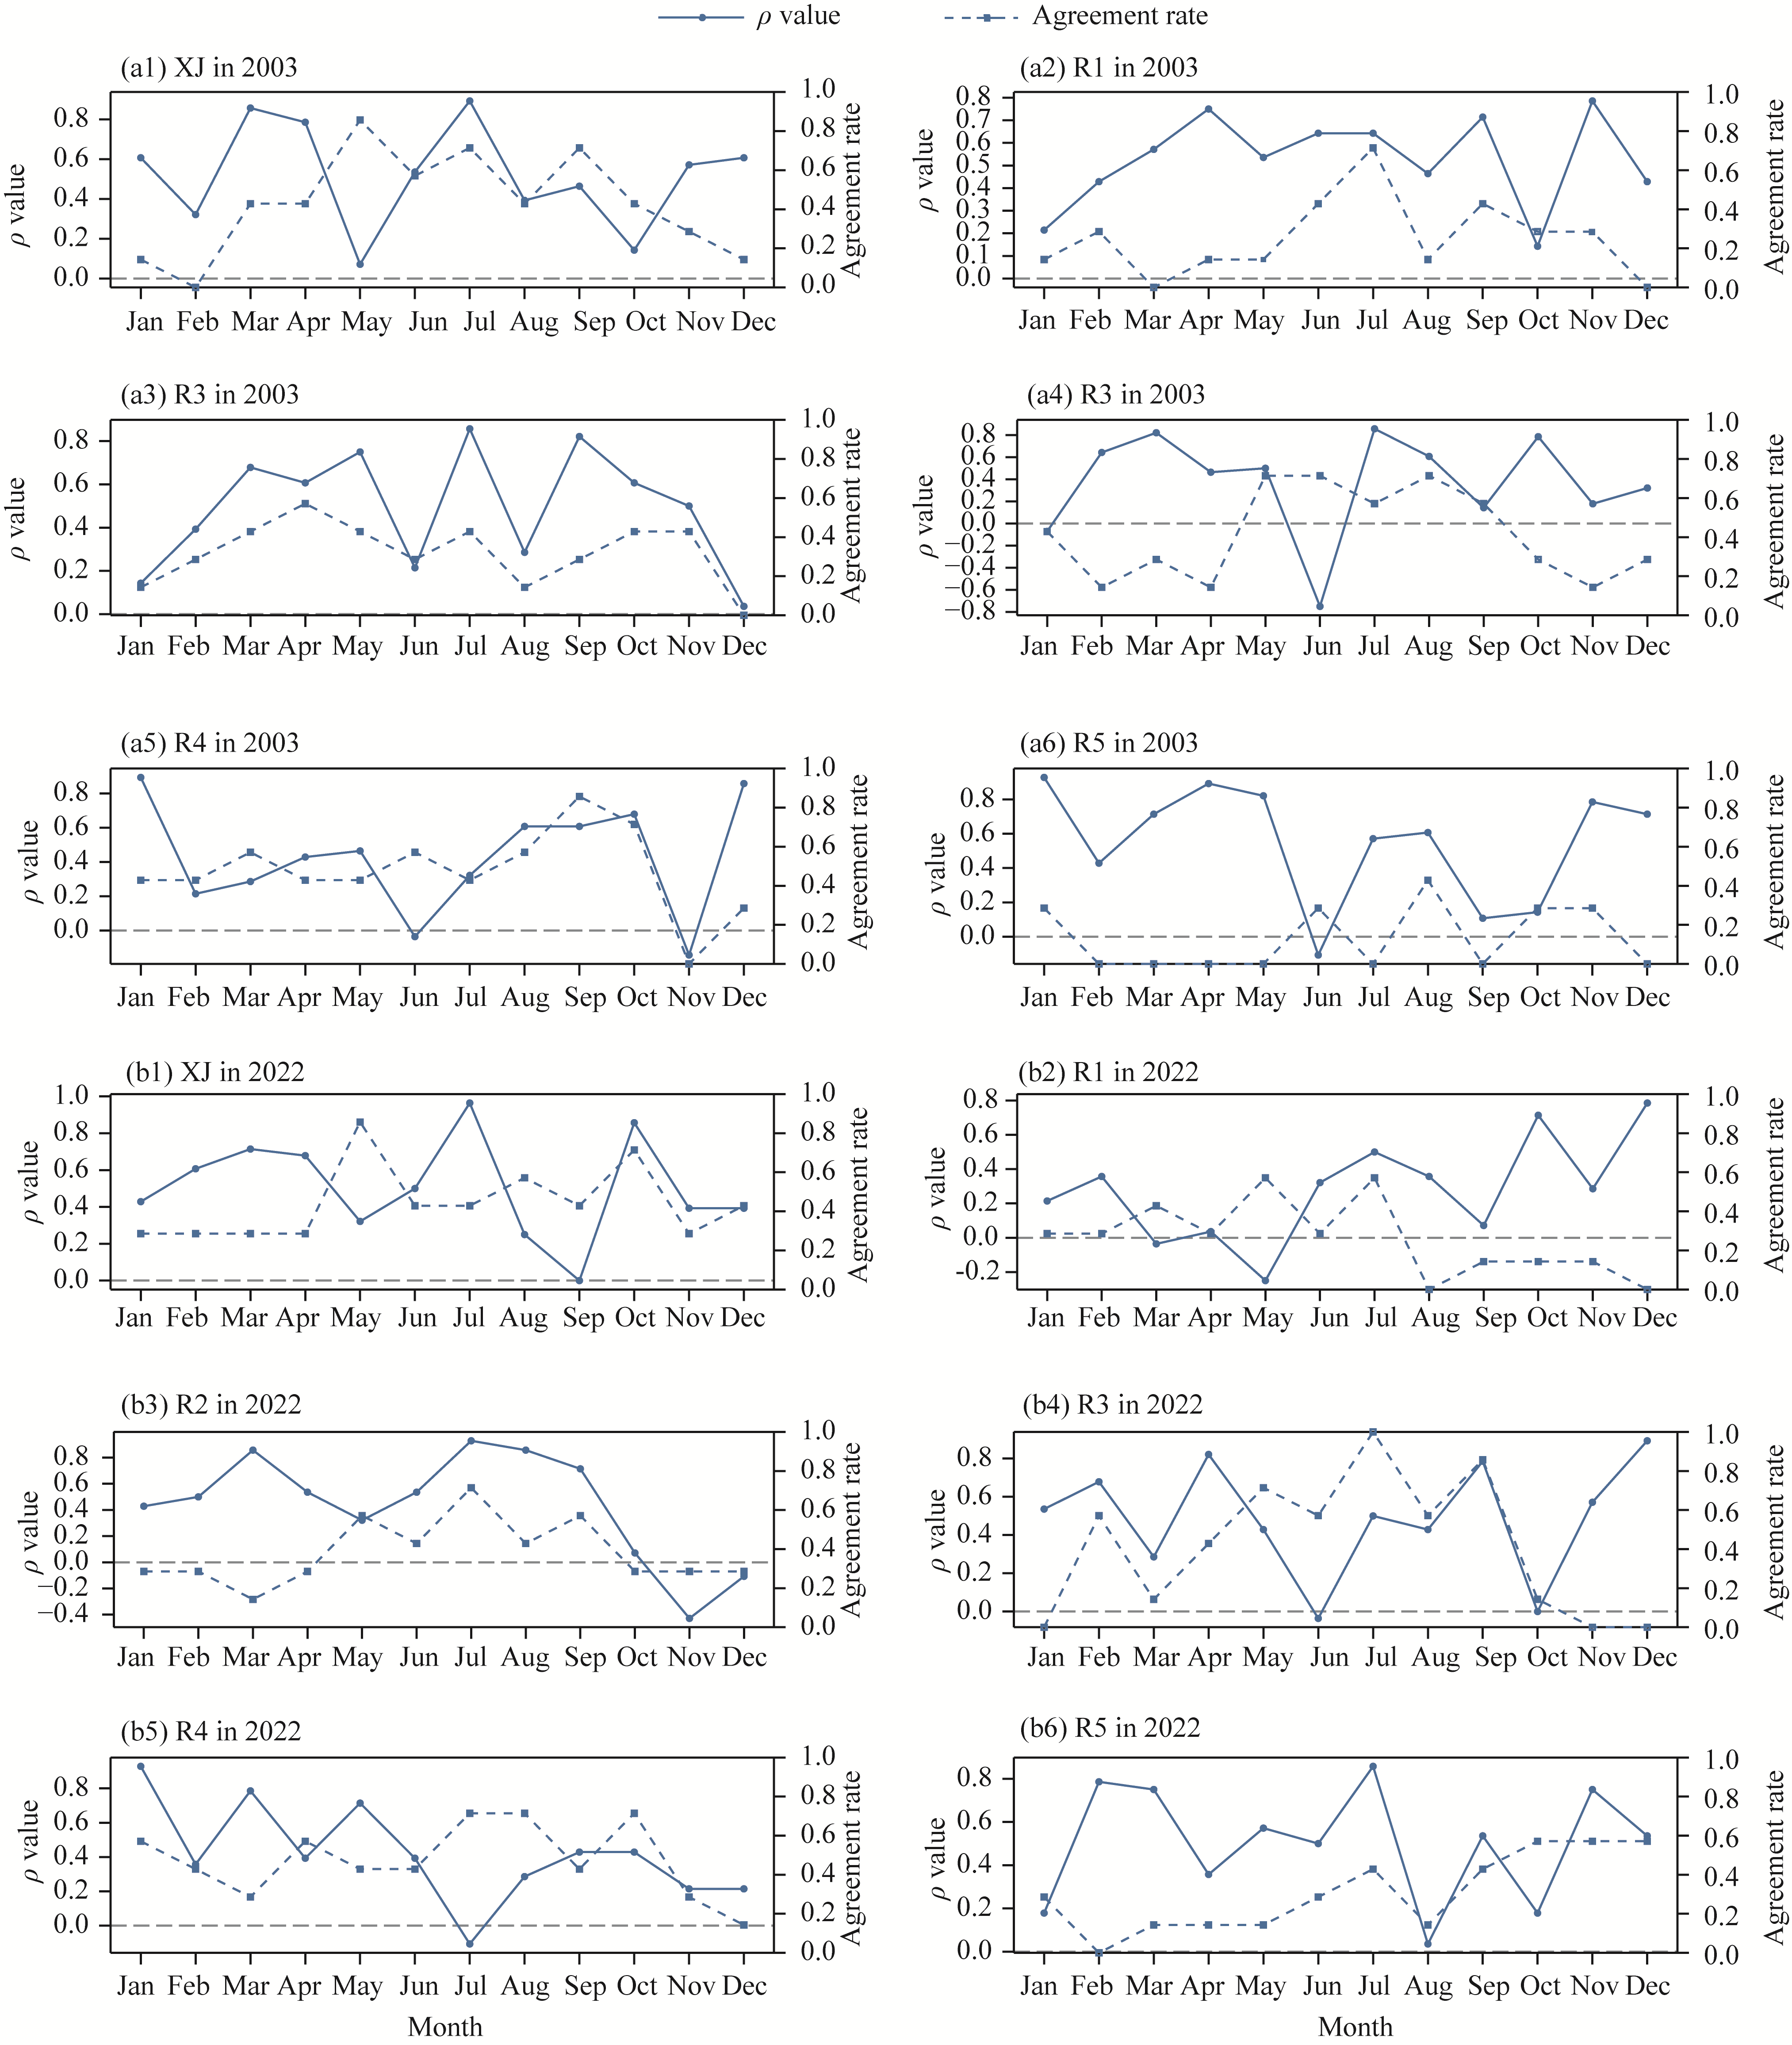
Fig. S4Consistency between GeoDetector and RF model in the strength (ρ; Spearman's rank correlation) and direction (agreement rate) of monthly ETa drivers for XJ (a1 and b1) and its five ecozones (a2-a6 and b2-b6) in 2003 (the wet year) and 2022 (the dry year)
[1]
Abdel-Fattah M K, Kotb Abd-Elmabod S, Zhang Z H, et al. 2023. Exploring the applicability of regression models and artificial neural networks for calculating reference evapotranspiration in arid regions. Sustainability, 15(21): 15494, doi: 10.3390/su152115494.
[2]
Belgiu M, Drăguţ L. 2016. Random forest in remote sensing: A review of applications and future directions. ISPRS Journal of Photogrammetry and Remote Sensing, 114: 24-31.
doi: 10.1016/j.isprsjprs.2016.01.011
[3]
Bhardwaj K, Mishra A, Khedun C P. 2025. Global droughts in a warming climate: Evaluation of SPI and SPEI under 1.5°, 2°, and 3°C global warming. Journal of Hydrology, 659: 133309, doi: 10.1016/j.jhydrol.2025.133309.
[4]
Breiman L. 2001. Random forests. Machine Learning, 45(1): 5-32.
doi: 10.1023/A:1010933404324
[5]
Cai X R, Li Z Q, Zhang H, et al. 2021. Vulnerability of glacier change in the Tianshan Mountains region of China. Journal of Geographical Sciences, 31(10): 1469-1489.
doi: 10.1007/s11442-021-1907-z
[6]
Chen H T, Chu N S, Kang A Q, et al. 2025. Simulation and analysis of evapotranspiration from desert grasslands based on a random forest regression model. Scientific Reports, 15(1): 25760, doi: 10.1038/s41598-025-11056-0.
[7]
Chen R, Duan K Q, Shi P H, et al. 2024. Amplification of warming-wetting in high mountains and associated mechanisms during the 21stcentury in Xinjiang, Central Asia. Climatic Change, 177(12): 177, doi: 10.1007/s10584-024-03834-y.
[8]
Chen S, Gan T Y, Tan X Z, et al. 2019. Assessment of CFSR, ERA-Interim, JRA-55, MERRA-2, NCEP-2 reanalysis data for drought analysis over China. Climate Dynamics, 53(1): 737-757.
doi: 10.1007/s00382-018-04611-1
[9]
Denissen J M C, Teuling A J, Pitman A J, et al. 2022. Widespread shift from ecosystem energy to water limitation with climate change. Nature Climate Change, 12(7): 677-684.
doi: 10.1038/s41558-022-01403-8
[10]
Di C L, Wang T J, Han Q, et al. 2023. Complexity and predictability of daily actual evapotranspiration across climate regimes. Water Resources Research, 59(4): e2022WR032811, doi: 10.1029/2022WR032811.
[11]
Elnashar A, Wang L J, Wu B F, et al. 2021. Synthesis of global actual evapotranspiration from 1982 to 2019. Earth System Science Data, 13(2): 447-480.
doi: 10.5194/essd-13-447-2021
[12]
Farr T G, Rosen P A, Caro E, et al. 2007. The shuttle radar topography mission. Reviews of Geophysics, 45(2): 2005RG000183, doi: 10.1029/2005RG000183.
[13]
Gan R, Zhang Y Q, Shi H, et al. 2018. Use of satellite leaf area index estimating evapotranspiration and gross assimilation for Australian ecosystems. Ecohydrology, 11(5): e1974, doi: 10.1002/eco.1974.
[14]
Gao Q Z, Wan Y F, Xu H M, et al. 2010. Alpine grassland degradation index and its response to recent climate variability in Northern Tibet, China. Quaternary International, 226(1-2): 143-150.
doi: 10.1016/j.quaint.2009.10.035
[15]
Gentine P, Green J K, Guérin M, et al. 2019. Coupling between the terrestrial carbon and water cycles—a review. Environmental Research Letters, 14(8): 083003, doi: 10.1088/1748-9326/ab22d6.
[16]
Gu C J, Tang Q H, Zhu G F, et al. 2021. Discrepant responses between evapotranspiration- and transpiration-based ecosystem water use efficiency to interannual precipitation fluctuations. Agricultural and Forest Meteorology, 303: 108385, doi: 10.1016/j.agrformet.2021.108385.
[17]
Hissan R U, Parveen N. 2025. Predicting long-term meteorological drought using random forest and multi-scale drought indices. Theoretical and Applied Climatology, 156(10): 552, doi: 10.1007/s00704-025-05784-6.
[18]
Hoek van Dijke A J, Mallick K, Schlerf M, et al. 2020. Examining the link between vegetation leaf area and land-atmosphere exchange of water, energy, and carbon fluxes using FLUXNET data. Biogeosciences, 17(17): 4443-4457.
doi: 10.5194/bg-17-4443-2020
[19]
Hong S, Deng H J, Zheng Z Y, et al. 2023. The influence of variations in actual evapotranspiration on drought in China's Southeast River basin. Scientific Reports, 13(1): 21336, doi: 10.1038/s41598-023-48663-8.
[20]
Huang J P, Yu H P, Guan X D, et al. 2016. Accelerated dryland expansion under climate change. Nature Climate Change, 6(2): 166-171.
doi: 10.1038/NCLIMATE2837
[21]
Huss M, Hock R. 2018. Global-scale hydrological response to future glacier mass loss. Nature Climate Change, 8(2): 135-140.
doi: 10.1038/s41558-017-0049-x
[22]
Jaramillo F, Destouni G. 2015. Local flow regulation and irrigation raise global human water consumption and footprint. Science, 350(6265): 1248-1251.
doi: 10.1126/science.aad1010
pmid: 26785489
[23]
Jiang Q, Li W Y, Fan Z D, et al. 2021. Evaluation of the ERA 5 reanalysis precipitation dataset over Chinese Mainland. Journal of Hydrology, 595: 125660, doi: 10.1016/j.jhydrol.2020.125660.
[24]
Jie H X, Liu K, Wang S J, et al. 2026. Contribution of oasis evapotranspiration to precipitation in arid Central Asia: Quantifying moisture recycling of mountain-oasis-desert systems. Journal of Hydrology, 664: 134624, doi: 10.1016/j.jhydrol.2025.134624.
[25]
Jin H Y, Zhang k, Huang Y M, et al. 2025. Spatiotemporal evolution patterns of global actual evapotranspiration and its influencing factors. Journal of Geophysical Research: Atmospheres, 130(10): e2024JD042515, doi: 10.1029/2024JD042515.
[26]
Jung M, Reichstein M, Ciais P, et al. 2010. Recent decline in the global land evapotranspiration trend due to limited moisture supply. Nature, 467(7318): 951-954.
doi: 10.1038/nature09396
[27]
Kanji S, Das S. 2025. Assessing predictability of spatio-temporal soil-moisture heterogeneity with satellite-data using GeoDetector and ensemble machine learning models considering environmental and climatic factors. Journal of Hydrology, 663: 134312, doi: 10.1016/j.jhydrol.2025.134312.
[28]
Kartik N, Mahalakshmi R, Venkatesh K A. 2023. XAI-based student performance prediction: Peeling back the layers of LSTM and Random Forest's black boxes. SN Computer Science, 4(5): 699, doi: 10.1007/s42979-023-02070-y.
[29]
Li B F, Chen Y N, Shi X. 2012. Why does the temperature rise faster in the arid region of northwest China? Journal of Geophysical Research: Atmospheres, 117(D16): D16115, doi: 10.1029/2012JD017953.
[30]
Li F, Xiao J F, Chen J Q, et al. 2023. Global water use efficiency saturation due to increased vapor pressure deficit. Science, 381(6658): 672-677.
doi: 10.1126/science.adf5041
pmid: 37561856
[31]
Li Z Q, Lau W K, Ramanathan V, et al. 2016. Aerosol and monsoon climate interactions over Asia. Reviews of Geophysics, 54(4): 866-929.
doi: 10.1002/rog.v54.4
[32]
Liang Y T, Xu C D. 2023. Knowledge diffusion of Geodetector: A perspective of the literature review and Geotree. Heliyon, 9(9): e19651, doi: 10.1016/j.heliyon.2023.e19651.
[33]
Liu Y, Li L H, Chen X, et al. 2018. Temporal-spatial variations and influencing factors of vegetation cover in Xinjiang from 1982 to 2013 based on GIMMS-NDVI3g. Global and Planetary Change, 169: 145-155.
doi: 10.1016/j.gloplacha.2018.06.005
[34]
Liu Y C, Li Z, Chen Y N, et al. 2025. Global greening drives significant soil moisture loss. Communications Earth & Environment, 6(1): 600, doi: 10.1038/s43247-025-02470-3.
[35]
Liu Z F. 2022. Causes of changes in actual evapotranspiration and terrestrial water storage over the Eurasian inland basins. Hydrological Processes, 36(1): e14482, doi: 10.1002/hyp.14482.
[36]
Liu Z Y, Cheng L Y, Zhou G Y, et al. 2020. Global response of evapotranspiration ratio to climate conditions and watershed characteristics in a changing environment. Journal of Geophysical Research: Atmospheres, 125(7): e2020JD032371, doi: 10.1029/2020JD032371.
[37]
Ma N, Zhang Y Q. 2022. Increasing Tibetan Plateau terrestrial evapotranspiration primarily driven by precipitation. Agricultural and Forest Meteorology, 317: 108887, doi: 10.1016/j.agrformet.2022.108887.
[38]
McVicar T R, Roderick M L, Donohue R J, et al. 2012. Less bluster ahead? Ecohydrological implications of global trends of terrestrial near-surface wind speeds. Ecohydrology, 5(4): 1298, doi: 10.1002/eco.1298.
[39]
Mohammad L, Ahmed M, Dewan A, et al. 2022. Assessment of spatio-temporal trends of satellite-based aerosol optical depth using Mann-Kendall test and Sen's slope estimator model. Geomatics, Natural Hazards and Risk, 13(1): 1270-1298.
doi: 10.1080/19475705.2022.2070552
[40]
Muñoz-Sabater J, Dutra E, Agustí-Panareda A, et al. 2021. ERA5-Land: A state-of-the-art global reanalysis dataset for land applications. Earth System Science Data, 13: 4349-4383.
doi: 10.5194/essd-13-4349-2021
[41]
Mutti P R, Dubreuil V, Hamada E, et al. 2019. Basin scale rainfall-evapotranspiration dynamics in a tropical semiarid environment during dry and wet years. International Journal of Applied Earth Observation and Geoinformation, 75: 29-43.
doi: 10.1016/j.jag.2018.10.007
[42]
Nemani R R, Keeling C D, Hashimoto H, et al. 2003. Climate-driven increases in global terrestrial net primary production from 1982 to 1999. Science, 300(5625): 1560-1563.
pmid: 12791990
[43]
Nordling K, Fahrenbach N L S, Samset B H. 2025. Climate variability can outweigh the influence of climate mean changes for extreme precipitation under global warming. Atmospheric Chemistry Physics, 25(3): 1659-1684.
doi: 10.5194/acp-25-1659-2025
[44]
Novick K A, Ficklin D L, Stoy P C, et al. 2016. The increasing importance of atmospheric demand for ecosystem water and carbon fluxes. Nature Climate Change, 6(11): 1023-1027.
doi: 10.1038/nclimate3114
[45]
Ohana-Levi N, Ben-Gal A, Munitz S, et al. 2022. Grapevine crop evapotranspiration and crop coefficient forecasting using linear and non-linear multiple regression models. Agricultural Water Management, 262: 107317, doi: 10.1016/j.agwat.2021.107317.
[46]
Piao S L, Wang X H, Park T, et al. 2020. Characteristics, drivers and feedbacks of global greening. Nature Reviews Earth & Environment, 1(1): 14-27.
[47]
Rajput J, Mishra S, Choudhary A, et al. 2024. Data-driven reference evapotranspiration (ET0) estimation: A comparative study of regression and machine learning techniques. Environment, Development and Sustainability, 26(5): 12679-12706.
doi: 10.1007/s10668-023-03978-4
[48]
Rasouli Majd N, Montaseri M, Amirataee B. 2025. Stochastic evaluation of the effect of cross-correlation between precipitation and evapotranspiration on SPEI performance. Journal of Hydrology, 652: 132650, doi: 10.1016/j.jhydrol.2024.132650.
[49]
Reichstein M, Camps-Valls G, Stevens B, et al. 2019. Deep learning and process understanding for data-driven Earth system science. Nature, 566(7743): 195-204.
doi: 10.1038/s41586-019-0912-1
[50]
Rotenberg E, Tatarinov F, Muller J D, et al. 2025. Evapotranspiration saturation amplifies climate sensitivity of terrestrial water yield. Nature Communications, 16: 11577, doi: 10.1038/s41467-025-66570-6.
[51]
Schuster L, Maussion F, Rounce D R, et al. 2025. Irreversible glacier change and trough water for centuries after overshooting 1.5°C. Nature Climate Change, 15(6): 634-641.
doi: 10.1038/s41558-025-02318-w
pmid: 40520442
[52]
Shi X, She D, Xia J, et al. 2024. The intercomparison of six 0.1°×0.1° spatial resolution evapotranspiration products across mainland China. Journal of Hydrology, 633: 130949, doi: 10.1016/j.jhydrol.2024.130949.
[53]
Song Y Z, Wang J F, Ge Y, et al. 2020. An optimal parameters-based geographical detector model enhances geographic characteristics of explanatory variables for spatial heterogeneity analysis: Cases with different types of spatial data. GIScience & Remote Sensing, 57(5): 593-610.
[54]
Sorg A, Bolch T, Stoffel M, et al. 2012. Climate change impacts on glaciers and runoff in Tien Shan (Central Asia). Nature Climate Change, 2(10): 725-731.
doi: 10.1038/nclimate1592
[55]
Tao J, Zhou L N, Hickey K. 2023. Making sense of the black-boxes: Toward interpretable text classification using deep learning models. Journal of the Association for Information Science and Technology, 74(6): 685-700.
doi: 10.1002/asi.v74.6
[56]
TR J, Reddy N V S, Acharya U D. 2023. Modeling daily reference evapotranspiration from climate variables: Assessment of bagging and boosting regression approaches. Water Resources Management, 37(3): 1013-1032.
doi: 10.1007/s11269-022-03399-4
[57]
Vicente-Serrano S M, Beguería S, López-Moreno J I. 2010. A multiscalar drought index sensitive to global warming: The standardized precipitation evapotranspiration index. Journal of Climate, 23(7): 1696-1718.
doi: 10.1175/2009JCLI2909.1
[58]
Wang C Y, Chen J, Gu L, et al. 2023. A pathway analysis method for quantifying the contributions of precipitation and potential evapotranspiration anomalies to soil moisture drought. Journal of Hydrology, 621: 129570, doi: 10.1016/j.jhydrol.2023.129570.
[59]
Wang G G, Li X M, Zhao K X, et al. 2022. Quantifying the spatio-temporal variations and impacts of factors on vegetation water use efficiency using STL decomposition and Geodetector method. Remote Sensing, 14(23): 5926, doi: 10.3390/rs14235926.
[60]
Wang J F, Xu C D. 2017. Geodetector: Principle and prospective. Acta Geographica Sinica, 72(1): 116-134. (in Chinese)
doi: 10.11821/dlxb201701010
[61]
Wang J F, Li X H, Christakos G, et al. 2010. Geographical detectors-based health risk assessment and its application in the neural tube defects study of the Heshun Region, China. International Journal of Geographical Information Science, 24(1): 107-127.
doi: 10.1080/13658810802443457
[62]
Wei X M, Abulizi A, Yuan L, et al. 2025. A study on ecological risk identification based on ecosystem service supply and demand in Xinjiang. Scientific Reports, 15(1): 28575, doi: 10.1038/s41598-025-13026-y.
[63]
Yang L, Wei W, Wang T, et al. 2022. Temporal-spatial variations of vegetation cover and surface soil moisture in the growing season across the mountain-oasis-desert system in Xinjiang, China. Geocarto International, 37(13): 3912-3940.
doi: 10.1080/10106049.2021.1871666
[64]
Yang S Y, Dan M, Li X J, et al. 2018. Multi-scale responses of vegetation changes relative to the SPEI meteorological drought index in North China in 2001-2014. Acta Ecologica Sinica, 38(3): 1028-1039. (in Chinese)
[65]
Yang W J, Zhao Y, Guan H D, et al. 2023. Estimating spatiotemporal dynamics of evapotranspiration and assessing the cause for its increase in China. Agricultural and Forest Meteorology, 333: 109394, doi: 10.1016/j.agrformet.2023.109394.
[66]
Yang Y M. 2025. Estimating actual evapotranspiration across China by improving the PML algorithm with a shortwave infrared-based surface water stress constraint. Remote Sensing of Environment, 318: 114544, doi: 10.1016/j.rse.2024.114544.
[67]
Yao J Q, Chen Y N, Zhao Y, et al. 2018. Hydroclimatic changes of Lake Bosten in Northwest China during the last decades. Scientific Reports, 8(1): 9118, doi: 10.1038/s41598-018-27466-2.
[68]
Yao J Q, Chen Y N, Zhao Y, et al. 2020. Climatic and associated atmospheric water cycle changes over the Xinjiang, China. Journal of Hydrology, 585: 124823, doi: 10.1016/j.jhydrol.2020.124823.
[69]
Yao J Q, Chen Y N, Guan X F, et al. 2022a. Recent climate and hydrological changes in a mountain-basin system in Xinjiang, China. Earth-Science Reviews, 226: 103957, doi: 10.1016/j.earscirev.2022.103957.
[70]
Yao T D, Thompson L, Yang W, et al. 2012. Different glacier status with atmospheric circulations in Tibetan Plateau and surroundings. Nature Climate Change, 2(9): 663-667.
doi: 10.1038/nclimate1580
[71]
Yao T D, Bolch T, Chen D L, et al. 2022b. The imbalance of the Asian water tower. Nature Reviews Earth & Environment, 3(10): 618-632.
[72]
Yu S Q, Zhang Z H. 2025. Driving mechanisms of supply-demand imbalance in key ecosystem services in dust storm-prone areas: A case study of the Hotan Oasis. Land Degradation & Development, 37(6): 1974-1988.
[73]
Zhang D L, Yang Y P, Lan B. 2018. Climate variability in the northern and southern Altai Mountains during the past 50 years. Scientific Reports, 8(1): 3238, doi: 10.1038/s41598-018-21637-x.
pmid: 29459750
[74]
Zhang J Y, Ding J L, Wu P F, et al. 2020. Assessing arid inland lake watershed area and vegetation response to multiple temporal scales of drought across the Ebinur Lake Watershed. Scientific Reports, 10(1): 1354, doi: 10.1038/s41598-020-57898-8.
[75]
Zhang Y Q, Peña-Arancibia J L, McVicar T R, et al. 2016. Multi-decadal trends in global terrestrial evapotranspiration and its components. Scientific Reports, 6: 19124, doi: 10.1038/srep19124.
pmid: 26750505
[76]
Zhang Y Q, Kong D D, Gan R, et al. 2019. Coupled estimation of 500 m and 8-day resolution global evapotranspiration and gross primary production in 2002-2017. Remote Sensing of Environment, 222: 165-182.
doi: 10.1016/j.rse.2018.12.031
[77]
Zhao S Y, Huang Y, Liu Z B, et al. 2024. Estimation of actual evapotranspiration and water stress in typical irrigation areas in Xinjiang, Northwest China. Remote Sensing, 16(14): 2676, doi: 10.3390/rs16142676.
[78]
Zhu S H, Fang X, Cao L Z, et al. 2023. Multivariate drives and their interactive effects on the ratio of transpiration to evapotranspiration over Central Asia ecosystems. Ecological Modelling, 478: 110294, doi: 10.1016/j.ecolmodel.2023.110294.