Trend and future persistence of leaf area index across transboundary river basin landscapes in Central Asia
KUANG Jingchao1, LIU Dengfeng1,*(), MA Chuanhui1, MING Bo1, YANG Yuanyuan1, MING Guanghui2, LI Mingliang3, Mohd Yawar Ali KHAN4, Fiaz HUSSAIN5, MENG Xianmeng6, LI Qiang7
1State Key Laboratory of Water Engineering Ecology and Environment in Arid Area, Xi'an University of Technology, , Xi'an 710048, China 2Key Laboratory of Water Management and Water Security for Yellow River Basin (Ministry of Water Resources), Yellow River Engineering Consulting Co., Ltd., Zhengzhou 450003, China 3General Institute of Water Resources and Hydropower Planning and Design, Ministry of Water Resources, Beijing 100081, China 4Department of Hydrogeology, Faculty of Earth Sciences, King Abdulaziz University, Jeddah 21589, Saudi Arabia 5Department of Land and Water Conservation Engineering, Faculty of Agricultural Engineering and Technology, Pir Mehr Ali Shah (PMAS) Arid Agriculture University Rawalpindi, Rawalpindi 46300, Pakistan 6School of Environmental Studies, China University of Geosciences, Wuhan 430074, China 7College of Forestry, Northwest A&F University, Yangling 712100, China
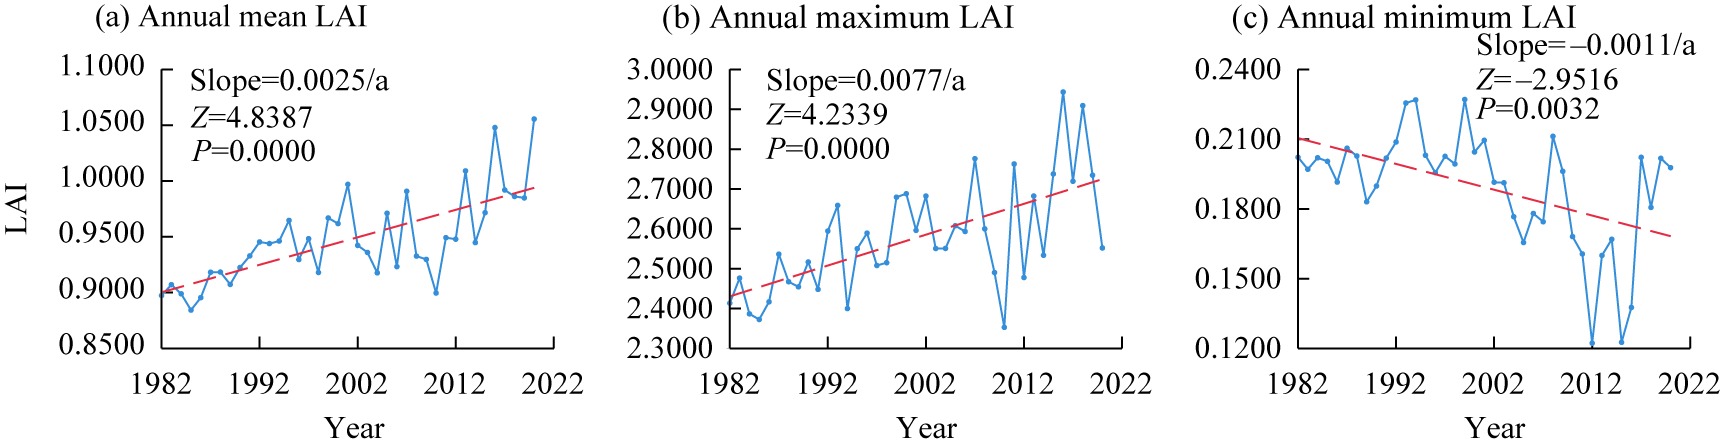
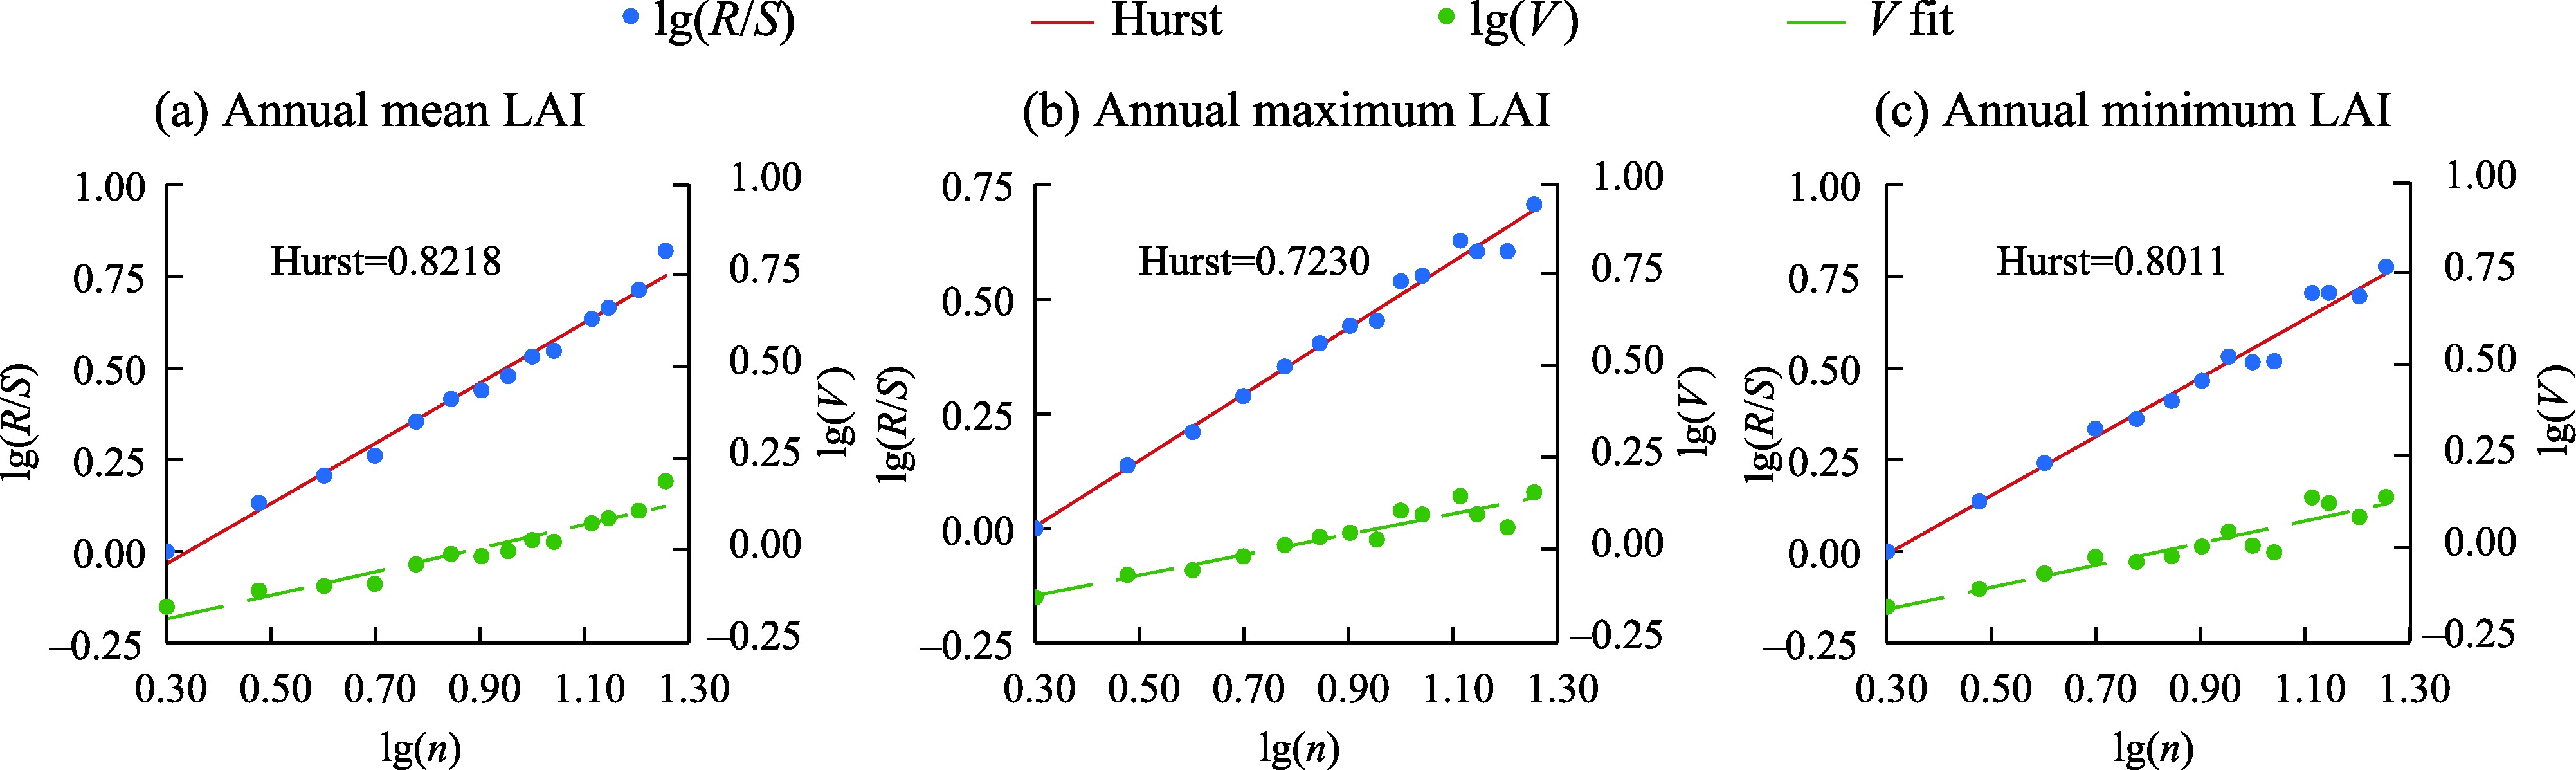
The middle and lower reaches of the Irtysh River form a transboundary ecological corridor across the Republic of Kazakhstan and Russia and represent an environmentally sensitive region in arid Central Asia. Understanding long-term vegetation dynamics in this region is essential for evaluating ecological stability and supporting cross-border ecosystem management. However, existing studies are mostly confined to individual administrative units, breaking the eco-hydrological integrity of transboundary basins; meanwhile, most analyses rely on single annual-mean vegetation metrics, failing to reveal the differentiated variation patterns and long-term persistence of LAI across different vegetation growth states. This study used the Global Inventory Modeling and Mapping Studies Leaf Area Index 4g (GIMMS LAI4g) dataset and Climate Research Unit (CRU) precipitation data from 1982 to 2020, to investigate the spatiotemporal dynamics of leaf area index (LAI) across 14 transboundary subregions in the middle and lower reaches of the Irtysh River Basin. Specifically, this study applied Mann-Kendall trend analysis and Theil-Sen median slope estimator to identify long-term trends, employed rescaled range analysis evaluate long-term persistence, conducted Pearson correlation analysis to quantify the relationship between LAI and precipitation, and used spatial pattern analysis to characterize regional heterogeneity. The results showed significant increases in annual mean and maximum LAI, with Sen's slopes of 0.0025/a and 0.0077/a, respectively, whereas annual minimum LAI exhibited a significant decreasing trend (-0.0011/a). Pronounced spatial heterogeneity was observed among mountainous and piedmont regions, steppe-riparian transition zones, and downstream forest-wetland landscapes. Rolling-window analysis revealed relatively stable vegetation dynamics during the early period, followed by enhanced spatial divergence and increased interannual variability after the early 2000s. All LAI indicators exhibited strong persistence, with Hurst exponents exceeding 0.7000 across the study area, indicating that the observed vegetation trajectories are likely to persist in the future. Precipitation showed significant positive correlations with annual maximum and mean LAI in 64.29% and 57.14% of the study area, respectively, whereas annual minimum LAI showed generally weak responses to precipitation variability. These findings improve understanding of vegetation dynamics and future persistence in transboundary arid river basins and provide scientific support for ecological conservation and sustainable watershed management in Central Asia.
Received: 01 February 2026
Published: 31 August 2026
Fund: This study was financially supported by the Third Xinjiang Integrated Scientific Survey Project of Ministry of Science and Technology (MoST) of China(2022xjkk0703);the National Natural Science Foundation of China (52279025). This work contributes to the goals of the International Association of Hydrological Sciences (IAHS) scientific decade of Hydrology Engaging Local People in Global solutions (HELPING)(2023-2032)
Conceptualization: KUANG Jingchao, LIU Dengfeng; Data curation: KUANG Jingchao, LIU Dengfeng; Methodology: KUANG Jingchao, LIU Dengfeng; Formal analysis: KUANG Jingchao, LIU Dengfeng; Writing - original draft preparation: KUANG Jingchao, LIU Dengfeng; Writing - review and editing: KUANG Jingchao, LIU Dengfeng, MA Chuanhui, MING Bo, YANG Yuanyuan, MING Guanghui, LI Mingliang, Mohd Yawar Ali KHAN, Fiaz HUSSAIN, MENG Xianmeng, LI Qiang; Funding acquisition: LIU Dengfeng, LI Mingliang; Supervision: LIU Dengfeng. All authors approved the manuscript.
KUANG Jingchao, LIU Dengfeng, MA Chuanhui, MING Bo, YANG Yuanyuan, MING Guanghui, LI Mingliang, Mohd Yawar Ali KHAN, Fiaz HUSSAIN, MENG Xianmeng, LI Qiang. Trend and future persistence of leaf area index across transboundary river basin landscapes in Central Asia. Journal of Arid Land, 2026, 18(8): 1378-1404.
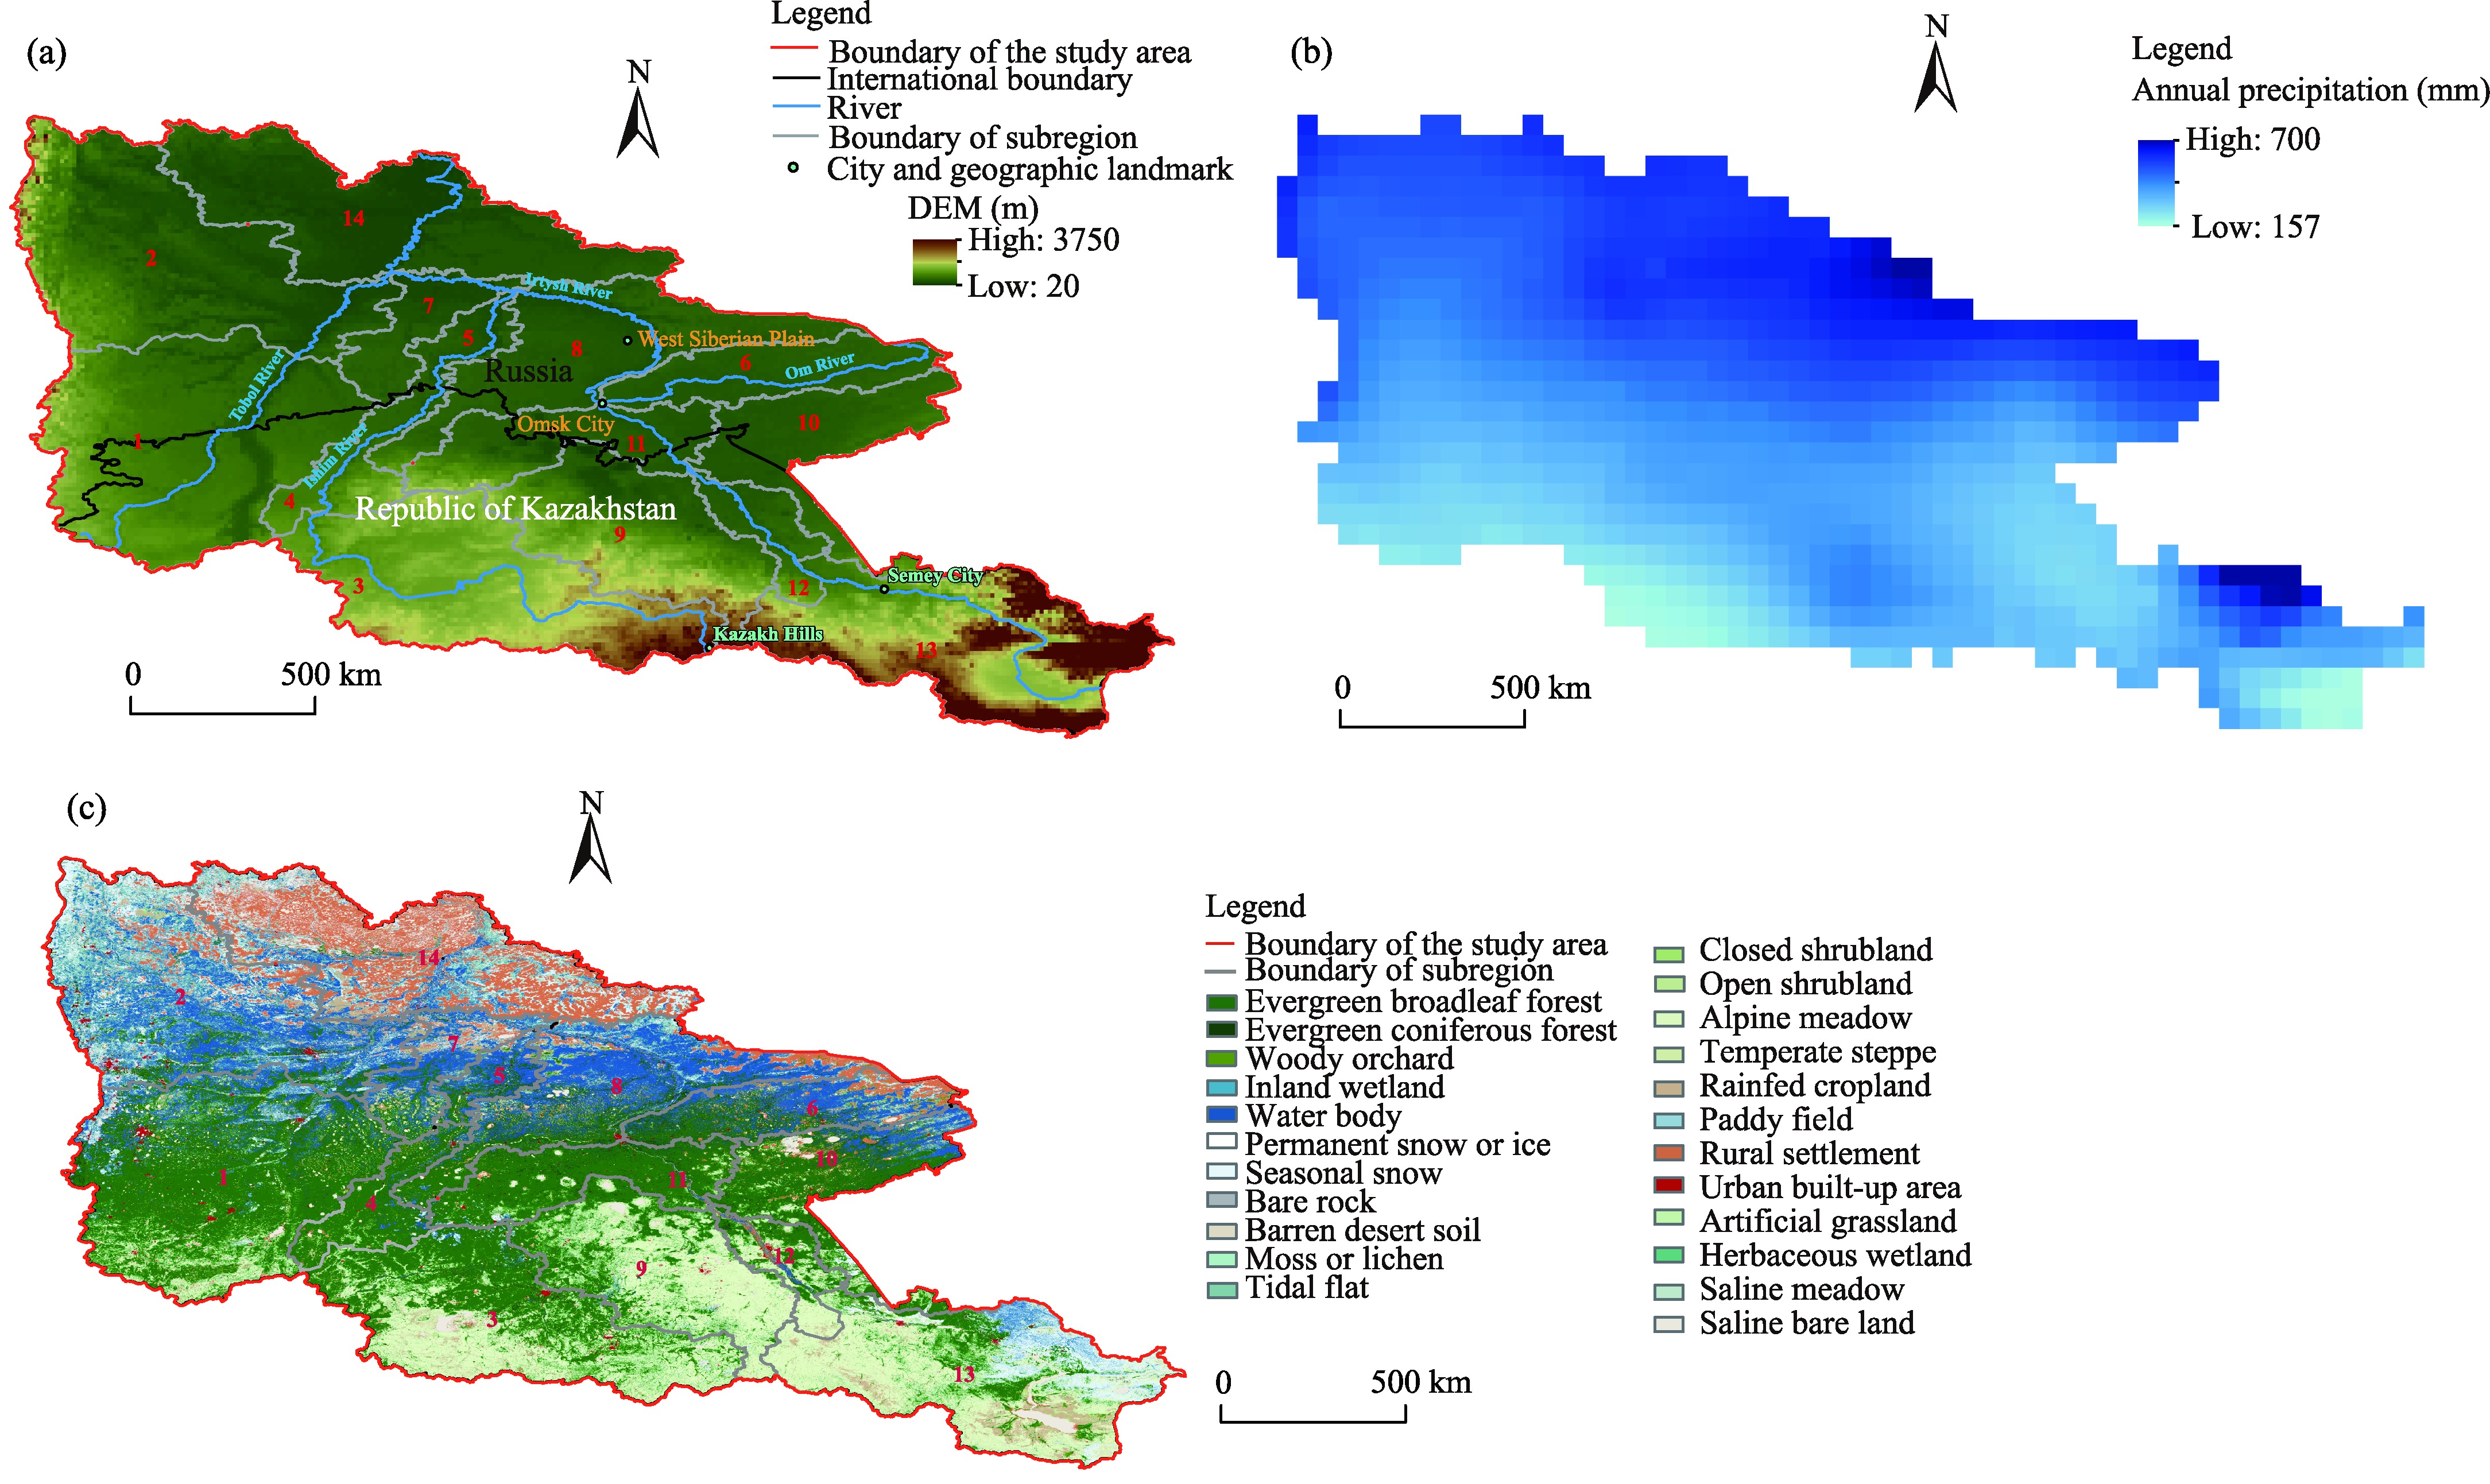
Fig. 1Overview of the middle and lower reaches of the Irtysh River Basin. (a), elevation distribution of the study area; (b), spatial distribution of annual precipitation in 2018; (c), vegetation cover map of 2020. Numbers 1-14 are the subregion serial numbers. DEM, digital elevation model.
Fig. 2Mann-Kendall trend test of leaf area index (LAI) for the middle and lower reaches of the Irtysh River Basin. (a), annual mean LAI; (b), annual maximum LAI; (c), annual minimum LAI.
Fig. 3Rescaled range analysis of LAI in the middle and lower reaches of the Irtysh River Basin. (a), annual mean LAI; (b), annual maximum LAI; (c), annual minimum LAI. H denotes the Hurst exponent, which reflects the strength of long-term persistence in the LAI time series; V statistic is a diagnostic metric used to validate the reliability and stability of the Hurst exponent; R/S denotes the rescaled range ratio, in which R represents the range of cumulative deviations from the mean, and S is the sample standard deviation of the time series; and n stands for the sequential block size, namely the length of each contiguous subseries divided from the whole LAI time series during rescaled range analysis.
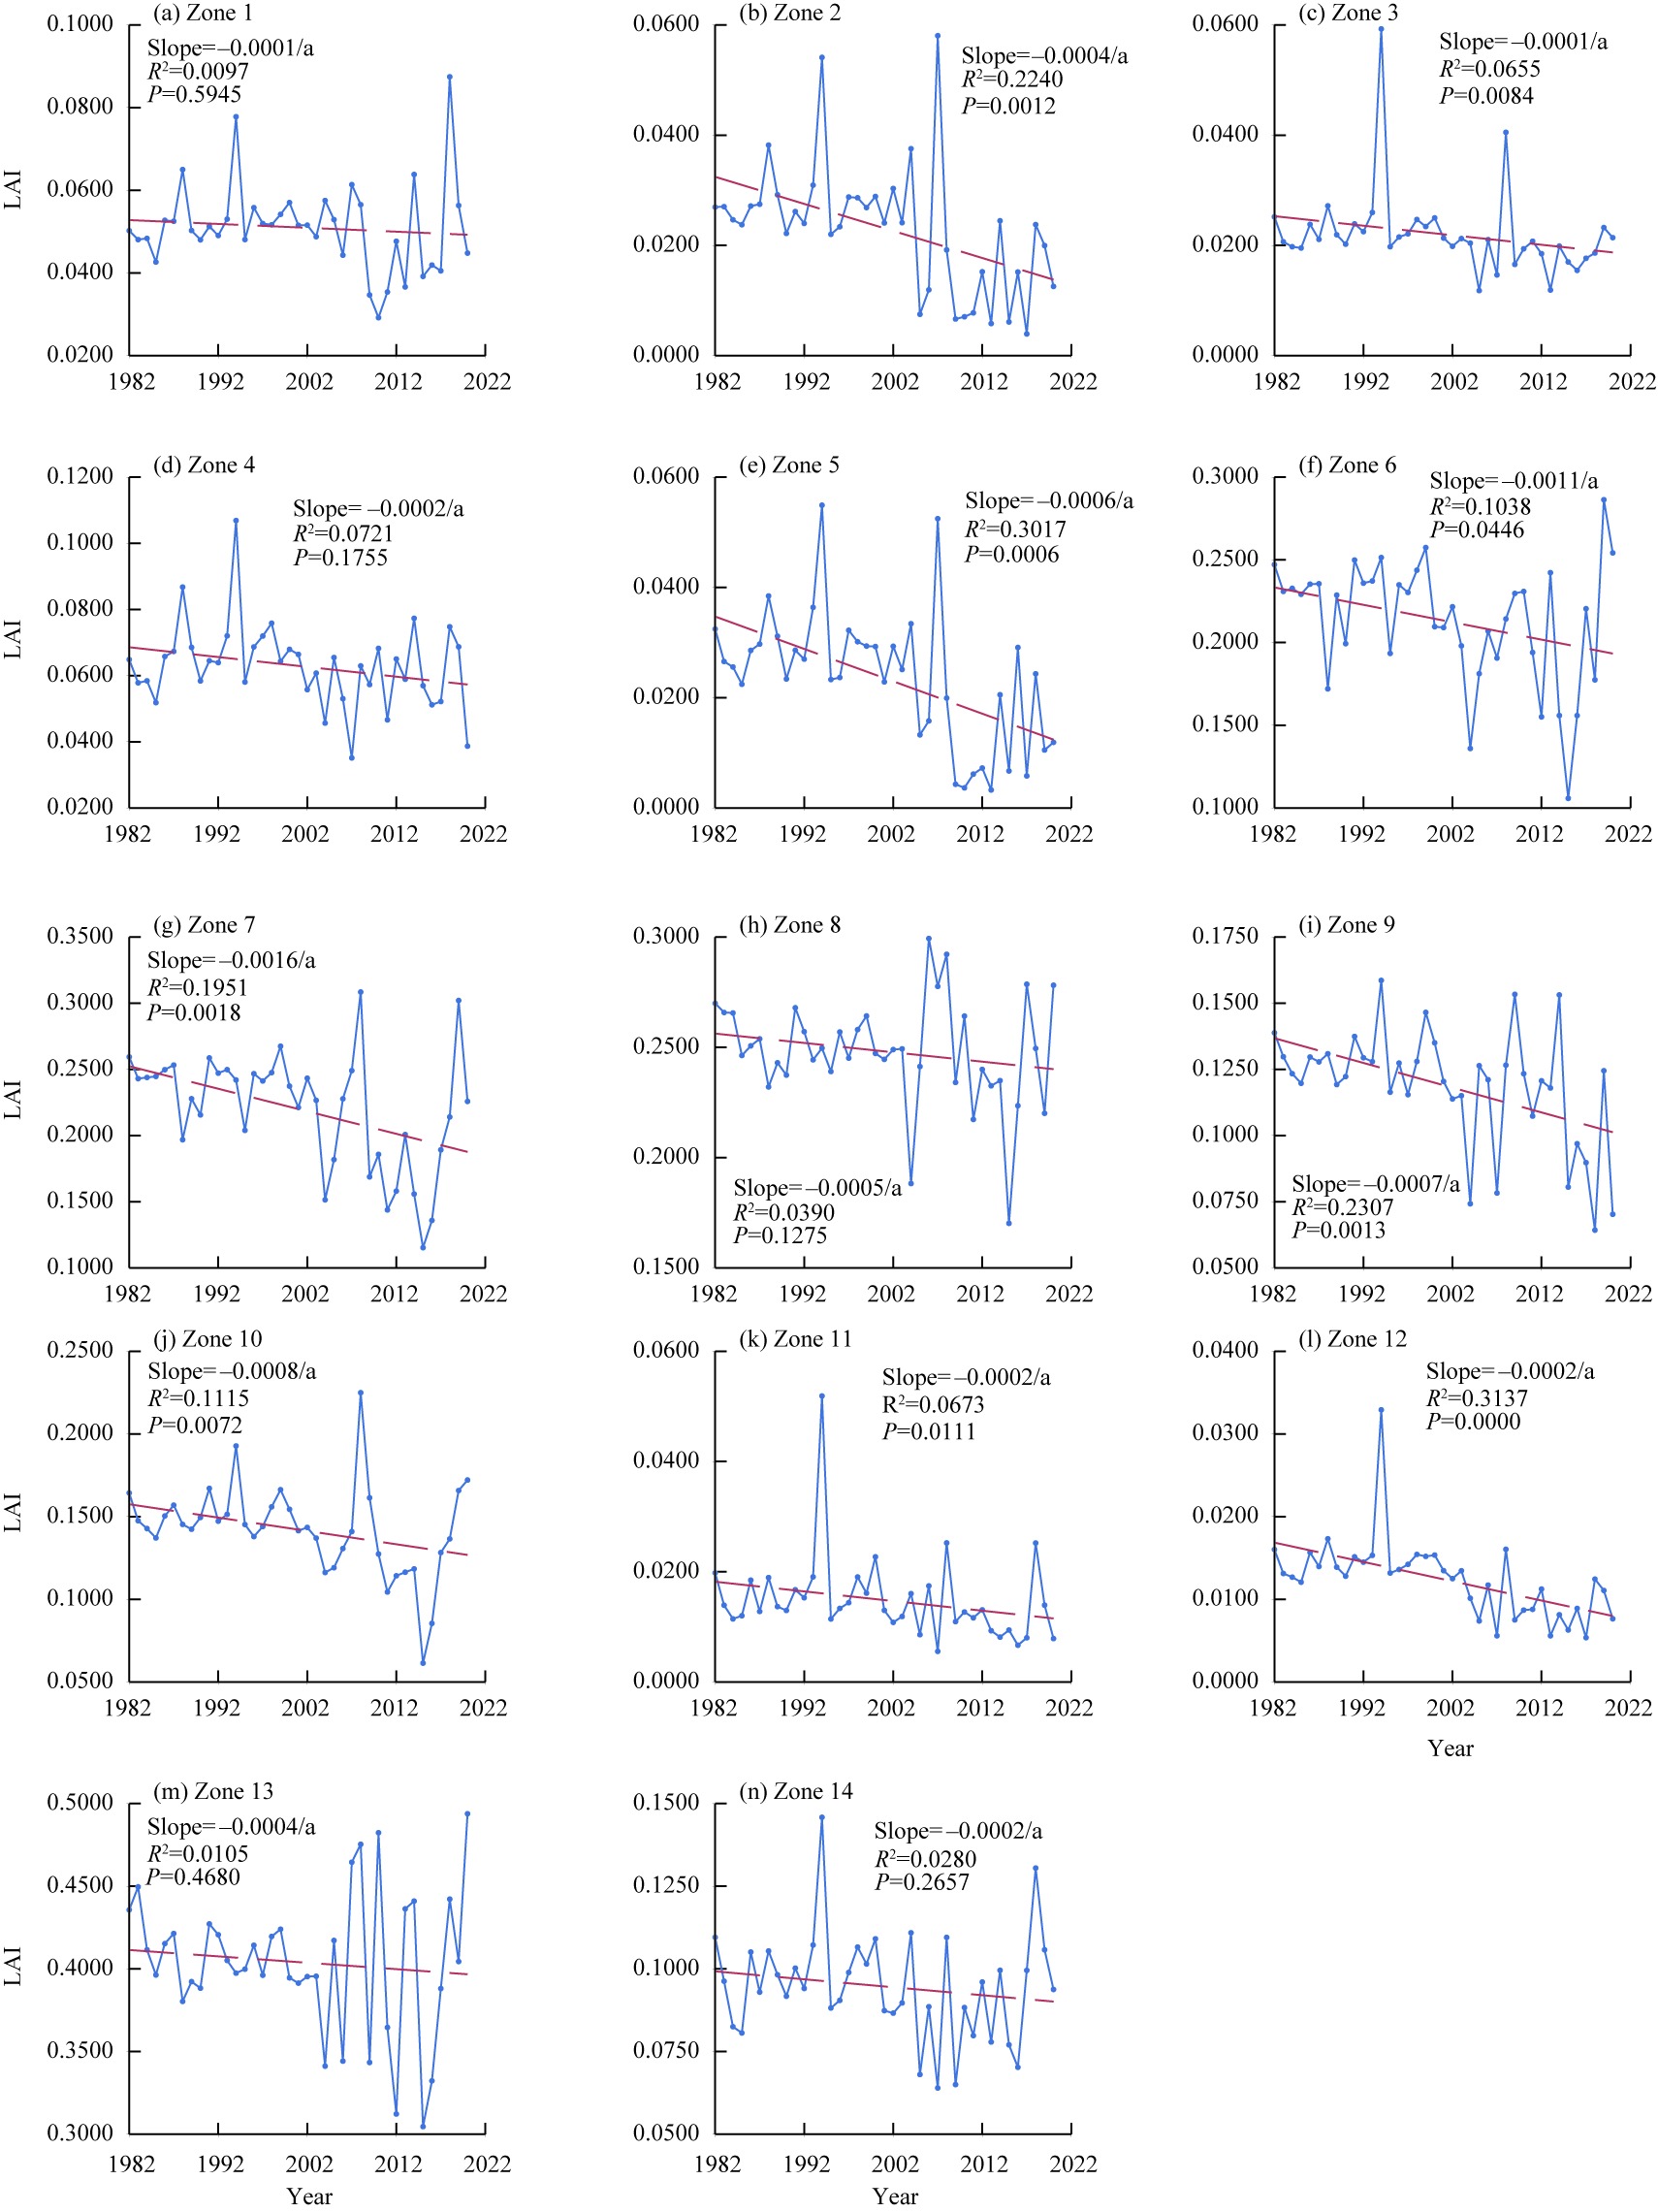
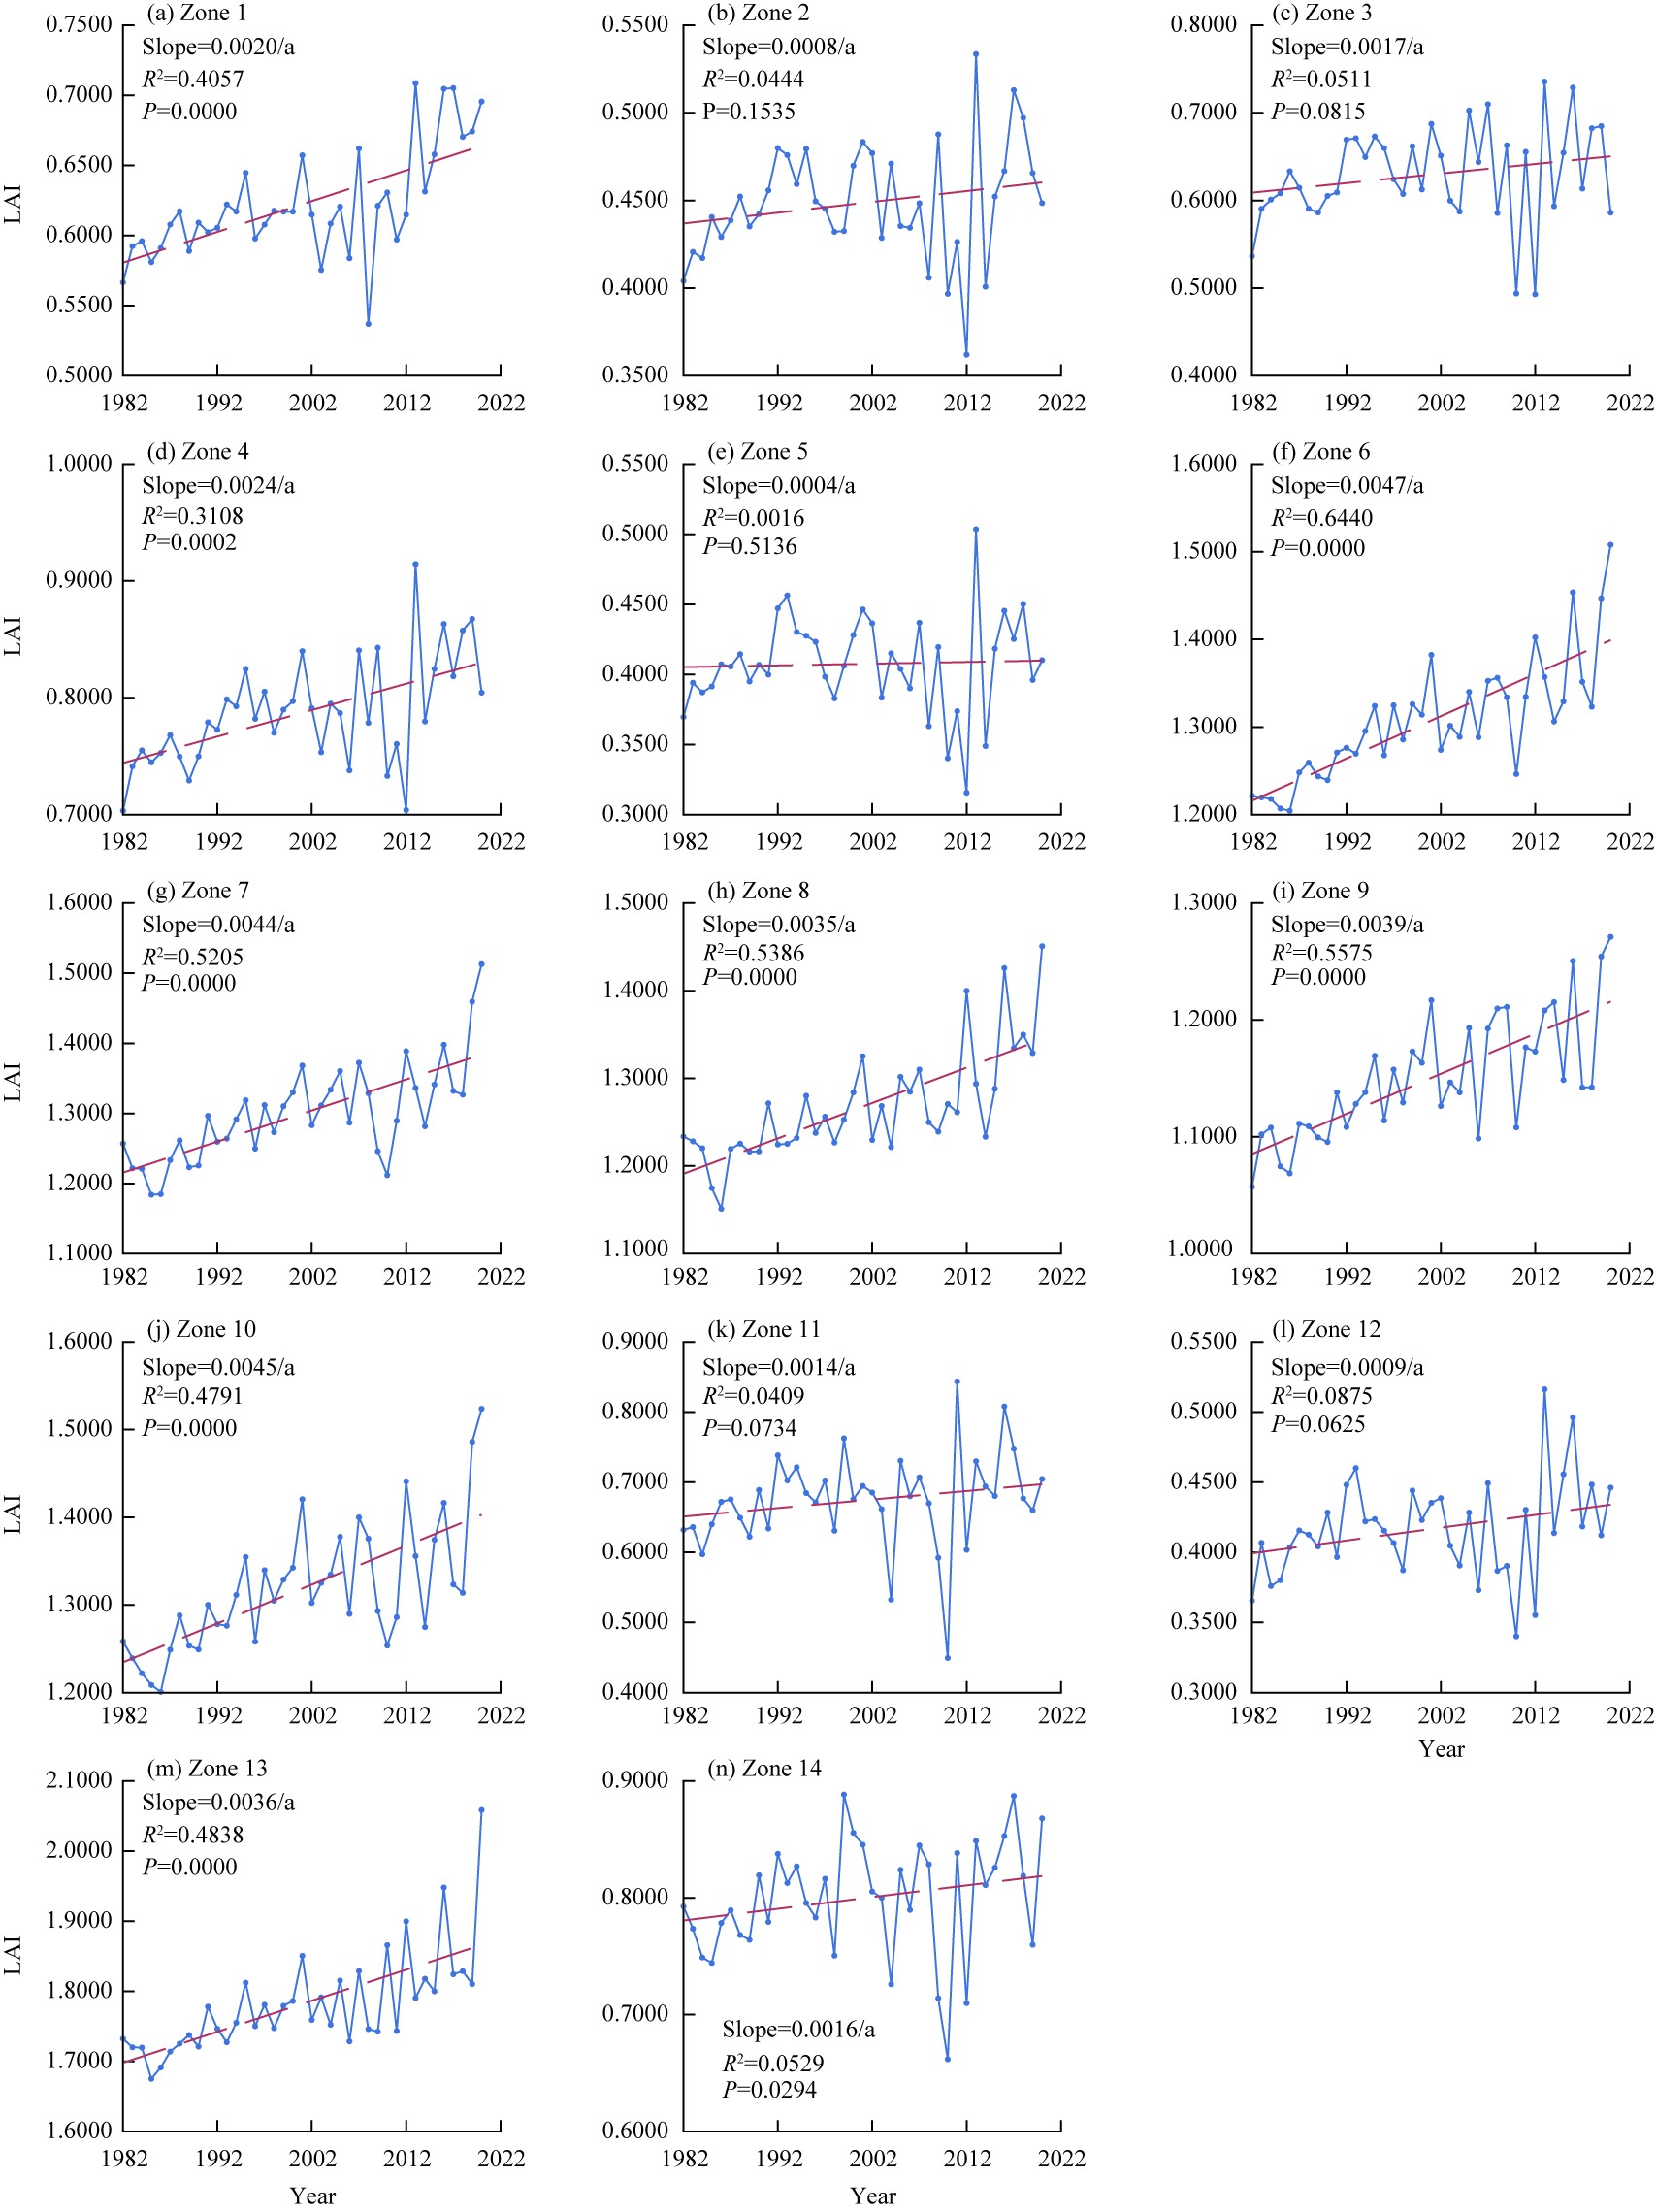
Fig. 4Mann-Kendall trend test results for annual minimum LAI values of the 14 subregions in the middle and lower reaches of the Irtysh River Basin from 1982 to 2020. (a), Zone 1; (b), Zone 2; (c), Zone 3; (d), Zone 4;(e), Zone 5; (f), Zone 6; (g), Zone 7; (h), Zone 8; (i), Zone 9; (j), Zone 10; (k), Zone 11; (l), Zone 12; (m), Zone 13; (n), Zone 14.
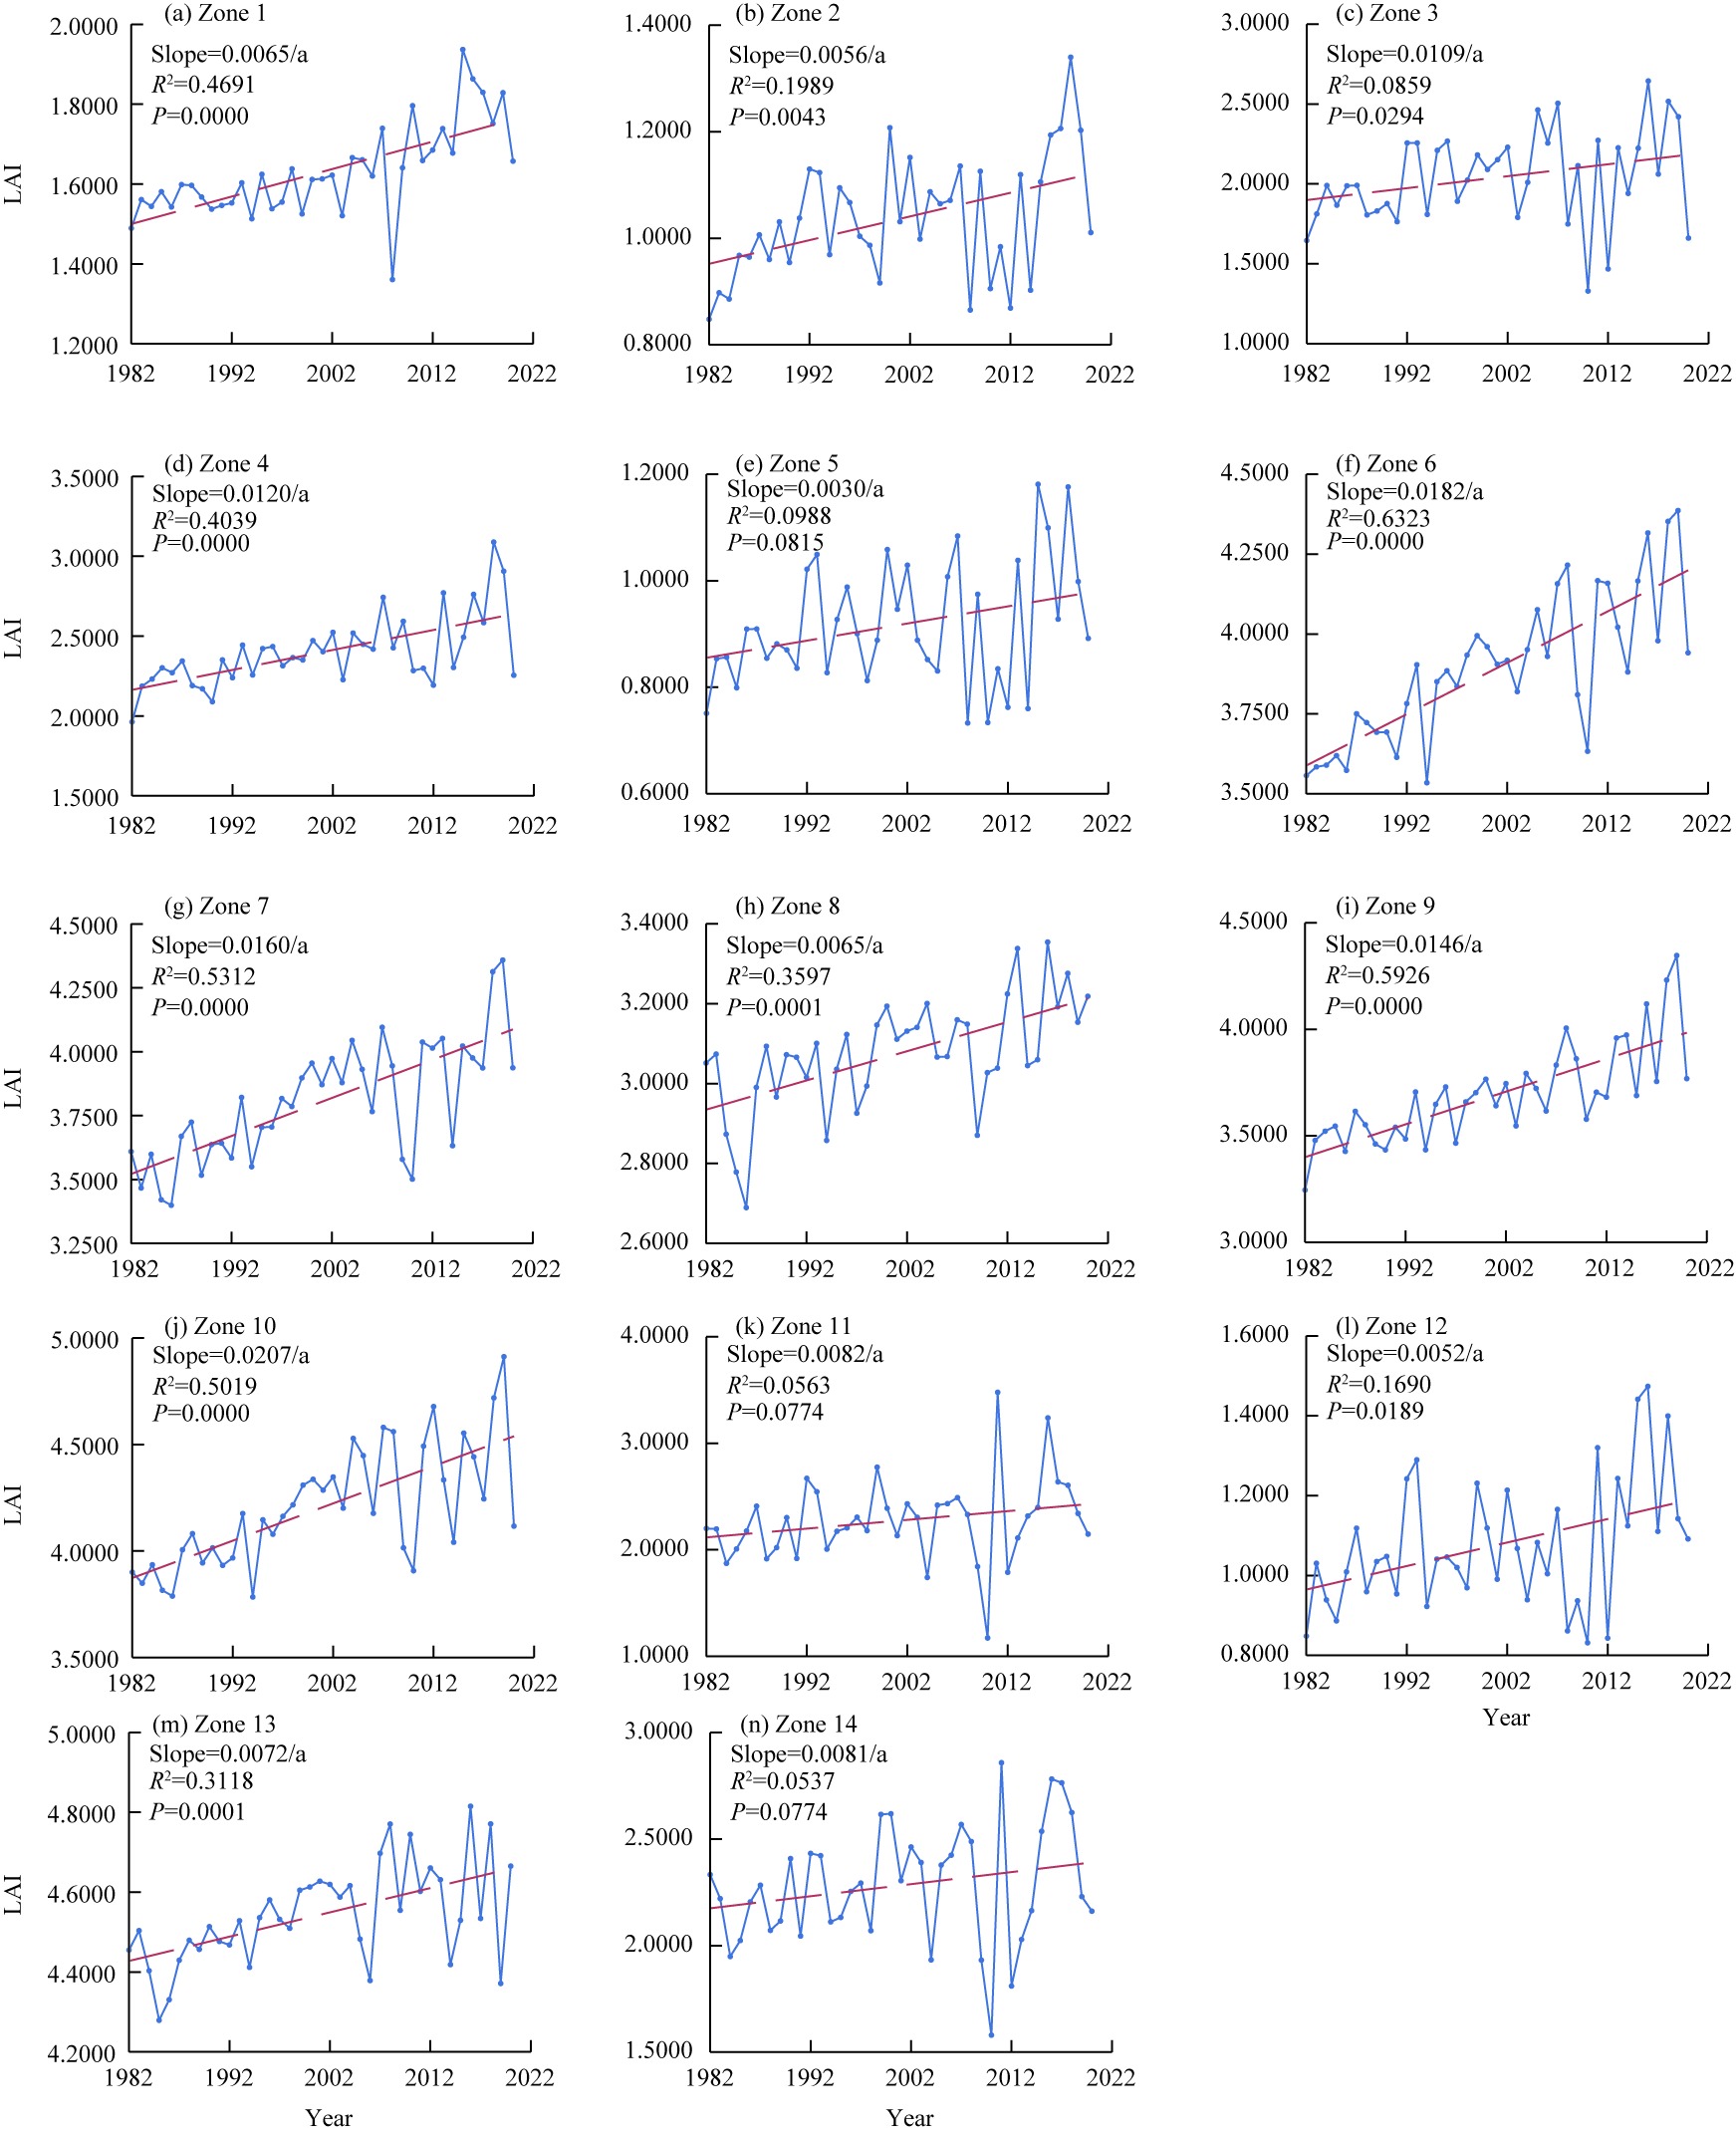
Fig. 5Mann-Kendall trend test results for annual mean LAI values of the 14 subregions in the middle and lower reaches of the Irtysh River Basin from 1982 to 2020. (a), Zone 1; (b), Zone 2; (c), Zone 3; (d), Zone 4; (e), Zone 5; (f), Zone 6; (g), Zone 7; (h), Zone 8; (i), Zone 9; (j), Zone 10; (k), Zone 11; (l), Zone 12; (m), Zone 13; (n), Zone 14.
Fig. 6Mann-Kendall trend test results for annual maximum LAI values of the 14 subregions in the middle and lower reaches of the Irtysh River Basin from 1982 to 2020. (a), Zone 1; (b), Zone 2; (c), Zone 3; (d), Zone 4; (e), Zone 5; (f), Zone 6; (g), Zone 7; (h), Zone 8; (i), Zone 9; (j), Zone 10; (k), Zone 11; (l), Zone 12; (m), Zone 13; (n), Zone 14.
Fig. 7Rescaled range analysis results for annual minimum LAI values of the 14 subregions in the middle and lower reaches of the Irtysh River Basin from 1982 to 2020. (a), Zone 1; (b), Zone 2; (c), Zone 3; (d), Zone 4; (e), Zone 5; (f), Zone 6; (g), Zone 7; (h), Zone 8; (i), Zone 9; (j), Zone 10; (k), Zone 11; (l), Zone 12; (m), Zone 13; (n), Zone 14.
Fig. 8Rescaled range analysis results for annual mean LAI values of the 14 subregions in the middle and lower reaches of the Irtysh River Basin from 1982 to 2020. (a), Zone 1; (b), Zone 2; (c), Zone 3; (d), Zone 4; (e), Zone 5; (f), Zone 6; (g), Zone 7; (h), Zone 8; (i), Zone 9; (j), Zone 10; (k), Zone 11; (l), Zone 12; (m), Zone 13; (n), Zone 14.
Fig. 9Rescaled range analysis of annual maximum LAI values of the 14 subregions in the middle and lower reaches of the Irtysh River Basin from 1982 to 2020. (a), Zone 1; (b), Zone 2; (c), Zone 3; (d), Zone 4; (e), Zone 5; (f), Zone 6; (g), Zone 7; (h), Zone 8; (i), Zone 9; (j), Zone 10; (k), Zone 11; (l), Zone 12; (m), Zone 13; (n), Zone 14.
Zone
Correlation coefficient
P-value
Correlation relationship
1
0.4820
0.0019
Weak positive (significant)
2
0.4869
0.0017
Weak positive (significant)
3
0.5307
0.0005
Moderate positive (significant)
4
0.4014
0.0113
Weak positive (significant)
5
0.6025
0.0000
Moderate positive (significant)
6
0.2517
0.1221
Very weak positive (not significant)
7
0.3313
0.0394
Weak positive (significant)
8
0.0642
0.6977
Very weak positive (not significant)
9
0.2304
0.1582
Very weak positive (not significant)
10
0.3083
0.0562
Weak positive (not significant)
11
0.4526
0.0038
Weak positive (significant)
12
0.5805
0.0001
Moderate positive (significant)
13
-0.1884
0.2507
Very weak negative (not significant)
14
0.5574
0.0002
Moderate positive (significant)
Table 1 Pearson correlation analysis results between annual maximum leaf area index (LAI) and annual precipitation across subregions
Zone
Correlation coefficient
P-value
Correlation relationship
1
0.4710
0.0025
Weak positive (significant)
2
0.5020
0.0011
Moderate positive (significant)
3
0.5728
0.0001
Moderate positive (significant)
4
0.4541
0.0037
Weak positive (significant)
5
0.5835
0.0001
Moderate positive (significant)
6
0.0707
0.6687
Very weak positive (not significant)
7
0.1181
0.4738
Very weak positive (not significant)
8
-0.0101
0.9516
Very weak negative (not significant)
9
0.0211
0.8987
Very weak positive (not significant)
10
0.0800
0.6297
Very weak positive (not significant)
11
0.5269
0.0006
Moderate positive (significant)
12
0.6626
0.0000
Moderate positive (significant)
13
-0.2180
0.1824
Very weak negative (not significant)
14
0.5381
0.0004
Moderate positive (significant)
Table 2 Pearson correlation analysis between annual mean LAI and annual precipitation across subregions
Zone
Correlation coefficient
P-value of annual minimum LAI
Correlation relationship
1
-0.0682
0.6801
Very weak negative (not significant)
2
-0.1202
0.4661
Very weak negative (not significant)
3
-0.1055
0.5225
Very weak negative (not significant)
4
-0.2054
0.2098
Very weak negative (not significant)
5
-0.1024
0.5349
Very weak negative (not significant)
6
-0.2052
0.2101
Very weak negative (not significant)
7
-0.1526
0.3536
Very weak negative (not significant)
8
-0.1095
0.5068
Very weak negative (not significant)
9
-0.3121
0.0531
Weak negative (not significant)
10
-0.2303
0.1584
Very weak negative (not significant)
11
0.1183
0.4732
Very weak positive (not significant)
12
-0.2137
0.1915
Very weak negative (not significant)
13
-0.2206
0.1772
Very weak negative (not significant)
14
0.0398
0.8101
Very weak positive (not significant)
Table 3 Pearson correlation analysis between annual minimum LAI and annual precipitation across subregions
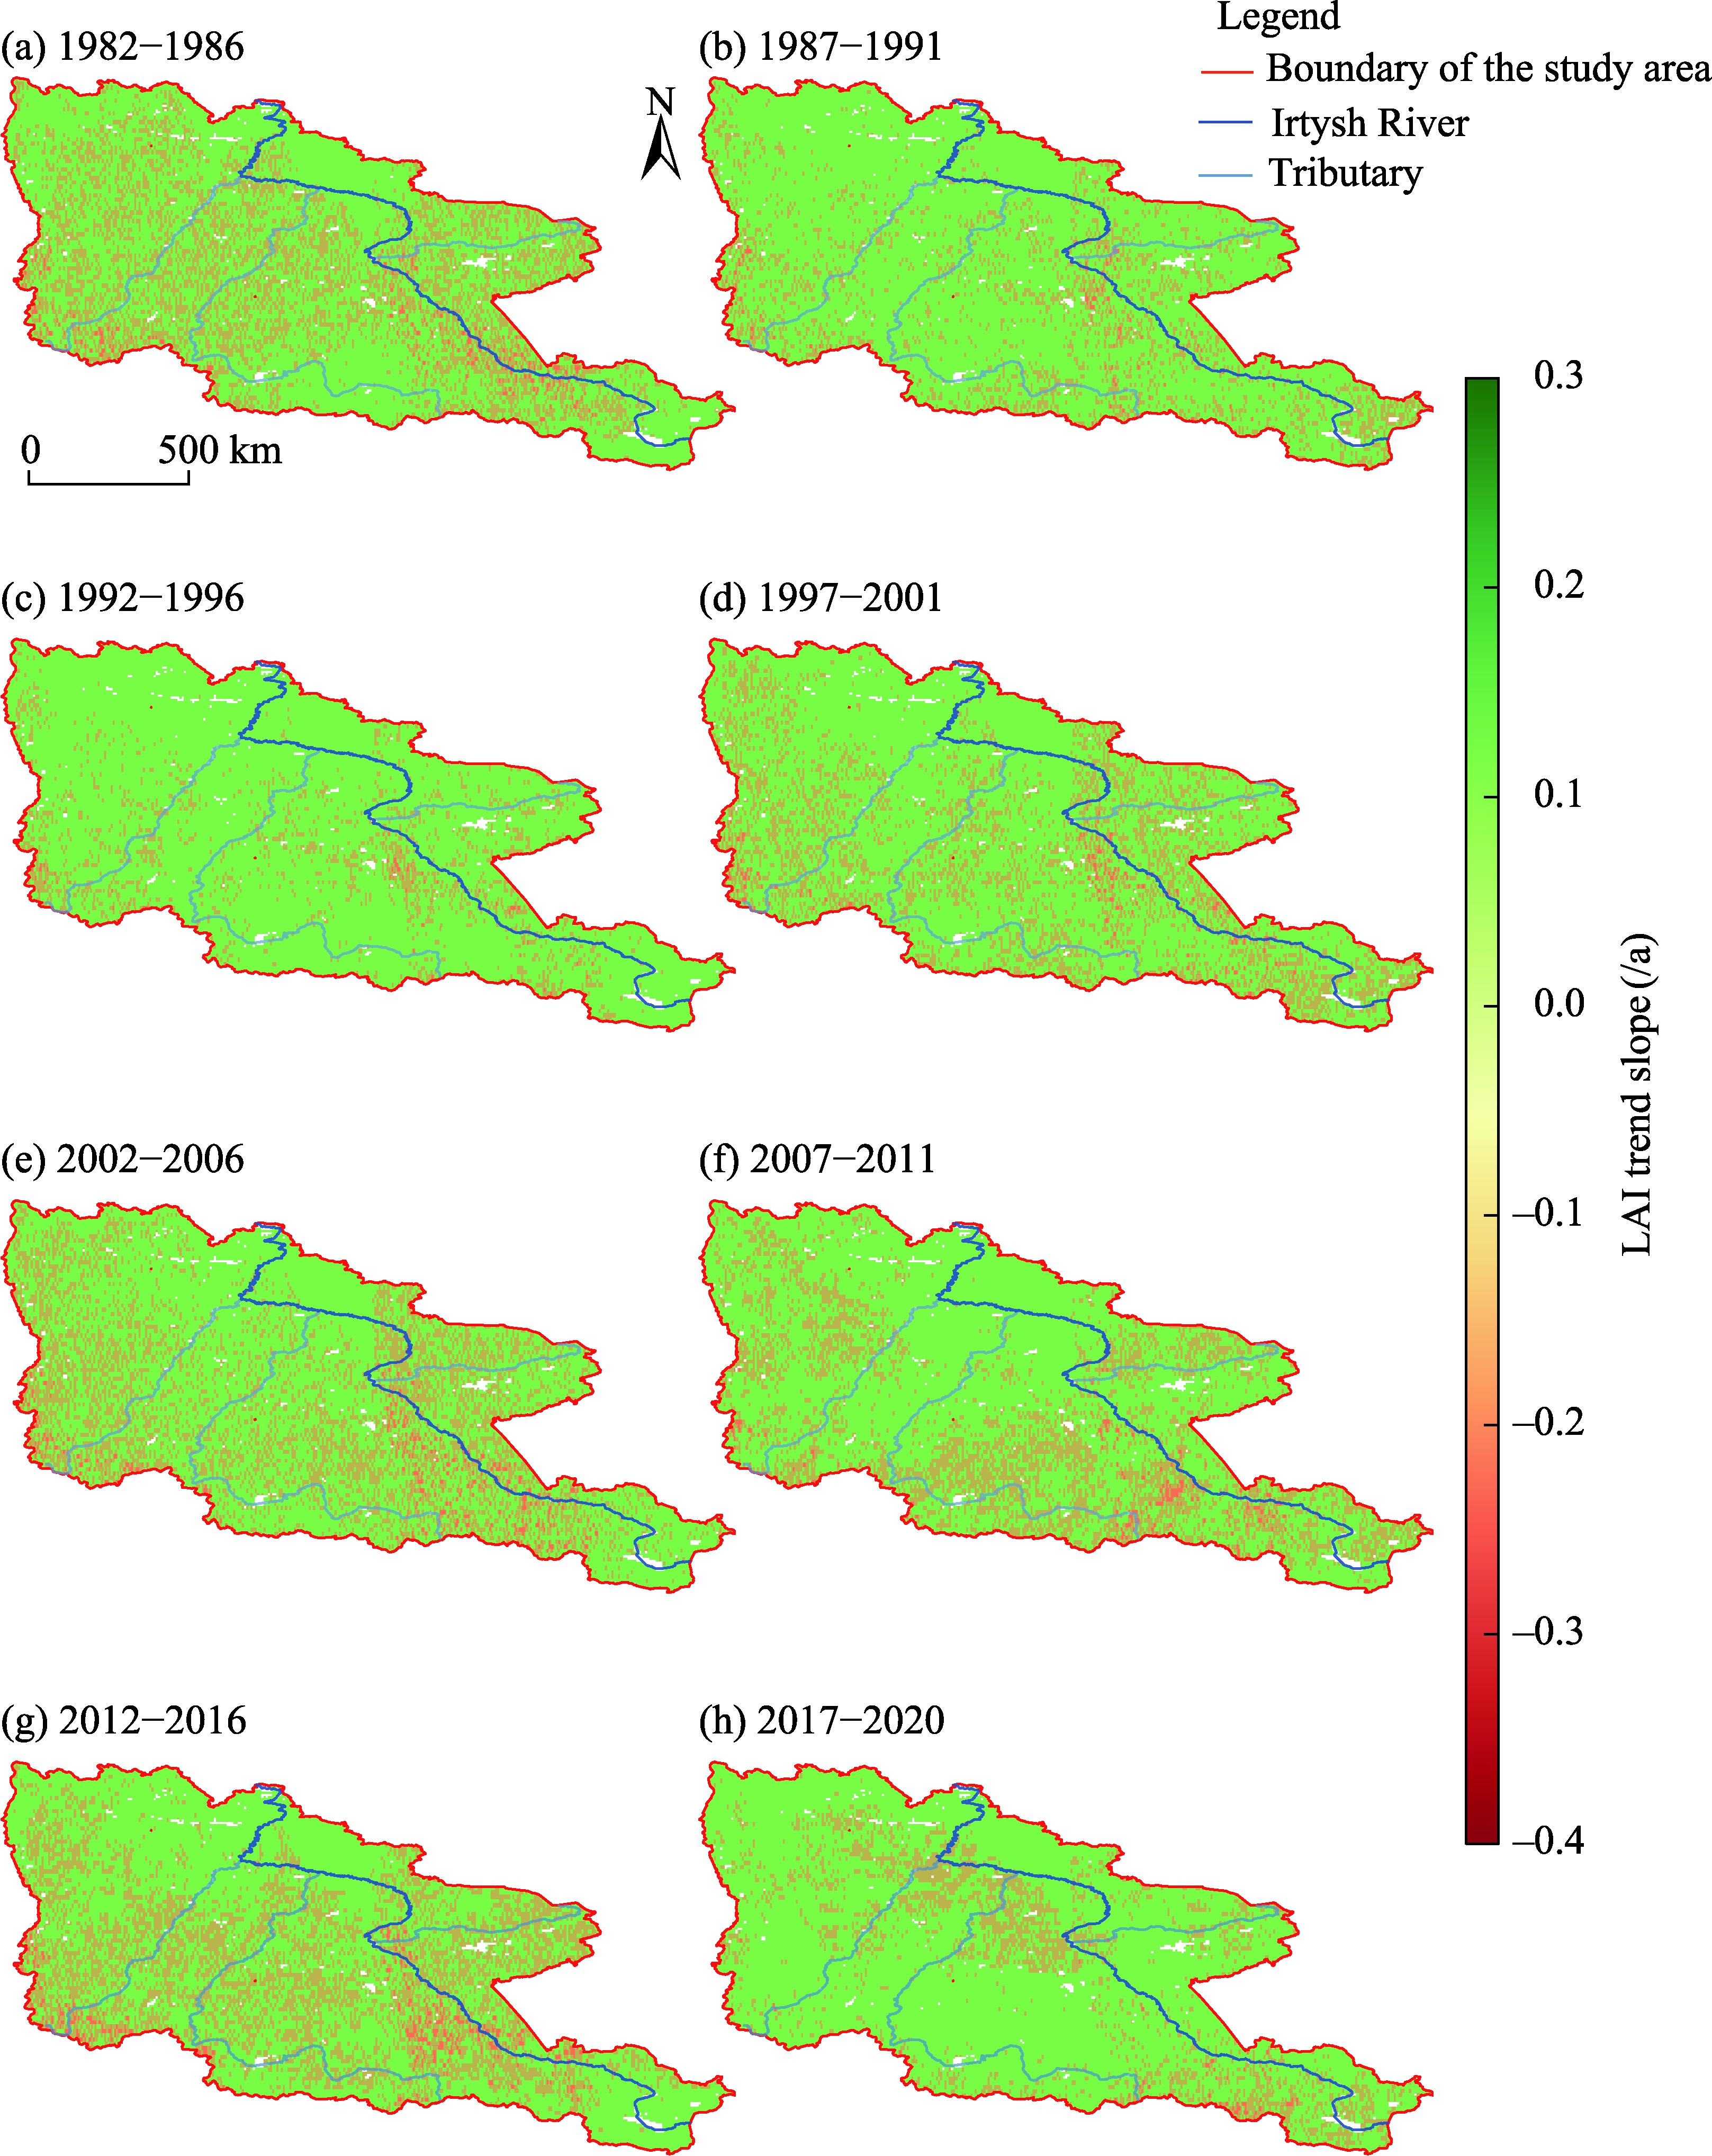
Fig. 10Spatial patterns of rolling trend slopes of LAI over multi-period 5-year sliding windows in the middle and lower reaches of the Irtysh River Basin. (a), 1982-1986; (b), 1987-1991; (c), 1992-1996; (d), 1997-2001; (e), 2002-2006; (f), 2007-2011; (g), 2012-2016; (h), 2017-2020.
Fig. 11Spatial differentiation of annual LAI interannual variability across the middle and lower reaches of the Irtysh River Basin under multi-period 5-year sliding window segmentation. (a), 1982-1986; (b), 1987-1991; (c), 1992-1996; (d), 1997-2001; (e), 2002-2006; (f), 2007-2011; (g), 2012-2016; (h), 2017-2020.
[1]
Buermann W, Parida B, Jung M, et al. 2014. Recent shift in Eurasian boreal forest greening response may be associated with warmer and drier summers. Geophysical Research Letters, 41(6): 1995-2002.
doi: 10.1002/2014GL059450
[2]
Cao S, Li M Y, Zhu Z C, et al. 2023. Spatiotemporally consistent global dataset of the GIMMS Leaf Area Index (GIMMS LAI4g) from 1982 to 2020. Earth System Science Data, 15(11): 4877-4899.
doi: 10.5194/essd-15-4877-2023
[3]
Cao S, Zhu Z C. 2024. Global Monitoring System Leaf Area Index (GIMMS LAI4g) spatiotemporal consistent dataset (V1.2). National Cryosphere Desert Data Center, [2025-12-25]. doi: 10.5281/zenodo.8281930.
[4]
Harris I, Osborn T J, Jones P, et al. 2020. Version 4 of the CRU TS monthly high-resolution gridded multivariate climate dataset. Scientific Data, 7: 109, doi: 10.1038/s41597-020-0453-3.
pmid: 32246091
[5]
Li J, Xia Z Q, Guo L D, et al. 2008. Analysis on climate characteristics and variation trends of the Irtysh River Basin. Journal of Hohai University (Natural Sciences), 36(3): 311-315. (in Chinese)
[6]
Li M, Yao J, Zheng J. 2024a. Spatio-temporal change and drivers of vegetation trends in Central Asia. Forests, 15(8): 1416, doi: 10.3390/f15081416.
[7]
Li W, Samat A, Abuduwaili J, et al. 2024b. Spatiotemporal pattern, evolutionary trend, and driving forces analysis of ecological quality in the Irtysh River Basin (2000-2020). Land, 13(2): 222, doi: 10.3390/land13020222.
[8]
Li X, Wang Y, Zhang Q, et al. 2023. Stronger cumulative than lagged effects of drought on vegetation in Central Asia. Forests, 14(11): 2142, doi: 10.3390/f14112142.
[9]
Liu H, Hao H G, Zhang W G, et al. 2022. Effectiveness evaluation of ecological protection and restoration based on pattern-quality-service: A case study of the Irtysh River Basin. Research of Environmental Sciences, 35(11): 2495-2507. (in Chinese)
[10]
Liu L Y, Zhang X. 2021. Global 30 m land cover fine classification product. Aerospace Information Research Institute, Chinese Academy of Sciences. [2025-12-24]. doi: 10.12237/casearth.6123651428a58f70c2a51e49.
[11]
Mandelbrot B B, Wallis J R. 1969. Computer experiments with fractional Gaussian noise. Water Resources Research, 5(1): 228-241.
doi: 10.1029/WR005i001p00228
[12]
Nemani R R, Keeling C D, Hashimoto H, et al. 2003. Climate-driven increases in global terrestrial net primary production from 1982 to 1999. Science, 300(5625): 1560-1563.
pmid: 12791990
[13]
Piao S L, Wang X H, Ciais P, et al. 2011. Changes in satellite-derived vegetation growth trend in temperate and boreal Eurasia from 1982 to 2006. Global Change Biology, 17(10): 3228-3239.
doi: 10.1111/gcb.2011.17.issue-10
[14]
Sivapalan M, Savenije H H G, Blöschl G. 2012. Socio-hydrology: A new science of people and water. Hydrological Processes, 26(8): 1270-1276.
doi: 10.1002/hyp.v26.8
[15]
Tucker C J, Pinzon J E, Brown M E, et al. 2005. An extended AVHRR 8-km NDVI dataset compatible with MODIS and SPOT vegetation NDVI data. International Journal of Remote Sensing, 26(20): 4485-4498.
doi: 10.1080/01431160500168686
[16]
Xia J, Dong Y, Zou L. 2022. Developing socio-hydrology: Research progress, opportunities and challenges. Journal of Geographical Sciences, 32(11): 2131-2146.
doi: 10.1007/s11442-022-2040-3
[17]
Yang F C, Xia Z Q, Huang F, et al. 2012. Characteristics of precipitation variation in the Irtysh River Basin. Journal of Hohai University (Natural Sciences), 40(4): 432-437. (in Chinese)
[18]
Yin G, Meng X Y, Wang H, et al. 2017. Spatiotemporal variation of vegetation and its correlation with climate change in Central Asia during 1982-2012. Acta Ecologica Sinica, 37(9): 3149-3163. (in Chinese)
[19]
Yue S, Pilon P, Cavadias G. 2002. Power of the Mann-Kendall and Spearman's rho tests for detecting monotonic trends in hydrological series. Journal of Hydrology, 259(1-4): 254-271.
doi: 10.1016/S0022-1694(01)00594-7
[20]
Zhang W, Yang L, Wu X, et al. 2021. Divergent response of vegetation growth to soil water availability in dry and wet periods over Central Asia. Journal of Geophysical Research: Biogeosciences, 126(6): e2020JG005912, doi: 10.1029/2020JG005912.