Aridity-driven patterns and environmental controls of leaf C:N:P stoichiometry in arid ecosystems of Northwest China
SHI Yangyang1,2, ZHOU Xiaoguo1,2, LIU Quanyu1,3, ZHAO Le1,2, LI Yeye1,4, LI Congjuan1,2,*()
1State Key Laboratory of Ecological Safety and Sustainable Development in Arid Lands, Xinjiang Institute of Ecology and Geography, Chinese Academy of Sciences, Urumqi 830011, China 2University of Chinese Academy of Sciences, Beijing 100049, China 3College of Grassland Science, Xinjiang Agricultural University, Urumqi 830052, China 4Hunan Normal University, Changsha 410081, China
Arid ecosystems occupy approximately 41% of the Earth's land surface and play crucial roles in global carbon (C) sequestration and biodiversity maintenance. However, extreme water limitation and nutrient scarcity in these regions pose significant challenges to plant growth and ecosystem functioning. This study characterized the spatial patterns of leaf C, nitrogen (N), and phosphorus (P) concentrations and their stoichiometric ratios (C:N, C:P, and N:P), identified key climatic and edaphic controls through correlation analyses and linear mixed-effects models, and assessed differences in mediating stoichiometric responses to aridity among plant life forms along a strong aridity gradient in Xinjiang Uygur Autonomous Region, Northwest China. Leaf C, N, and P were quantified for 428 samples representing 315 species across 74 sites spanning an aridity-index (AI) range of 0.03-0.47 during June-August 2024. With increasing aridity, leaf N and P declined significantly, whereas leaf C remained relatively stable, leading to higher C:N and N:P ratios. At the driest sites (AI<0.10), mean leaf N and P concentrations were only 16.61 and 2.02 mg/g, respectively—about 46%-70% (for N) and 60%-75% (for P) lower than both the overall means and the values at mesic sites (AI>0.40). Soil organic carbon (SOC) showed significant positive correlations with leaf N and P. Herbs had higher N and P and lower C:N, C:P, and N:P than shrubs and trees. Mixed-effects models showed that species identity explained approximately 40% of the variance in leaf C, whereas environmental variables explained 13%-16% of variation in leaf N, P, and N:P. Aridity-driven nutrient limitation is governed by coupled climate-soil mechanisms and modulated by plant functional traits; leaf C:N:P stoichiometry is a robust indicator for monitoring and restoration in drylands under climate change. Our findings reveal that intensifying aridity shifts plants toward P-limitation, with important implications for predicting dryland vegetation responses to future warming and for designing effective ecological restoration strategies in arid regions.
Received: 29 September 2025
Published: 30 September 2026
Conceptualization: SHI Yangyang, LI Congjuan; Methodology: LI Congjuan; Formal analysis: SHI Yangyang; Data curation: SHI Yangyang; Investigation: LIU Quanyu, ZHOU Xiaoguo, LI Yeye, ZHAO Le; Writing - original draft: SHI Yangyang; Writing - review & editing: SHI Yangyang, LI Congjuan; Funding acquisition: LI Congjuan; Project administration: LI Congjuan; Supervision: LI Congjuan; Resources: LI Congjuan. All authors approved the manuscript.
SHI Yangyang, ZHOU Xiaoguo, LIU Quanyu, ZHAO Le, LI Yeye, LI Congjuan. Aridity-driven patterns and environmental controls of leaf C:N:P stoichiometry in arid ecosystems of Northwest China. Journal of Arid Land, 2026, 18(9): 1601-1615.
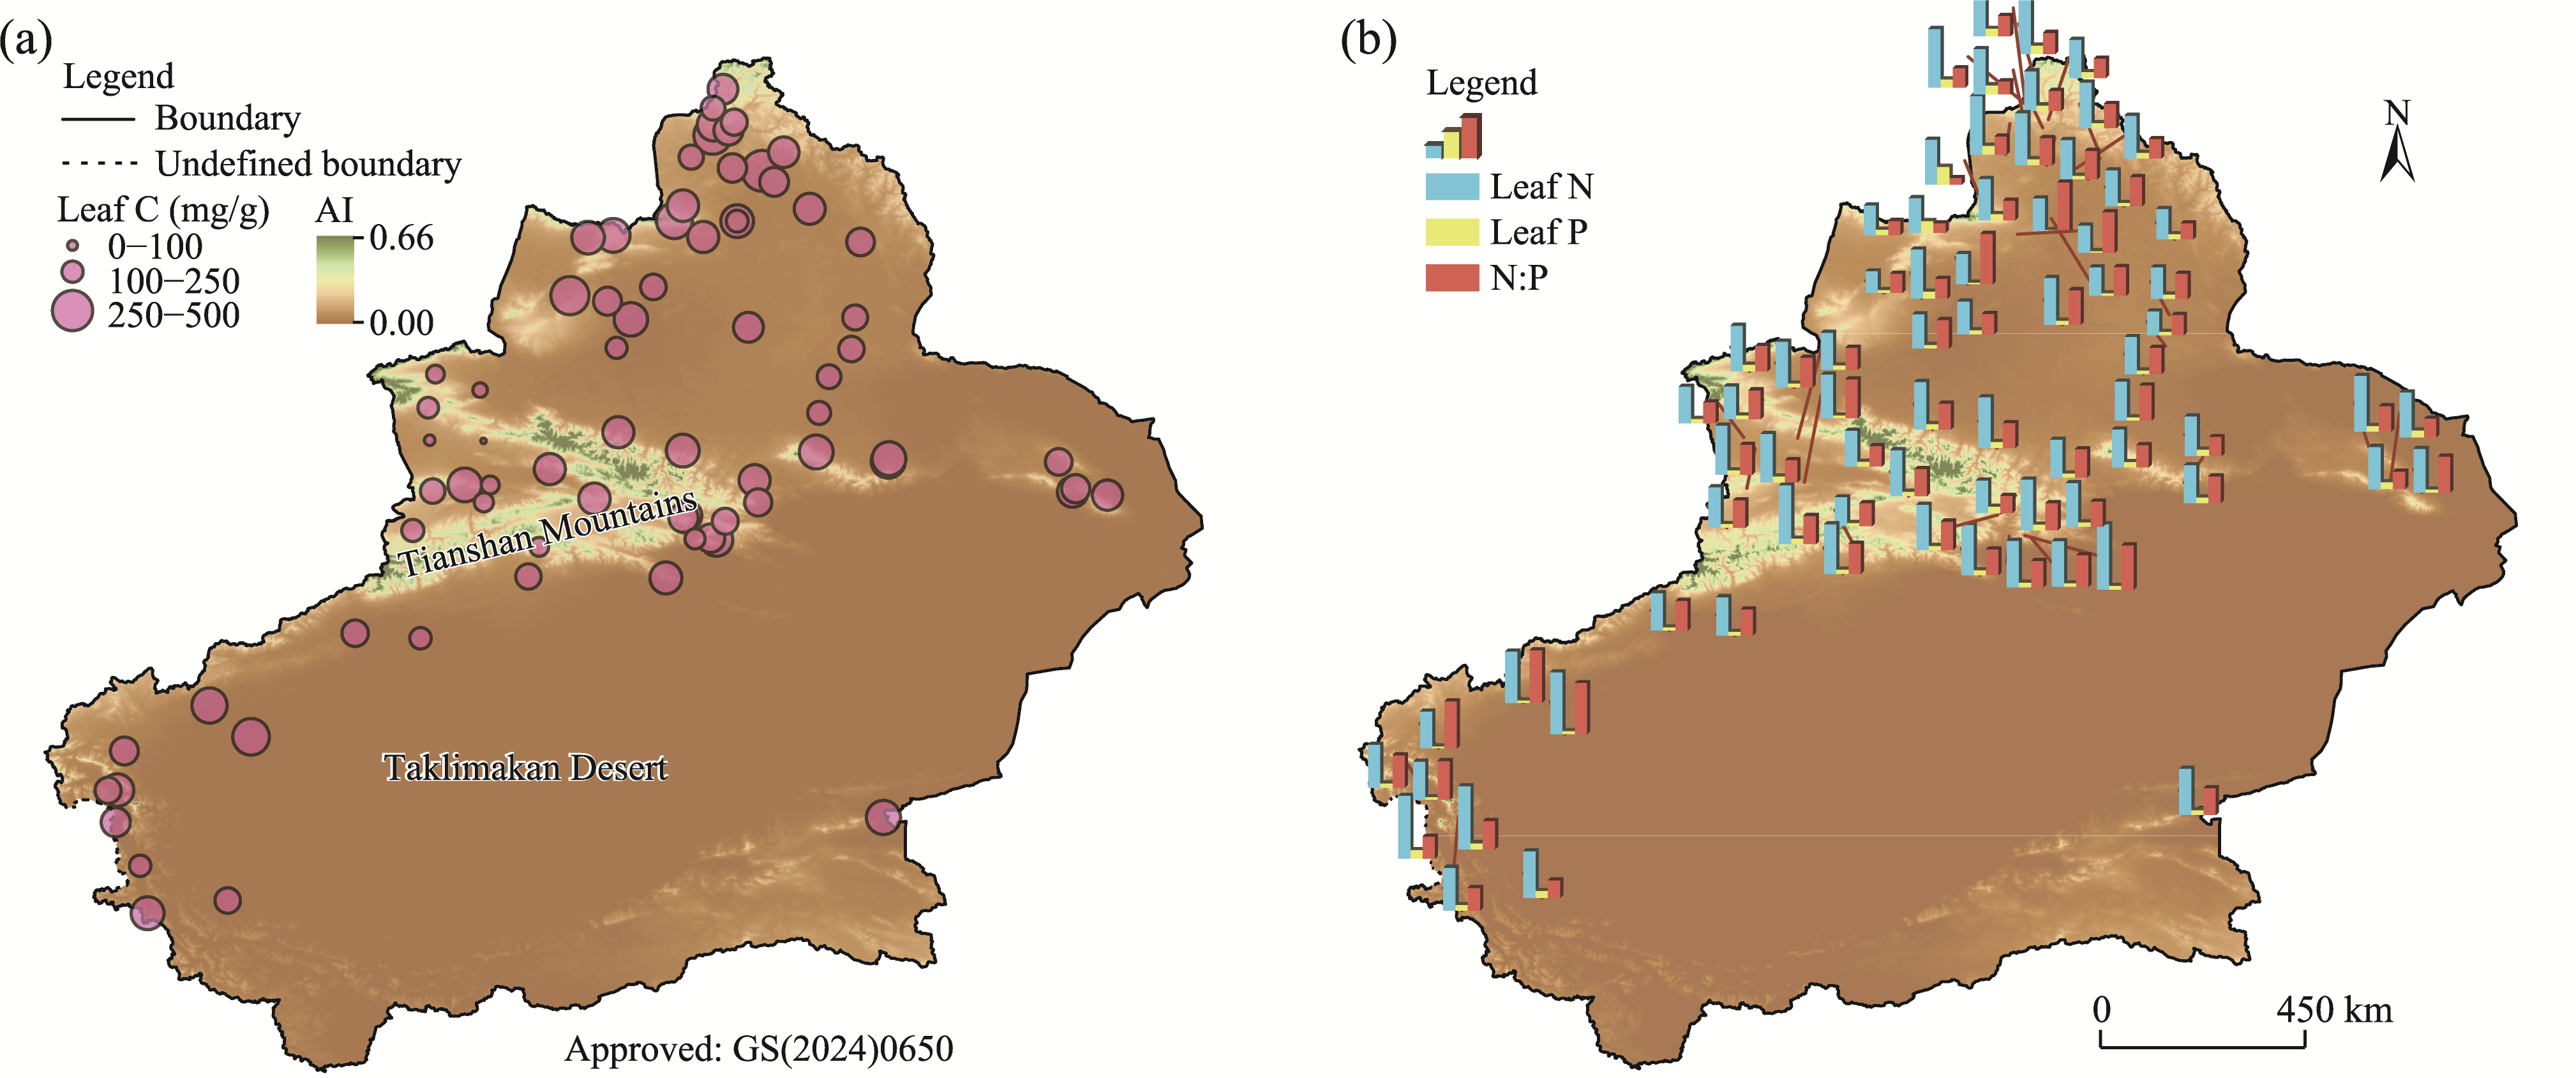
Fig. 1Spatial variation in leaf carbon (C) concentration (a) and leaf nitrogen (N) and phosphorus (P) concentrations and the N:P ratio (b) with the corresponding aridity index (AI). The data points correspond to the 74 sampling sites. In panel (b), bar height reflects the magnitude of each variable. Climatic AI data in 2023 were extracted from the Global AI and Potential Evapotranspiration Database (https://cgiarcsi.community/). Note that this figure is based on the standard map (GS(2024)0650) of the National Platform for Common GeoSpatial Information Services (https://www.tianditu.gov.cn/), and the boundary of the standard map has not been modified.
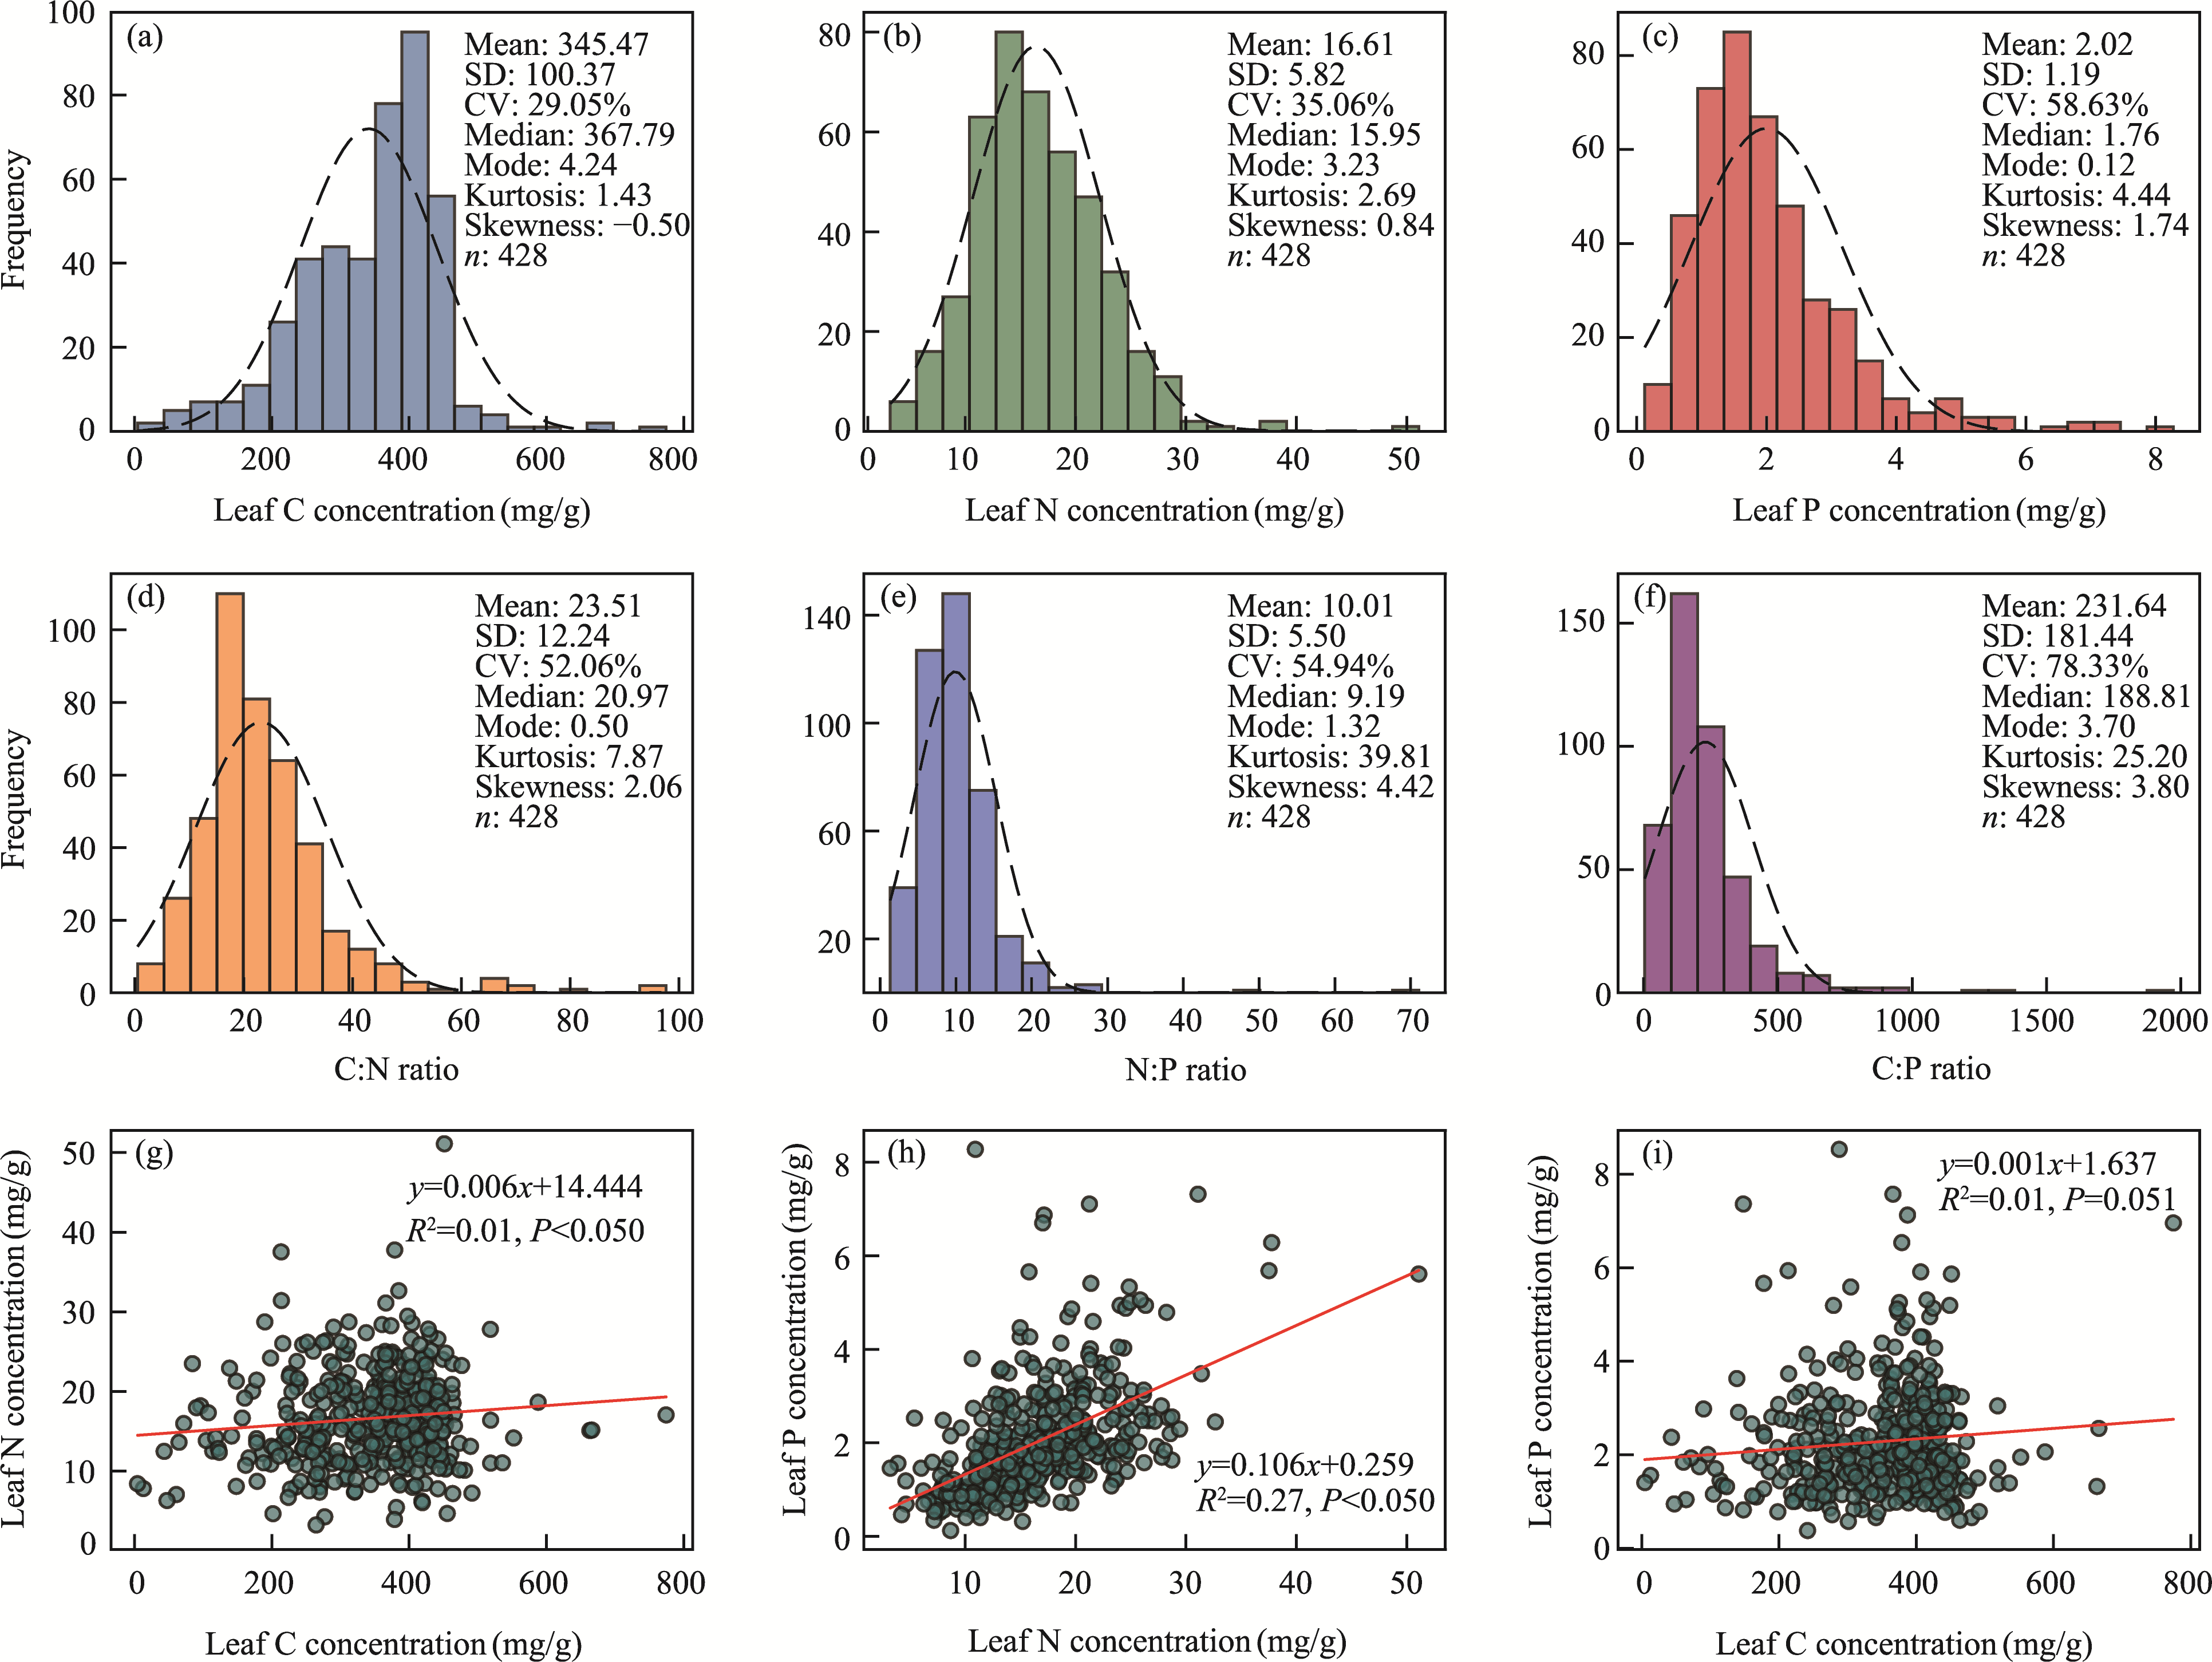
Fig. 2Frequency distributions of leaf C, N, and P concentrations (a-c) and their stoichiometric ratios (d-f), and pairwise relationships between leaf C, N, and P concentrations (g-i) across 428 samples at 74 sampling sites. SD, standard deviation; CV, coefficient of variation.
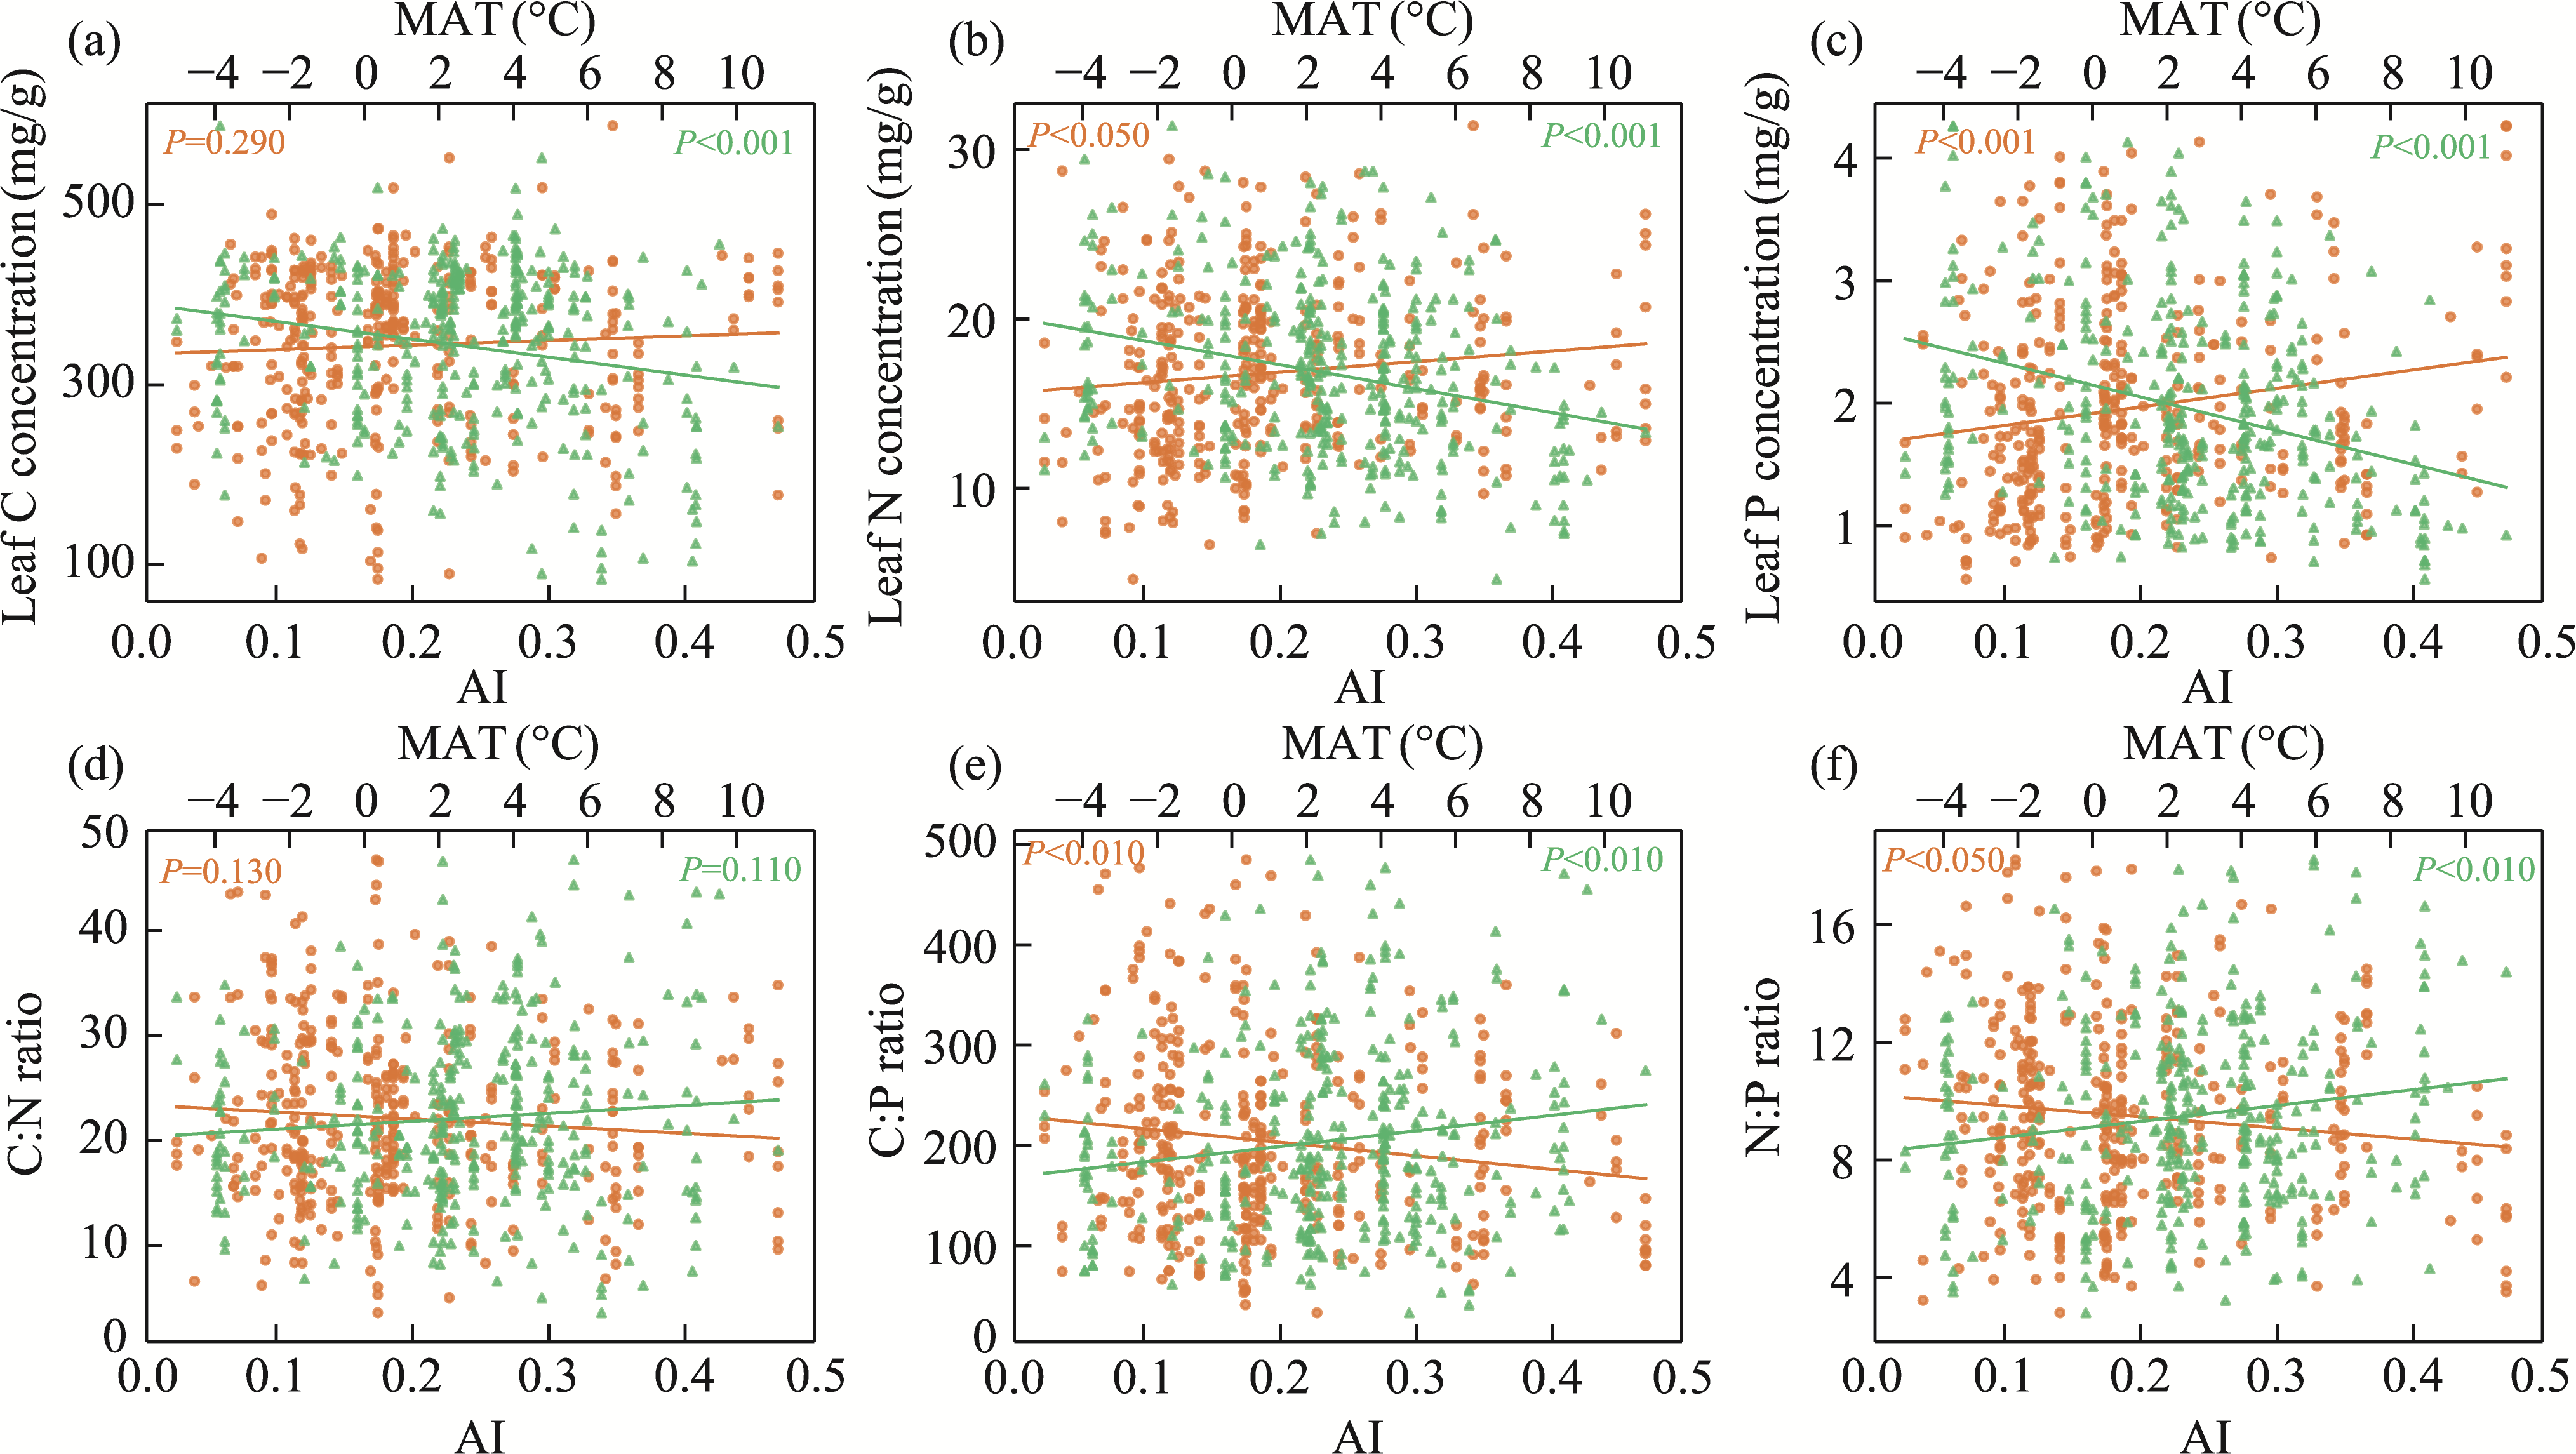
Fig. 3Correlations of leaf C, N, and P concentrations (a-c) and their stoichiometric ratios (d-f) with mean annual temperature (MAT) and AI. MAT-related data points and fitted curves are shown in orange, while AI-related ones are in green.
Factor
Leaf C
Leaf N
Leaf P
C:N
C:P
N:P
Longitude
0.21***
-0.04
0.10*
0.20***
0.22
0.02***
Latitude
-0.03
-0.05
0.15**
-0.07
-0.08**
-0.01***
Elevation
0.11*
0.21***
0.10*
-0.08
-0.01
-0.05
MAP
-0.02
0.16***
0.17***
-0.15**
-0.18***
-0.10*
MAT
-0.13**
-0.29***
-0.31***
0.11*
0.18***
0.14**
AI
0.03
0.22***
0.23***
-0.15**
-0.19***
-0.12*
STP
0.07
0.03
0.04
-0.08
-0.08
-0.01
STN
-0.08
0.10*
0.16**
-0.03
-0.11*
-0.12*
SWC
0.04
0.22***
0.18***
0.15**
-0.13**
-0.04
EC
-0.13**
-0.04
-0.22***
-0.09
-0.11*
0.23***
pH
-0.15**
-0.05
-0.24***
-0.07
-0.14**
0.26***
SOC
0.09***
0.21***
0.11*
-0.05
-0.02
0.02
Table 1 Spearman correlations between leaf stoichiometric traits and environmental factors
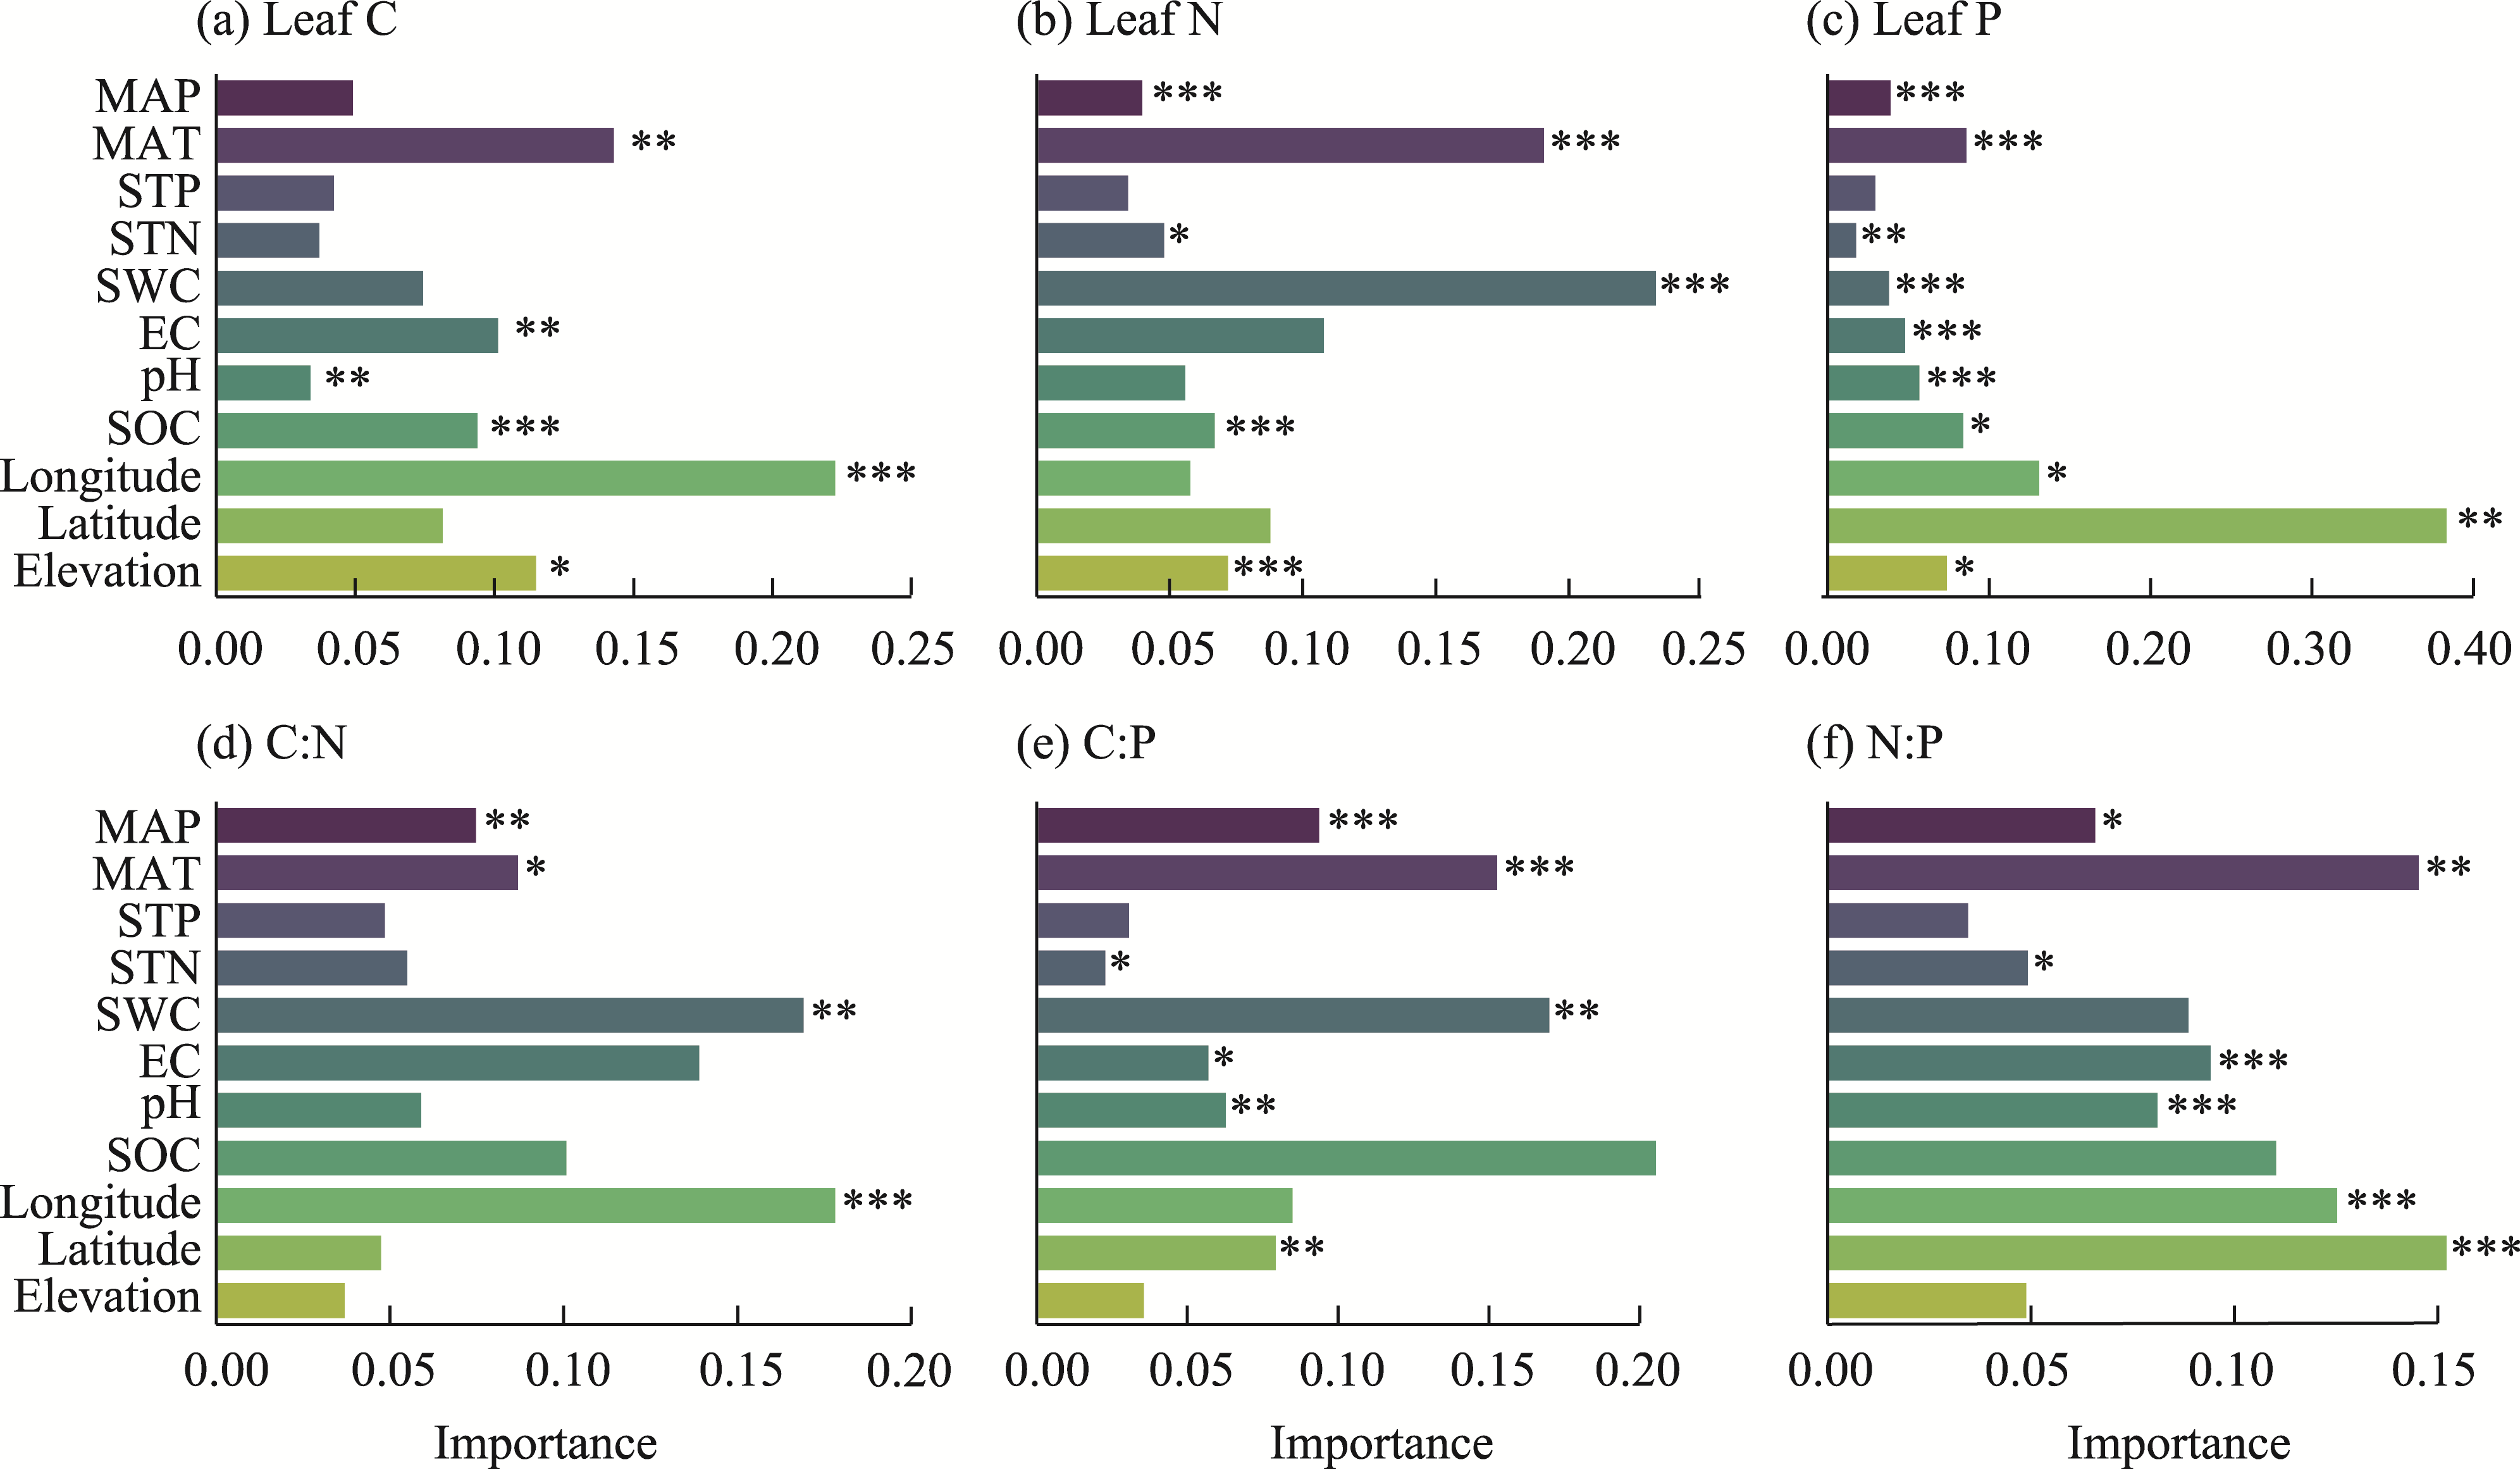
Fig. 4Random forest modeling showing variable importance for predicting leaf C, N, and P concentrations (a-c) and their stoichiometric ratios (d-f). *, P<0.050 level; **, P<0.010 level; ***, P<0.001 level.
Fig. 5Relationships of leaf C, N, and P concentrations (a-c) and their stoichiometric ratios (d-f) with AI for different plant life forms. Herb-related data points and fitted curves are shown in blue, shrub-related ones are in orange, tree-related ones are in green, while all plant-life-form-related ones are in red.
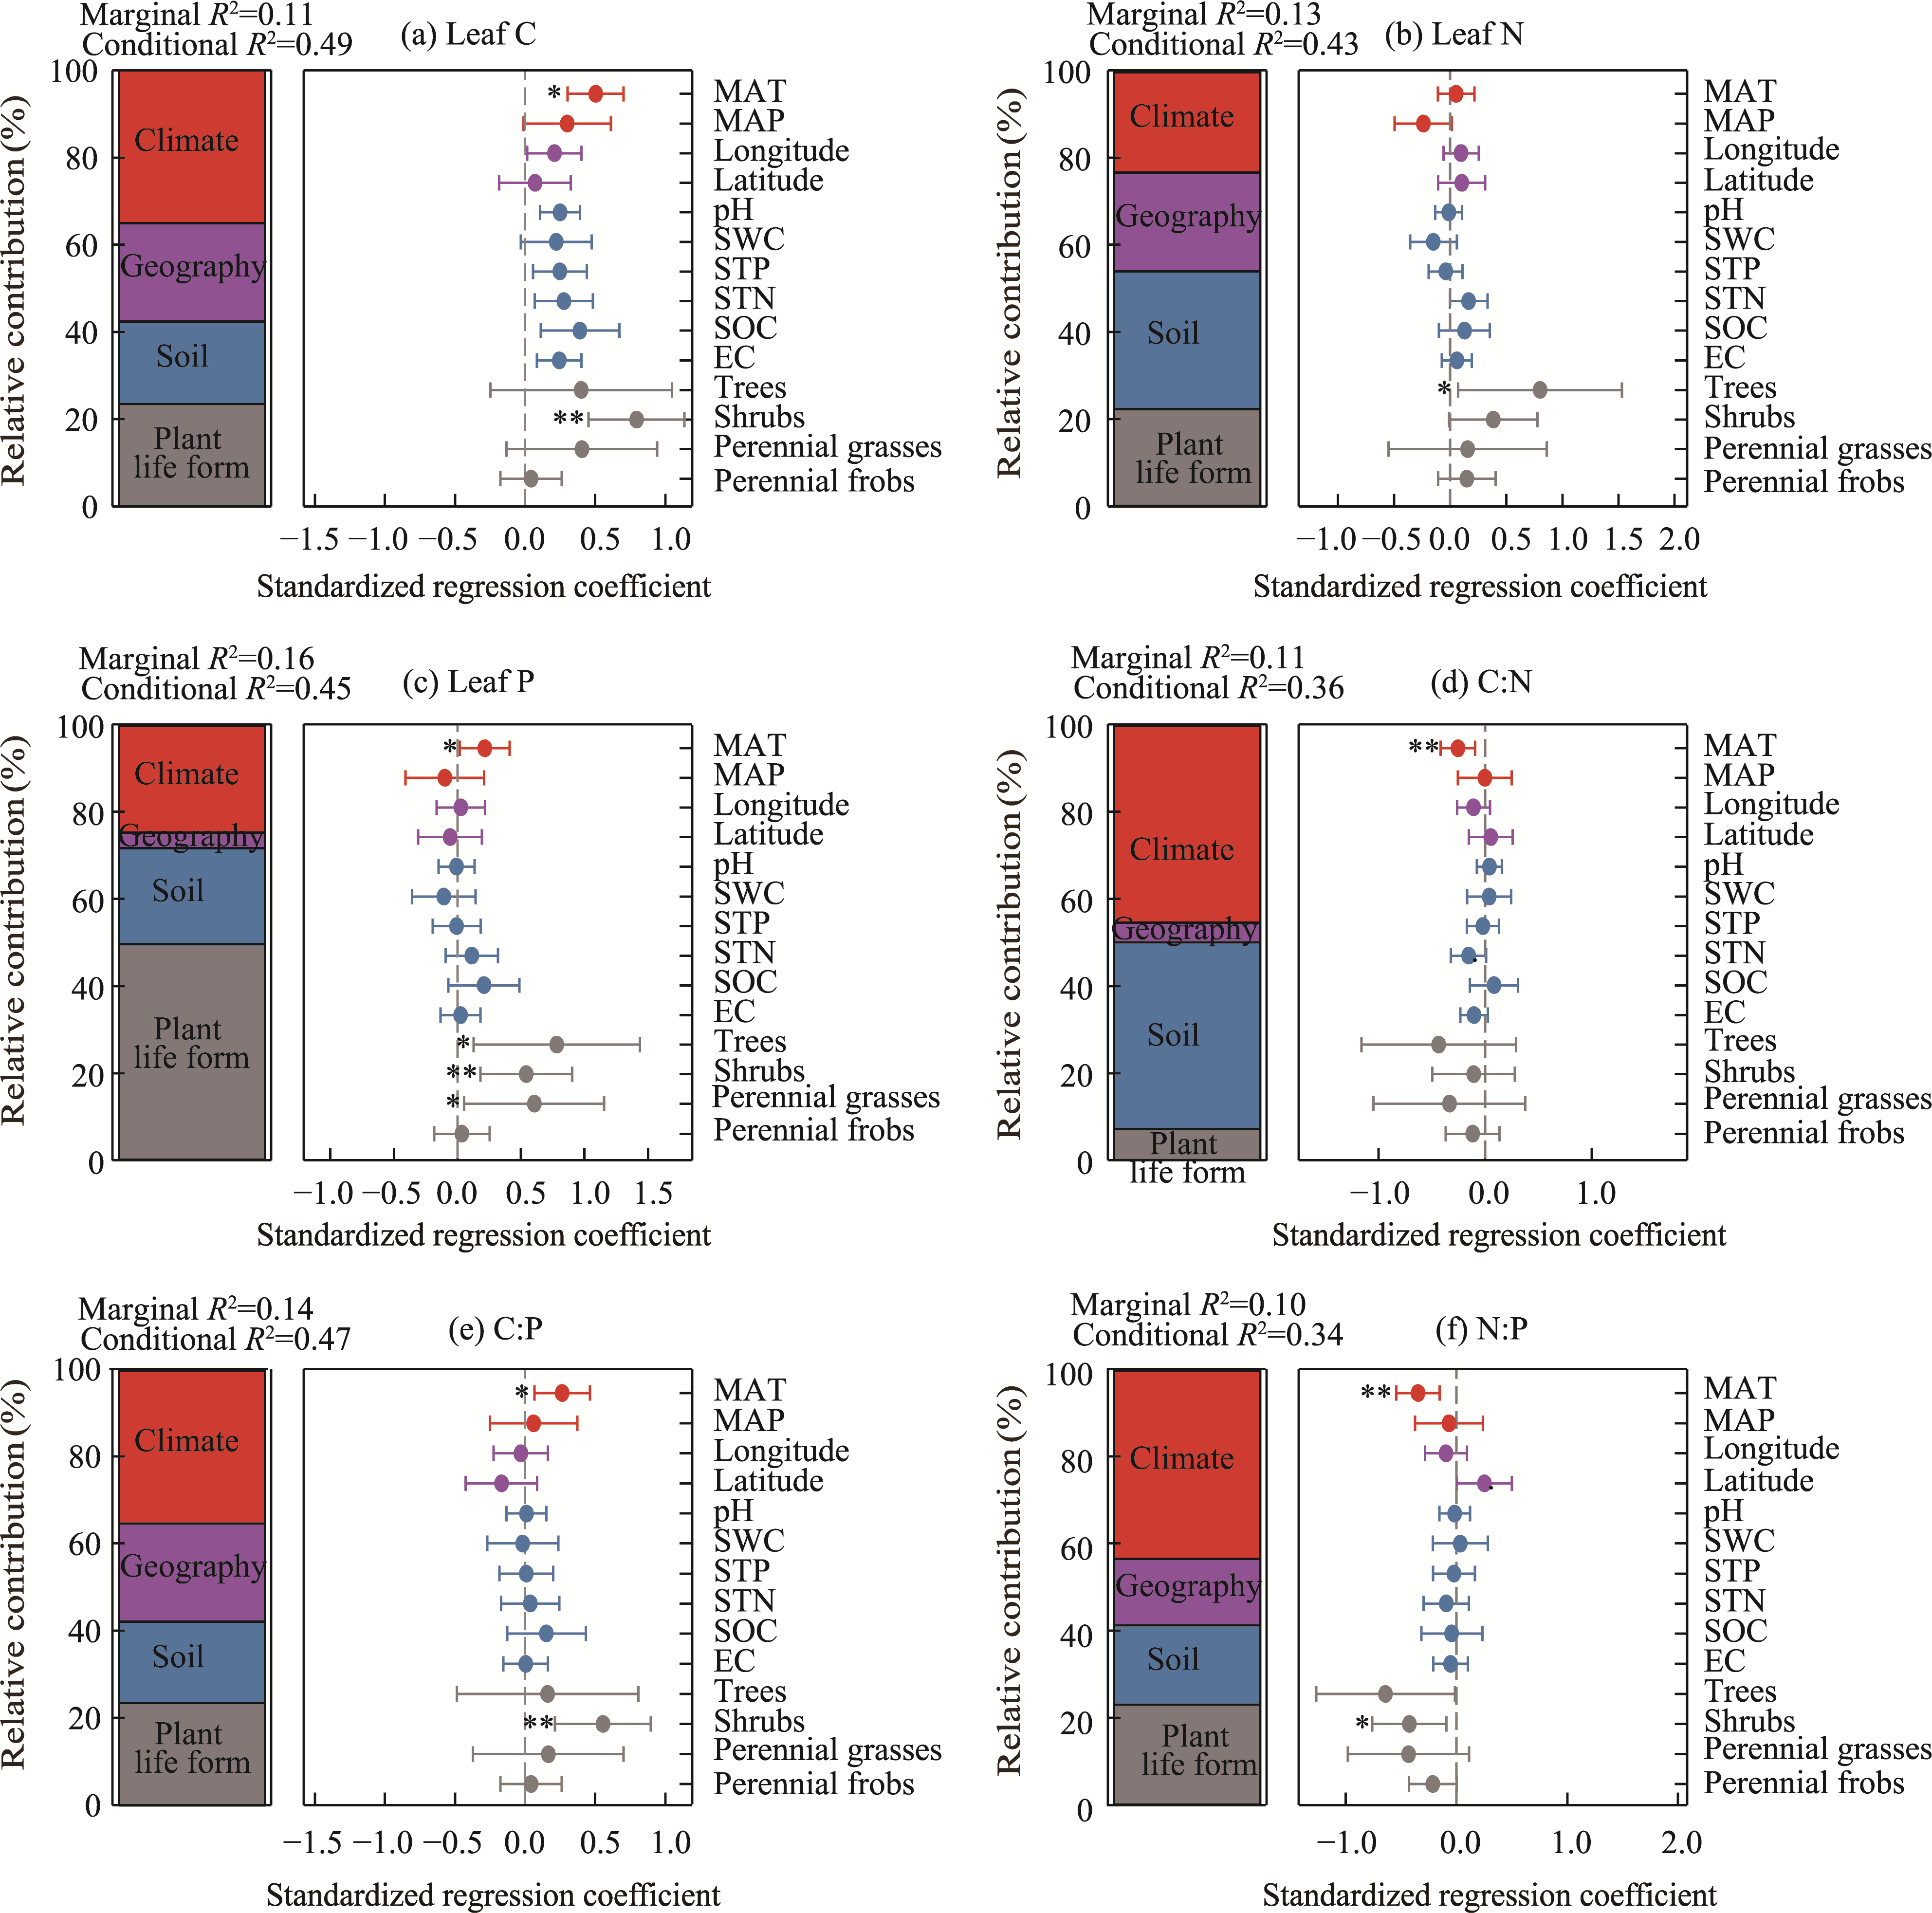
Fig. 6Relative contributions of environmental factors to the variation in leaf C, N, and P concentrations (a-c) and their stoichiometric ratios (d-f). Effect sizes of the model predictors are presented as standardized regression coefficients with 95% confidence intervals, and variables in the same category are shown in the same color. Stacked bar chart shows the percentages of variance explained for each set of predictor variables. Marginal R2, variance explained by fixed factors; conditional R2, variance explained by both fixed and random factors. *, P<0.050 level; **, P<0.010 level.
[1]
Acuña-Acosta D M, Castellanos A E, Llano-Sotelo J M, et al. 2024. Higher phosphorus and water use efficiencies and leaf stoichiometry contribute to legume success in drylands. Functional Ecology, 38(10): 2271-2285.
[2]
Aerts R, Chapin F S. 1999. The mineral nutrition of wild plants revisited: A re-evaluation of processes and patterns. Advances in Ecological Research, 30: 1-67.
[3]
Bates D, Mächler M, Bolker B, et al. 2015. Fitting linear mixed-effects models using lme4. Journal of Statistical Software, 67(1): 1-48.
[4]
Cai C Y, Sun W, Bai T, et al. 2025. Spatial analysis of Picea schrenkiana var. tianschanica: biomass in the Tianshan Mountains, Xinjiang. Forests, 16(1): 3, doi: 10.3390/f16010003.
[5]
Chen H M, Li W J, Qiu J, et al. 2023. A checklist of wild vascular plants in Xinjiang, China. Biodiversity Science, 31: 23124, doi: 10.17520/biods.2023124.
[6]
Chen Y, Li Y Q, Wang L L, et al. 2024. Heterogeneity of leaf stoichiometry of different life forms along environmental transects in typical ecologically fragile areas of China. Science of The Total Environment, 910: 168495, doi: 10.1016/j.scitotenv.2023.168495.
[7]
Delgado-Baquerizo M, Maestre F T, Gallardo A, et al. 2013. Decoupling of soil nutrient cycles as a function of aridity in global drylands. Nature, 502(7473): 672-676.
[8]
Delgado-Baquerizo M, Eldridge D J, Maestre F T, et al. 2018. Aridity decouples C:N:P stoichiometry across multiple trophic levels in terrestrial ecosystems. Ecosystems, 21(3): 459-468.
[9]
Duan X G. 2023. Stoichiometric characteristics of woody plant leaves and responses to climate and soil factors in China. PLoS ONE, 18(9): e0291957, doi: 10.1371/journal.pone.0291957.
[10]
Fan X K, Yan X, Qian C J, et al. 2020. Leaf size variations in a dominant desert shrub, Reaumuria soongarica, adapted to heterogeneous environments. Ecology and Evolution, 10(18): 10076-10094.
[11]
Feng S, Fu Q. 2013. Expansion of global drylands under a warming climate. Atmospheric Chemistry and Physics, 13(19): 10081-10094.
[12]
Fox J, Weisberg S. 2019. An R Companion to Applied Regression (3rd ed.). Thousand Oaks: SAGE Publications.
[13]
Güsewell S. 2004. N:P ratios in terrestrial plants: variation and functional significance. New Phytologist, 164(2): 243-266.
[14]
Han W X, Fang J Y, Guo D L, et al. 2005. Leaf nitrogen and phosphorus stoichiometry across 753 terrestrial plant species in China. New Phytologist, 168(2): 377-385.
[15]
He J S, Wang L, Flynn D F B, et al. 2008. Leaf nitrogen:phosphorus stoichiometry across Chinese grassland biomes. Oecologia, 155(2): 301-310.
[16]
He M Z, Dijkstra F A, Zhang K, et al. 2014. Leaf nitrogen and phosphorus of temperate desert plants in response to climate and soil nutrient availability. Scientific Reports, 4: 6932, doi: 10.1038/srep06932.
[17]
Helmke P A, Sparks D L. 1996. Lithium, sodium, potassium, rubidium, and cesium. In: Sparks DL, Page AL, Helmke PA, et al. Methods of Soil Analysis:Part 3 Chemical Methods. Madison: Soil Science Society of America, 551-574.
[18]
Hong S Y, Chen J, Biswas A, et al. 2024. Leaf stoichiometry of common species along altitude gradients in the Qilian Mountains, China. Journal of Plant Ecology, 17(1): rtad044, doi: 10.1093/jpe/rtad044.
[19]
Hu W F, Yao J Q, He Q, et al. 2021. Changes in precipitation amounts and extremes across Xinjiang (northwest China) and their connection to climate indices. PeerJ, 9: e10792, doi: 10.7717/peerj.10792.
[20]
Huang J H, Liu C R, Guo Z J, et al. 2018. Seed plant features, distribution patterns, diversity hotspots, and conservation gaps in Xinjiang, China. Nature Conservation, 27: 1-15.
[21]
Huang J P, Yu H P, Guan X D, et al. 2016. Accelerated dryland expansion under climate change. Nature Climate Change, 6(2): 166-171.
[22]
Jiang X Y, Jia X, Gao S J, et al. 2021. Plant nutrient contents rather than physical traits are coordinated between leaves and roots in a desert shrubland. Frontiers in Plant Science, 12: 734775, doi: 10.3389/fpls.2021.734775.
[23]
Khan A, Liu X D, Waseem M, et al. 2024. Divergent nitrogen, phosphorus, and carbon concentrations among growth forms, plant organs, and soils across three different desert ecosystems. Forests, 15(4): 607, doi: 10.3390/f15040607.
[24]
LeBauer D S, Treseder K K. 2008. Nitrogen limitation of net primary productivity in terrestrial ecosystems is globally distributed. Ecology, 89(2): 371-379.
[25]
Liu J Y, Wang C, Tao Y, et al. 2025. Spatial patterns and environmental drivers of leaf litter nutrients in Nitraria tangutorum and Nitraria sphaerocarpa in the desert region of northwestern China. Sustainability, 17(18): 8405, doi: 10.3390/su17188405.
[26]
Lu J N, Liu K J, Wang R X, et al. 2022. Research advances in stoichiometry of desert plant-soil system in China. Journal of Desert Research, 42(2): 173-184. (in Chinese)
[27]
Lu J N, Zhao X Y, Wang S K, et al. 2023. Untangling the influence of abiotic and biotic factors on leaf C, N, and P stoichiometry along a desert-grassland transition zone in northern China. Science of The Total Environment, 884: 163902, doi: 10.1016/j.scitotenv.2023.163902.
[28]
Luo J L, Li J L, Sun Y, et al. 2025. Differential resource acquisition strategies of herbaceous and woody plants in temperate forests. BMC Plant Biology, 26: 196, doi: 10.1186/s12870-025-08026-z.
[29]
Luo Y, Peng Q W, Li K H, et al. 2021. Patterns of nitrogen and phosphorus stoichiometry among leaf, stem and root of desert plants and responses to climate and soil factors in Xinjiang, China. CATENA, 199: 105100, doi: 10.1016/j.catena.2020.105100.
[30]
McKenzie H A, Wallace H S. 1954. The Kjeldahl determination of nitrogen: A critical study of digestion conditions-temperature, catalyst, and oxidizing agent. Australian Journal of Chemistry, 7(1): 55-70.
[31]
Middleton N, Thomas D. 1997. World Atlas of Desertification (2nd ed.). London: Arnold.
[32]
Nakagawa S, Schielzeth H. 2013. A general and simple method for obtaining R2 from generalized linear mixed-effects models. Methods in Ecology and Evolution, 4(2): 133-142.
[33]
National Research Council. 1992. Grasslands and Grassland Sciences in Northern China. Washington D.C.: National Academies Press.
[34]
O'Brien R M. 2007. A caution regarding rules of thumb for variance inflation factors. Quality & Quantity, 41(5): 673-690.
[35]
Qin Y Y, Feng Q, Adamowski J F, et al. 2021. Community level response of leaf stoichiometry to slope aspect in a montane environment: A case study from the Central Qilian Mountains, China. Global Ecology and Conservation, 28: e01703, doi: 10.1016/j.gecco.2021.e01703.
[36]
Reich P B, Walters M B, Ellsworth D S. 1997. From tropics to tundra: Global convergence in plant functioning. Proceedings of the National Academy of Sciences of the United States of America, 94(25): 13730-13734.
[37]
Reich P B, Oleksyn J. 2004. Global patterns of plant leaf N and P in relation to temperature and latitude. Proceedings of the National Academy of Sciences of the United States of America, 101(30): 11001-11006.
[38]
Reich P B. 2014. The world-wide 'fast-slow' plant economics spectrum: a traits manifesto. Journal of Ecology, 102(2): 275-301.
[39]
Sardans J, Peñuelas J. 2012. The role of plants in the effects of global change on nutrient availability and stoichiometry in the plant-soil system. Plant Physiology, 160(4): 1741-1761.
[40]
Schielzeth H. 2010. Simple means to improve the interpretability of regression coefficients. Methods in Ecology and Evolution, 1(2): 103-113.
[41]
Schlesinger W H, Reynolds J F, Cunningham G L, et al. 1990. Biological feedbacks in global desertification. Science, 247(4946): 1043-1048.
[42]
Schumacher B A. 2002. Methods for the Determination of Total Organic Carbon (TOC) in Soils and Sediments. Washington D.C.: United States Environmental Protection Agency, 1-61.
[43]
Sterner R W, Elser J J. 2002. Ecological Stoichiometry:The Biology of Elements from Molecules to the Biosphere. Princeton & Oxford: Princeton University Press.
[44]
Tariq A, Graciano C, Sardans J, et al. 2024. Plant root mechanisms and their effects on carbon and nutrient accumulation in desert ecosystems under changes in land use and climate. New Phytologist, 242(3): 916-934.
[45]
Tian D, Reich P B, Bai S, et al. 2024. Environmental versus phylogenetic controls on leaf nitrogen and phosphorous concentrations in vascular plants. Nature Communications, 15(1): 5346, doi: 10.1038/s41467-024-49665-4.
[46]
Vitousek P M, Menge D N L, Reed S C, et al. 2013. Biological nitrogen fixation: rates, patterns and ecological controls in terrestrial ecosystems. Philosophical Transactions of the Royal Society B: Biological Sciences, 368(1621): 20130119, doi: 10.1098/rstb.2013.0119.
[47]
Wang C, Geng Y, Sardans J, et al. 2025. Coordinated variation in elemental composition and morphology in leaves, but independence in roots across Chinese grasslands. Journal of Ecology, 113(2): 418-432.
[48]
Wang Y, Xu Z L. 2024. Leaf carbon, nitrogen, and phosphorus ecological stoichiometry of grassland ecosystems along 2,600-m altitude gradients at the northern slope of the Tianshan Mountains. Frontiers in Plant Science, 15: 1430877, doi: 10.3389/fpls.2024.1430877.
[49]
Wright I J, Reich P B, Westoby M, et al. 2004. The worldwide leaf economics spectrum. Nature, 428(6985): 821-827.
[50]
Wu J Z, Dong L B, Li J W, et al. 2025. Patterns and drivers of plant C:N:P stoichiometry across a 3000 km aridity gradient. Ecological Informatics, 90: 103221, doi: 10.1016/j.ecoinf.2025.103221.
[51]
Xu H Y, Wang H, Prentice L C, et al. 2023. Leaf carbon and nitrogen stoichiometric variation along environmental gradients. Biogeosciences, 20(22): 4511-4526.
[52]
Xue W, Li Y, Xu G Q. 2024. Response of two dominant woody species to groundwater depth at the transition zone between desert and oasis. Ecological Indicators, 166: 112278, doi: 10.1016/j.ecolind.2024.112278.
[53]
Yang S, Shi Z Y, Zhang M H, et al. 2021. Stoichiometry of carbon, nitrogen and phosphorus in shrub organs linked closely with mycorrhizal strategy in Northern China. Frontiers in Plant Science, 12: 687347, doi: 10.3389/fpls.2021.687347.
[54]
Yang Y, Liu B R, An S S. 2018. Ecological stoichiometry in leaves, roots, litters and soil among different plant communities in a desertified region of Northern China. CATENA, 166: 328-338.
[55]
Zhang S H, Chen Y S, Lu Y X. et al. 2024. C:N:P stoichiometric characteristics and drivers of surface soil in the drylands of China. Environmental Earth Sciences, 83: 270, doi: 10.1007/s12665-024-11489-2.
[56]
Zhao G X, Tariq A, Mu Z B, et al. 2025. Allocation patterns and strategies of carbon, nitrogen, and phosphorus densities in three typical desert plants. Plants, 14(11): 1595, doi: 10.3390/plants14111595.
[57]
Zhao N, He N P, Wang Q F, et al. 2014. The altitudinal patterns of leaf C:N:P stoichiometry are regulated by plant growth form, climate and soil on Changbai Mountain, China. PLoS ONE, 9(4): e95196, doi: 10.1371/journal.pone.0095196.
[58]
Zuur A F, Ieno E N, Elphick C S. 2010. A protocol for data exploration to avoid common statistical problems. Methods in Ecology and Evolution, 1(1): 3-14.