Spatiotemporal evolution of ecological security patterns in a typical arid region based on XGBoost and multisource data: A case study of Xinjiang
LUO Lei1, HUANG Wei1, SHI Jinli1,2, LIU Bowen1, XI Yunyun1, XU Liping1,*(), CUI Linlin1
1School of Urban and Environmental Studies, Shihezi University, Shihezi 832003, China 2School of Country and Region Studies, Northwest University, Xi'an 710127, China
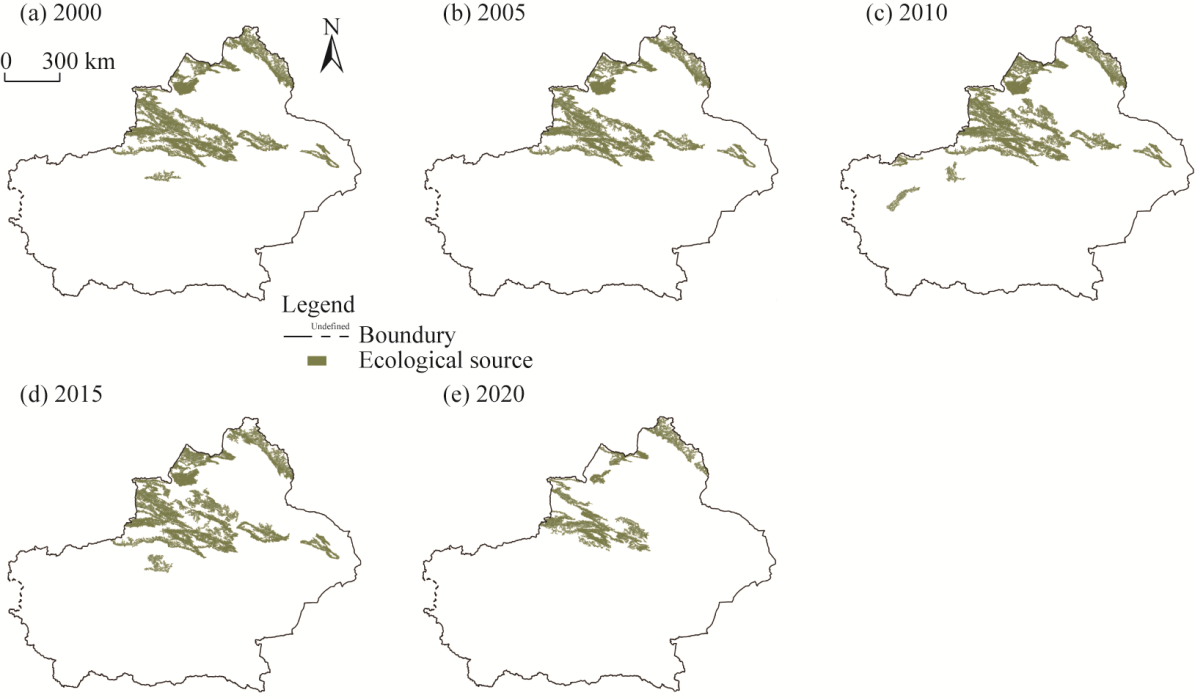
The establishment of a regional ecological security pattern (ESP) is crucial for the sustainable development of Xinjiang Uygur Autonomous Region (hereinafter referred as to Xinjiang), China, which is characterized by a fragile ecological foundation and a highly vulnerable ecosystem. However, traditional ESP frameworks often insufficiently account for long-term environmental changes because landscape connectivity is not fully integrated into ecological source identification. They also struggle to capture the cumulative and spatially heterogeneous impacts of human disturbances on ecological resistance surfaces. To bridge these gaps, we developed an advanced ESP framework for Xinjiang—a vast and ecologically sensitive arid region—covering a 20 a span from 2000 to 2020. We identified ecological sources through a comprehensive assessment of ecosystem services (ESs) and landscape connectivity while simultaneously establishing an ecological resistance surface using an extreme gradient boosting (XGBoost) model integrated with the human activity intensity (HAI) index. Finally, ecological corridors were determined via the minimum cumulative resistance (MCR) model and prioritized using the gravity model to thoroughly determine the network evolution. Validation revealed that the XGBoost model achieved a robust accuracy of 0.7388-0.7995 indicating its superior applicability in resistance surface construction. The HAI consistently increased, peaking along the Northern Slope Economic Belt of the Tianshan Mountains and in urban areas of the Tarim Basin. All ESs displayed significant spatial heterogeneity, with high-value clusters in the north and much lower intensities in the south. Driven by intensifying human pressure, the spatial share of ecological sources decreased from 8.81% to 4.57%, with increased landscape fragmentation. Ecological source fragmentation was more severe in 2020, whereas ecological source stability was stronger in 2015. In 2015, the core corridors reached a maximum share of 44.44%, despite their minimum absolute quantity. Conversely, in 2020, the total number of corridors peaked, while the proportion of core corridors decreased to 17.64%. This divergent trend reveals that between 2015 and 2020, larger ecological sources were heavily compromised by external factors, leading to severe source fragmentation and a subsequent loss of corridor connectivity. These findings suggest that ecological management in Xinjiang must shift toward differentiated zonation, prioritizing intensive corridor restoration on the northern slope of the Tianshan Mountains and stricter boundaries for agricultural and urban expansion in the Tarim Basin.
Received: 16 March 2026
Published: 31 October 2026
The first and second authors contributed equally to this work.
Conceptualization: LUO Lei, HUANG Wei, SHI Jinli; Software: LUO Lei; Visualization: LUO Lei; Data curation: HUANG Wei, SHI Jinli; Investigation: LIU Bowen; Writing - original draft: LUO Lei, HUANG Wei; Writing - review & editing: SHI Jinli, XI Yunyun, XU Liping, CUI Linlin; Funding acquisition: XU Liping; Resources: XU Liping, CUI Linlin; Supervision: XU Liping, CUI Linlin. All authors approved the manuscript.
LUO Lei, HUANG Wei, SHI Jinli, LIU Bowen, XI Yunyun, XU Liping, CUI Linlin. Spatiotemporal evolution of ecological security patterns in a typical arid region based on XGBoost and multisource data: A case study of Xinjiang. Journal of Arid Land, 2026, 18(10): 1693-1719.
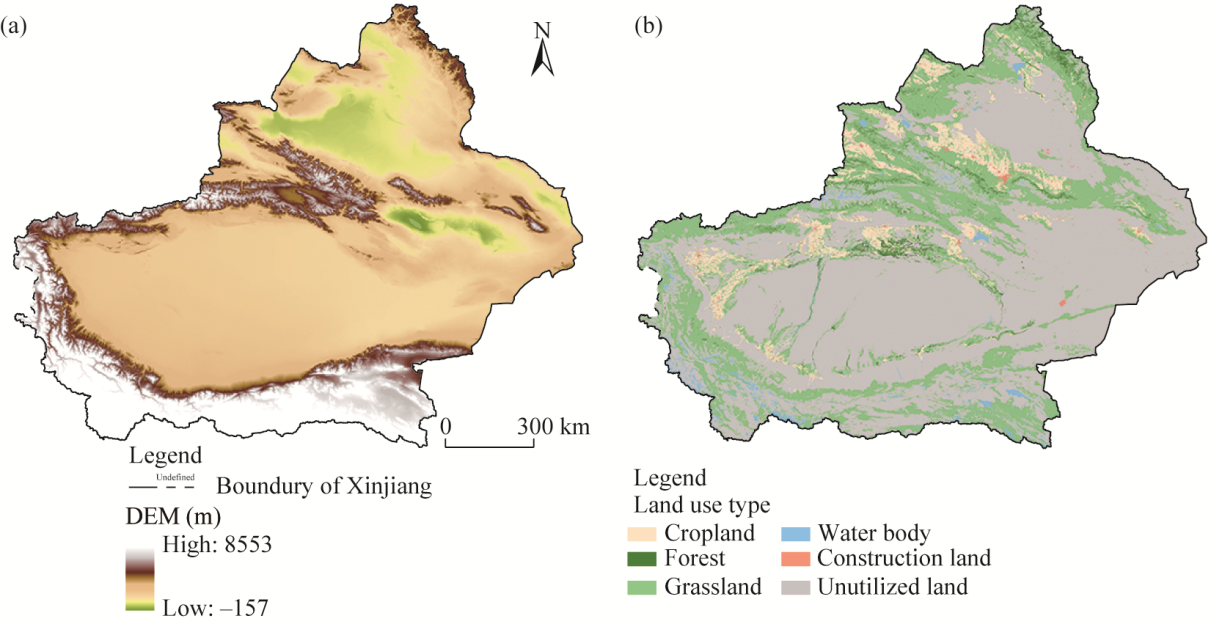
Fig. 1Distributions of elevation (a) and land use type (b) in Xinjiang Uygur Autonomous Region, China. Noted that the figure is based on the standard map (No. GS(2024)0650) provided by the National Platform for Common Geospatial Information Services (http://bzdt.ch.mnr.gov.cn/), and the boundary of the base map has not been modified. DEM, digital elevation model.
Indicator
Year
Source
Night light index (NLI)
2000-2020
2000-2013: DMSP-OLS nighttime light data, Resource and Environmental Science Data Platform, Chinese Academy of Sciences (https://www.resdc.cn/) and 2014-2020: DMSP-OLS-like nighttime light data converted from SNPP-VIIRS, National Earth System Science Data Center (https://www.geodata.cn)
Land use/land cover (LULC)
2000-2020
Resource and Environmental Science Data Platform, Chinese Academy of Sciences (https://www.resdc.cn/)
Carbon emission (t C/(cell•a))
2000-2020
Open-Data Inventory for Anthropogenic Carbon dioxide (ODIAC) Fossil Fuel CO2 Emissions Dataset (https://www.nies.go.jp/doi/10.17595/20170411.001-e.html)
Population density (PD; persons/km2)
2000-2020
Resource and Environmental Science Data Platform, Chinese Academy of Sciences (https://www.resdc.cn/)
Gross domestic production (GDP) of Xinjiang Uygur Autonomous Region (×104 CNY/km2)
2000-2020
Resource and Environmental Science Data Platform, Chinese Academy of Sciences (https://www.resdc.cn/)
Normalized difference vegetation index (NDVI)
2000-2020
China Annual NDVI and enhanced vegetation index (EVI) 1 km Dataset: (https://www.resdc.cn/DOI/DOI.aspx?DOIID=49)
Soil properties
Static
Harmonized World Soil Database (HWSD) v 1.2 (https://www.fao.org/soils-portal/data-hub/soil-maps-and-databases/harmonized-world-soil-database-v12/en/)
Temperature (℃)
2000-2020
National Earth System Science Data Center (https://www.geodata.cn)
Potential evapotranspiration (mm)
2000-2020
National Earth System Science Data Center (https://www.geodata.cn)
Precipitation (mm)
2000-2020
National Earth System Science Data Center (https://www.geodata.cn)
Digital elevation model (DEM; m)
2000 (static)
Resource and Environmental Science Data Platform, Chinese Academy of Sciences (https://www.resdc.cn/)
Soil erosion intensity (SEI)
1995 (static)
Resource and Environmental Science Data Platform, Chinese Academy of Sciences (https://www.resdc.cn/)
Grain production (×104 t)
2000-2020
Bureau of Statistics of Xinjiang Uygur Autonomous Region (2001-2021)
Table 1 Data sources
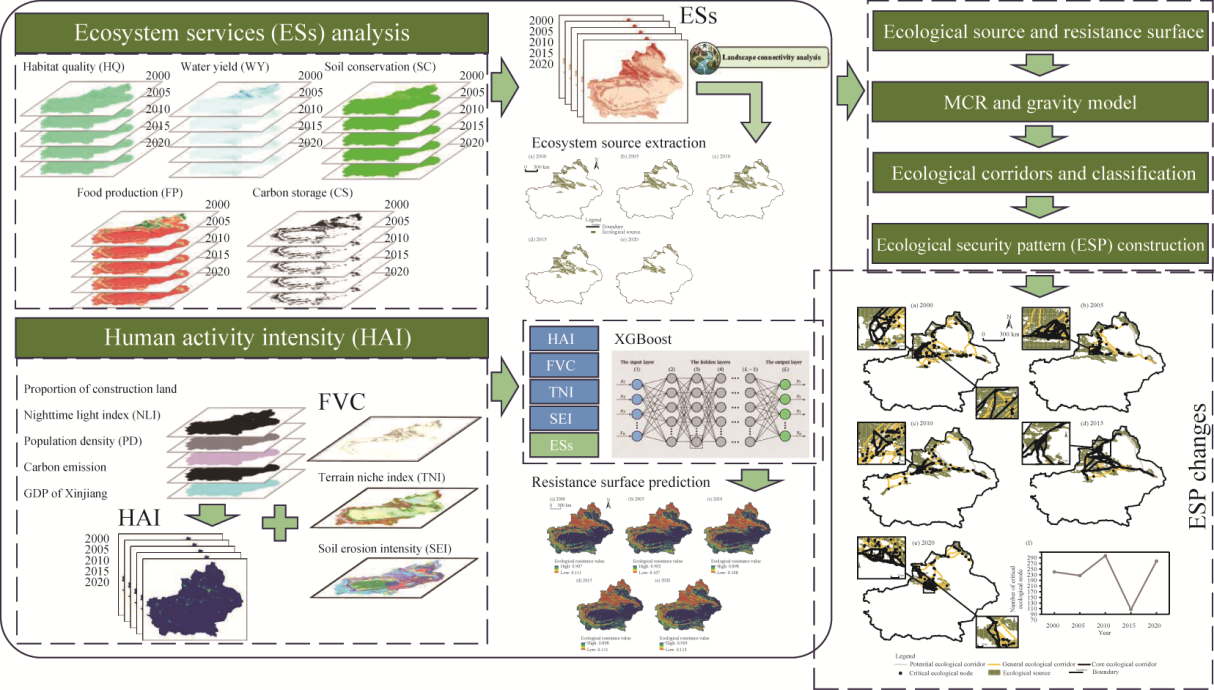
Fig. 2Research framework. GDP, gross domestic production; FVC, fractional vegetation cover; TNI, terrain niche index; MCR, Minimum Cumulative Resistance; XGBoost, extreme gradient boosting. FVC was calculated by normalized difference vegetation index (NDVI), and TNI was calculated by DEM and slope.
WYxj is the annual water yield of land use type j within pixel x (mm); AETxj is the annual actual evapotranspiration of land use type j within pixel x (mm); and Px is the annual precipitation of land use type j within pixel x (mm).
CS is the total amount of carbon storage (Mg C/ hm2); Cabove is the aboveground biomass carbon (Mg C/hm2); Cbelow is the belowground biomass carbon (Mg C/hm2); Csoil is soil carbon storage (Mg C/hm2); and Cdead is the dead organic matter carbon (Mg C/hm2).
FPx is the food yield for pixel x (×104 t); NDVIx is the NDVI value of pixel x; FPall is the total food production in the study area (×104 t); and NDVIall is the sum of NDVI of cultivated land in the study area.
SC is the soil conservation capacity per unit area (t/(hm2•a)); R is the rainfall erosivity factor (MJ mm/(hm2•h•a)); K is the soil erodibility factor (t h/(MJ•mm)); L is the slope length factor; S is the slope steepness factor; C is the vegetation management factor; and P is the practice factor.
Qxj is the habitat quality value of the pixel x for land use type j; Hj is the habitat suitability for land use type j; Dxj is the stress level of pixel x in land use type j; k is the half-saturation coefficient; and z is a scaling parameter fixed at 2.5 in the InVEST model.
Mohammadyari et al. (2023); Dai et al. (2024)
Table 2 Calculation of ecosystem services (ESs)
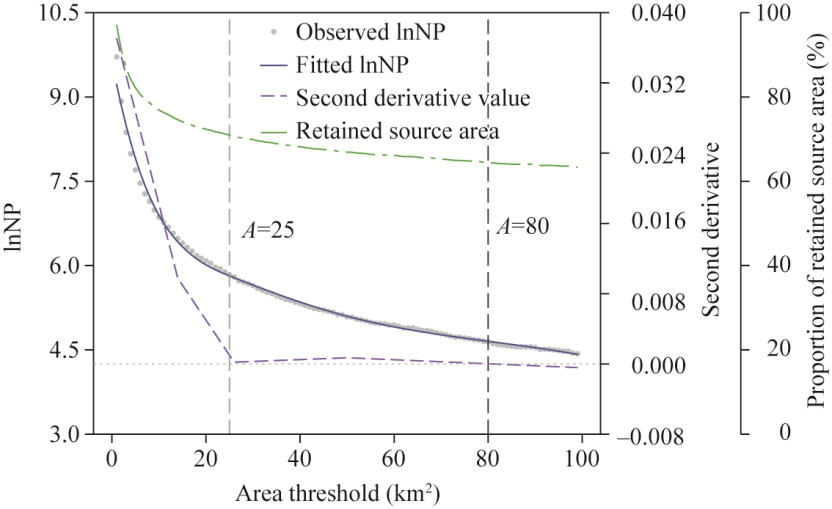
Fig. S1Sensitivity analysis of ecological source area thresholds. The second derivative identified a statistical inflection point at approximately 25 km2, while 80 km2 was selected as the operational threshold considering source fragmentation and retained source area. A, area threshold; NP, number of patches.
Area threshold (km2)
Number of patches
Proportion of retained candidate source area (%)
25
342
71.00
40
205
68.20
60
140
66.10
80
104
64.50
100
84
63.30
Table S1 Sensitivity analysis of ecological source area thresholds
Model selected
R2 clean
RMSE clean
AUC
Accuracy
F1
Light Gradient Boosting Machine (LightGBM)
0.8208
0.2116
0.9846
0.9432
0.9426
Random Forest (RF)
0.8212
0.2114
0.9843
0.9433
0.9430
Extreme gradient boosting (XGBoost)
0.8158
0.2146
0.9839
0.9419
0.9416
Table 3 Random holdout validation
Model selected
R2 clean
RMSE clean
AUC
Accuracy
F1
LightGBM
0.7858
0.2298
0.9793
0.9317
0.9350
RF
0.7816
0.2321
0.9786
0.9304
0.9338
XGBoost
0.7859
0.2298
0.9796
0.9323
0.9356
Table 4 Spatial-block validation
Scenario
Experimental setting
Sample size
Five-fold cross-validation R2
R2 clean (test)
MSE clean (test)
AUC (test)
Accuracy
F1
Type
Label scheme
Gaussian label noise (SD)
S0
Baseline
class 1-2 vs. class 4-5
0.10
200,000
0.7591
0.7511
0.0622
0.9790
0.9313
0.9306
S1
Extreme classes
class 1 vs. 5
0.10
196,142
0.9080
0.8995
0.0251
0.9980
0.9831
0.9834
S2
Strict high resistance
class 1 vs. class 4-5
0.10
199,810
0.8664
0.8579
0.0355
0.9940
0.9686
0.9683
S3
Strict low resistance
class 1-2 vs. class 5
0.10
196,332
0.8385
0.8307
0.0423
0.9920
0.9593
0.9598
S4
No noise
class 1-2 vs. class 4-5
0.00
200,000
0.7713
0.7749
0.0563
0.9800
0.9336
0.9334
S5
Weak noise
class 1-2 vs. class 4-5
0.05
200,000
0.7683
0.7622
0.0595
0.9790
0.9321
0.9318
S6
Stronger noise
class 1-2 vs. class 4-5
0.15
200,000
0.7435
0.7393
0.0652
0.9790
0.9329
0.9322
S7
Ordinal graded labels
class 1-5 converted to scores: 1.00, 0.75, 0.50, 0.25, and 0.00
0.10
200,000
0.6934
0.7228
0.0348
0.9770
0.9281
0.9281
S8
Repeated random sampling
class 1-2 vs. class 4-5
0.10
199,184 ±49
0.7616 ±0.0016
0.7525 ±0.0021
0.0619 ±0.0005
0.9792 ±0.0004
0.9321 ±0.0013
0.9317 ±0.0014
S9
Spatial stratified sampling by administrative divisions
class 1-2 vs. class 4-5
0.10
199,268
0.7078
0.7016
0.0746
0.9691
0.9165
0.9160
S10
Spatial grid-block validation
class 1-2 vs. class 4-5
0.10
199,124
0.7602 ±0.0005
0.7468 ±0.0172
0.0616 ±0.0039
0.9787 ±0.0034
0.9334 ±0.0074
0.9319 ±0.0170
S11
Excluding source-interior samples
class 1-2 vs. class 4-5
0.10
199,170
0.7195
0.7098
0.0725
0.9692
0.9187
0.9174
S12
Excluding source and buffer samples
class 1-2 vs. class 4-5
0.10
199,313
0.6970
0.6891
0.0777
0.9650
0.9122
0.9108
Table S2 Sensitivity analysis of the XGBoost-based resistance model under different ES-labeling, noise, and sample-selection scenarios
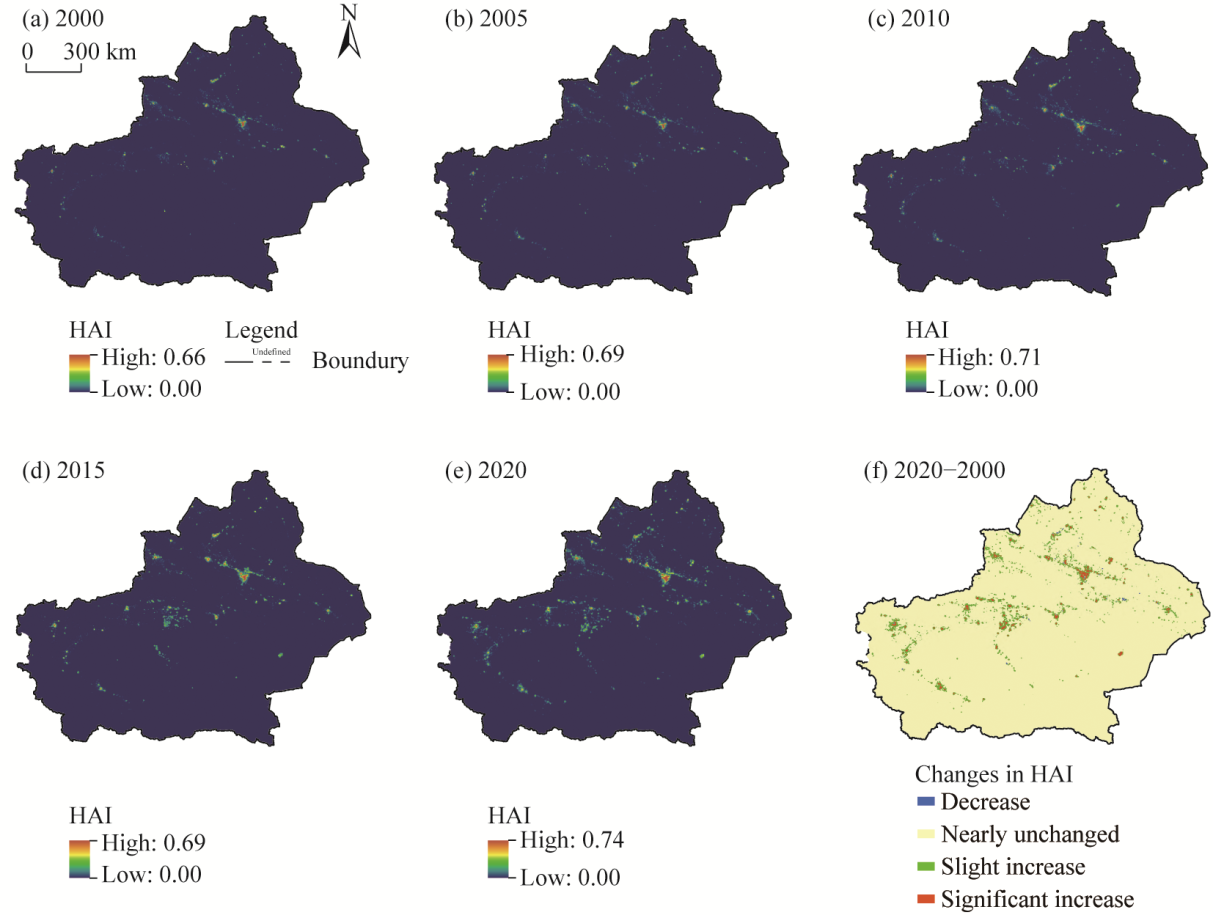
Fig. 3Distribution of HAI (a-e) and its change (f) in Xinjiang from 2000 to 2020
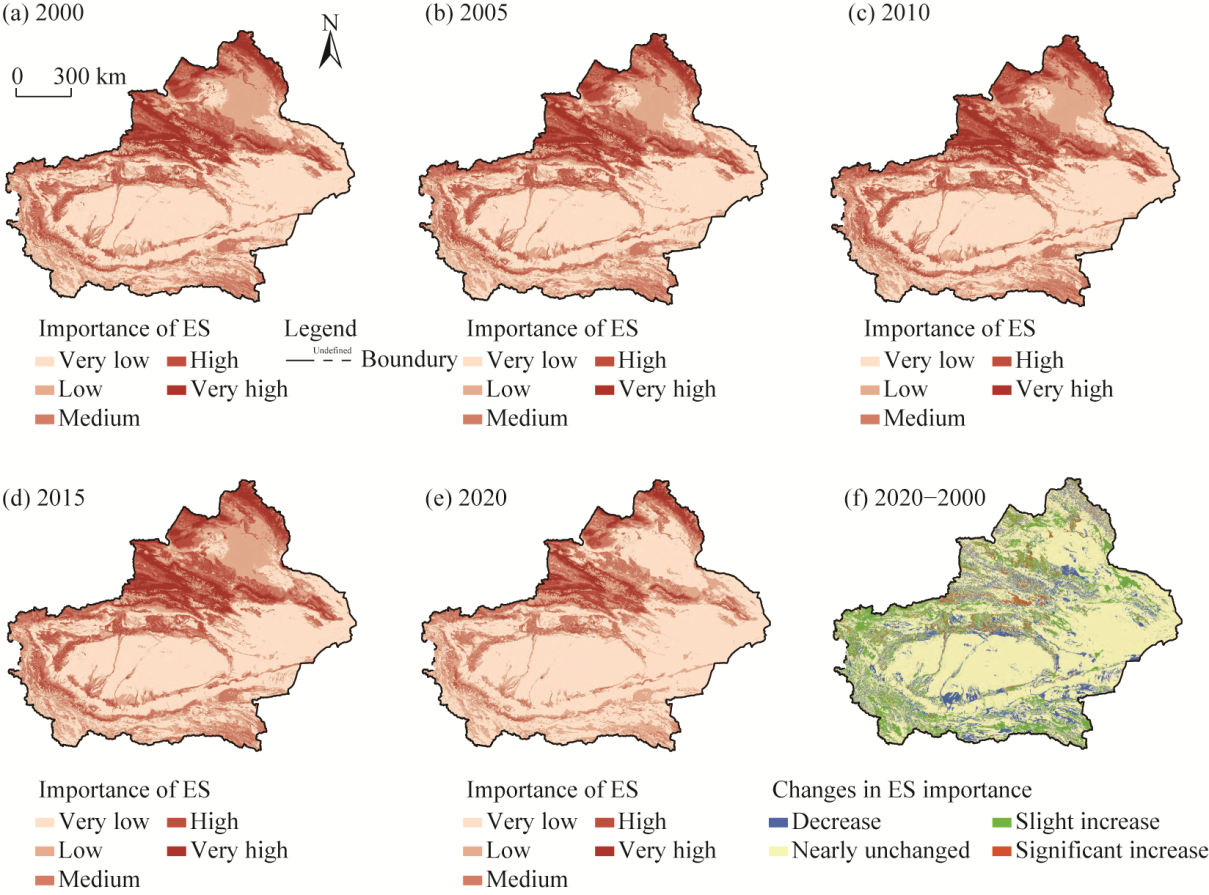
Fig. 4Distribution of ES importance (a-e) and change (f) in Xinjiang from 2000 to 2020
Year
Amount
Maximum area (×105 km2)
Minimum area (×102 km2)
Total area (×105 km2)
Percentage of Xinjiang's area (%)
2000
14
0.67
1.21
1.44
8.81
2005
13
0.70
0.90
1.34
8.20
2010
15
0.47
1.46
1.56
9.58
2015
9
0.75
39.75
1.57
9.62
2020
17
0.36
0.93
0.74
4.57
Table 5 Statistics on ecological sources in Xinjiang from 2000 to 2020
Fig. 5Spatial distribution of ecological sources in Xinjiang. (a), 2000; (b), 2005; (c), 2010; (d), 2015; (e), 2020.
Year
Ten-fold cross-validation
R2 (train)
R2 (test)
F1 score (train)
F1 score (test)
R2 (mean)
MSE (mean)
2000
0.7788
0.0475
0.7802
0.7780
0.9400
0.9387
2005
0.7995
0.0431
0.8006
0.7988
0.9464
0.9454
2010
0.7750
0.0484
0.7757
0.7753
0.9371
0.9377
2015
0.7853
0.0461
0.7874
0.7832
0.9421
0.9405
2020
0.7388
0.0561
0.7395
0.7395
0.9248
0.9254
Table 6 XGBoost model accuracy
Fig. 6Spatial distribution of ecological resistance surfaces in Xinjiang. (a), 2000; (b), 2005; (c), 2010; (d), 2015; (e), 2020.
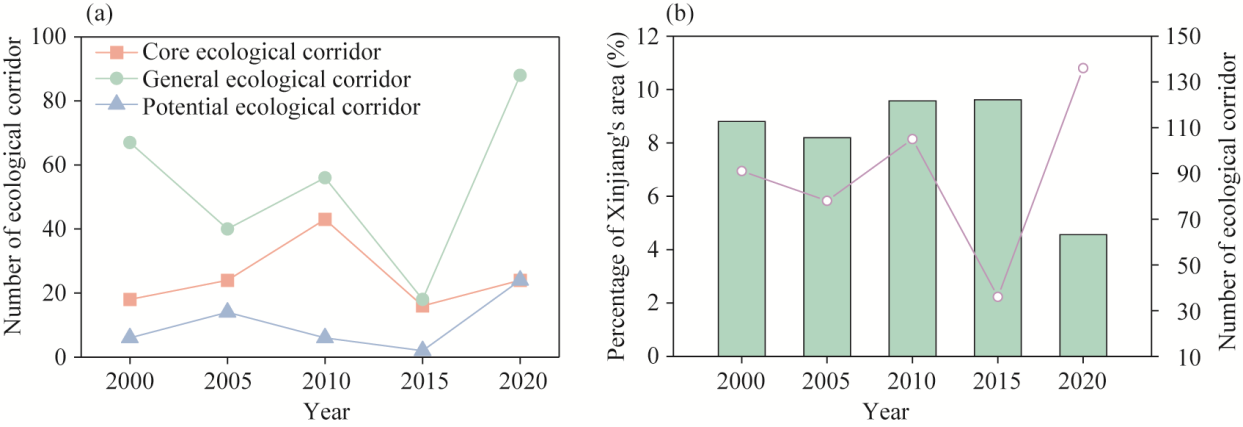
Fig. 7Changes in the numbers of different ecological corridor types (a) and variations in ecological source area proportion and total corridor number (b) in Xinjiang from 2000 to 2020
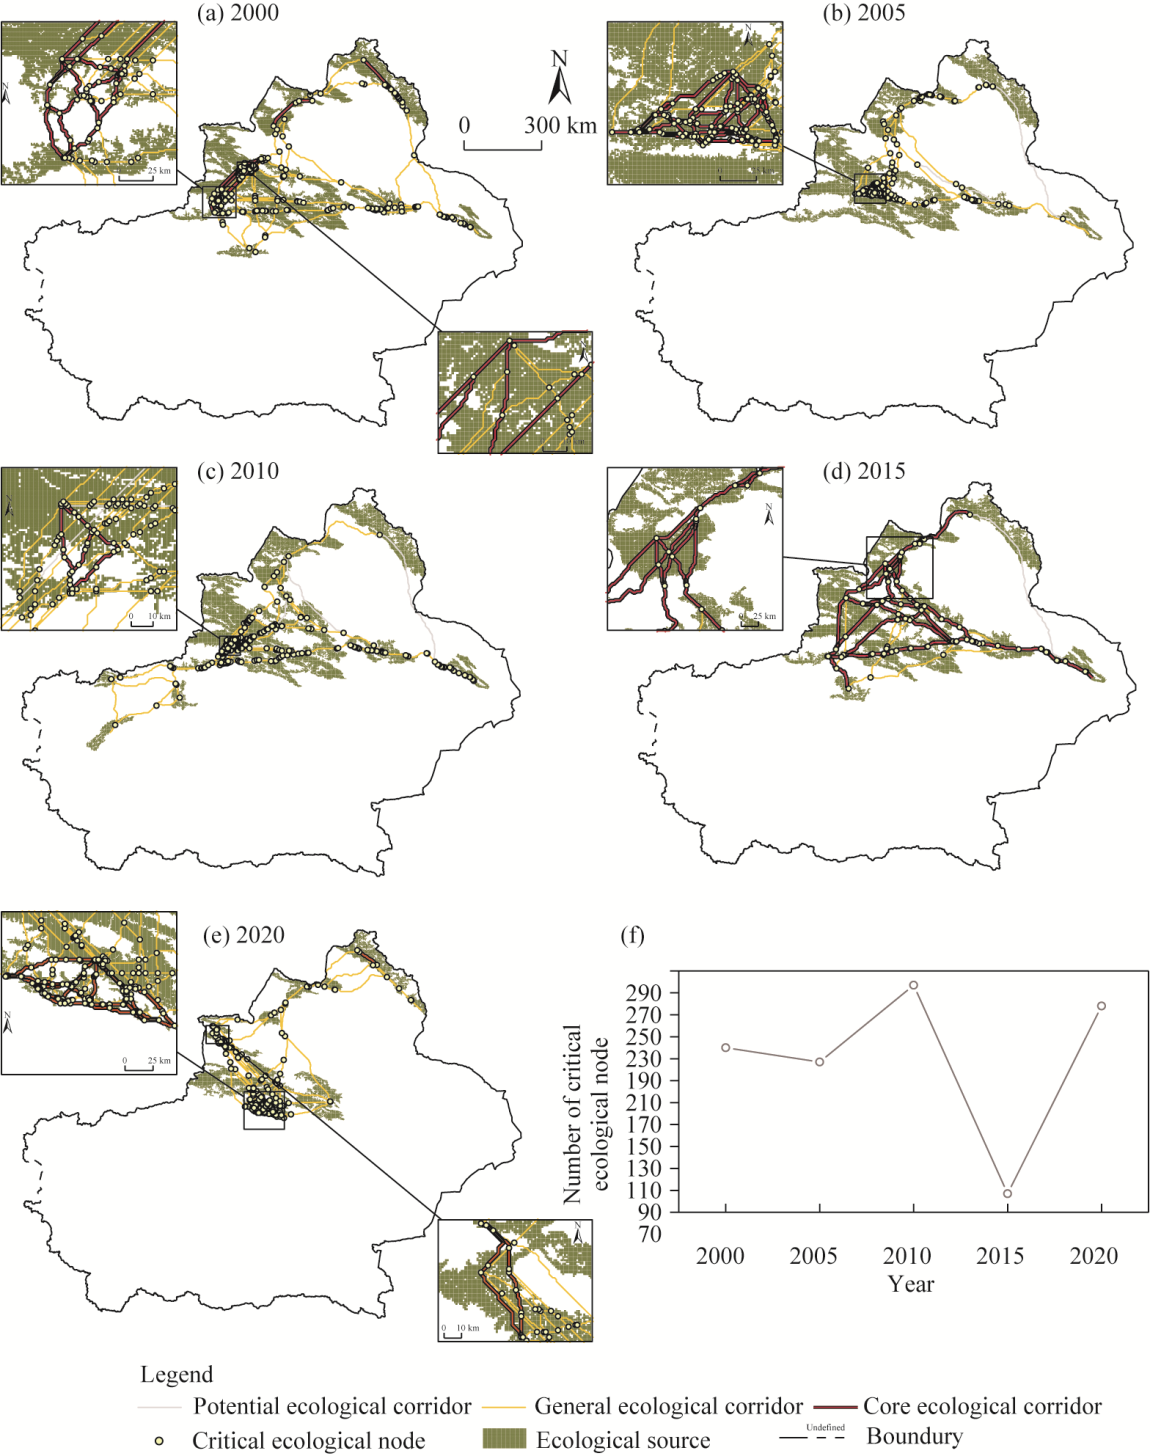
Fig. 8Evolution of the ESP in Xinjiang from 2000 to 2020. (a-e), ecological corridor in 2000, 2005, 2010, 2015, and 2020, respectively; (f), change in the number of ecological nodes.
Zoning type
S-H combinations
Relationship with ESP component
Description and management recommendations
Ecological conservation area
S4-H1, S4-H2, S5-H1, and S5-H2
Mainly overlaps with ecological sources, core ecological corridors, low-disturbance buffer zones, and critical ecological nodes with high ecosystem service values (ESVs)
These areas have high ecosystem service functions and low human disturbance, representing the most important ecological spaces for maintaining regional ecological security. They should be prioritized as ecological core areas or strict conservation zones. Development and intensive human disturbance should be strictly restricted to maintain habitat quality, ecological connectivity, and long-term ecosystem stability.
Ecological restoration and enhancement area
S2-H2, S3-H1, and S3-H2
Mainly distributed in potential and general corridors, ecological source margins, and low-pressure buffer zones
These areas have relatively low human disturbance and certain ecological restoration potential. Ecological restoration, habitat improvement, vegetation restoration, and corridor connectivity enhancement should be implemented to prevent further degradation and improve ecological network stability.
Optimized development area
S1-H1, S1-H2, and S2-H1
Mainly located outside ecological sources, core corridors, corridor buffer zones, and critical ecological nodes
These areas have relatively low ES levels and low human activity intensity (HAI). They may support moderate development under ecological constraints. However, development should avoid occupying ecological sources, ecological corridors, and key ecological nodes, and should emphasize efficient resource use and low-impact land development.
Regulation and recovery area
S3-H3, S3-H4, S4-H3, S4-H4, and S5-H3
Often overlaps with ecological sources, corridors, buffer zones, or critical nodes affected by moderate to high human disturbance
These areas still maintain moderate to high ecosystem service functions but are increasingly affected by human activities. Regulation of land use intensity, ecological restoration, and disturbance control should be strengthened. For areas overlapping with corridors or critical nodes, priority should be given to restoring corridor continuity and reducing ecological resistance.
Ecological monitoring area
S1-H3, S1-H4, S2-H3, and S2-H4
Mainly located in noncore ecological areas, potential corridors, or peripheral buffer zones with low ESVs and moderate human disturbance
These areas have relatively low ecosystem service functions and are affected by human activities. Although their current ecological importance is limited, they may influence adjacent ecological sources or corridors. Long-term ecological monitoring and early-warning mechanisms should be established to prevent further degradation and avoid increasing ecological resistance.
Intensive development area
S1-H5, S2-H5, and S3-H5
Concentrated mainly in existing highly disturbed built-up and development areas outside ecological sources, corridors, buffer zones, and critical ecological nodes
These areas have low to moderate ecosystem service functions and high HAI, indicating that they are already strongly influenced by human development. They may be used as priority areas for development and construction, but only when they do not overlap with important ESP components. Environmental impact assessment and ecological risk control are still needed.
High ecological pressure area
S4-H5, S5-H4, and S5-H5
Mainly refers to high-ES areas, ecological sources, core corridors, buffer zones, or critical nodes under strong human disturbance
These areas have high ecological value but are exposed to intense human activities, indicating severe ecological pressure. They should be regarded as priority areas for ecological regulation and restoration. Measures such as ecological redline protection, ecological compensation, human disturbance control, corridor restoration, and environmental monitoring should be strengthened.
Table 7 Ecological function and regulatory zoning standards under ecological security pattern (ESP) constraints
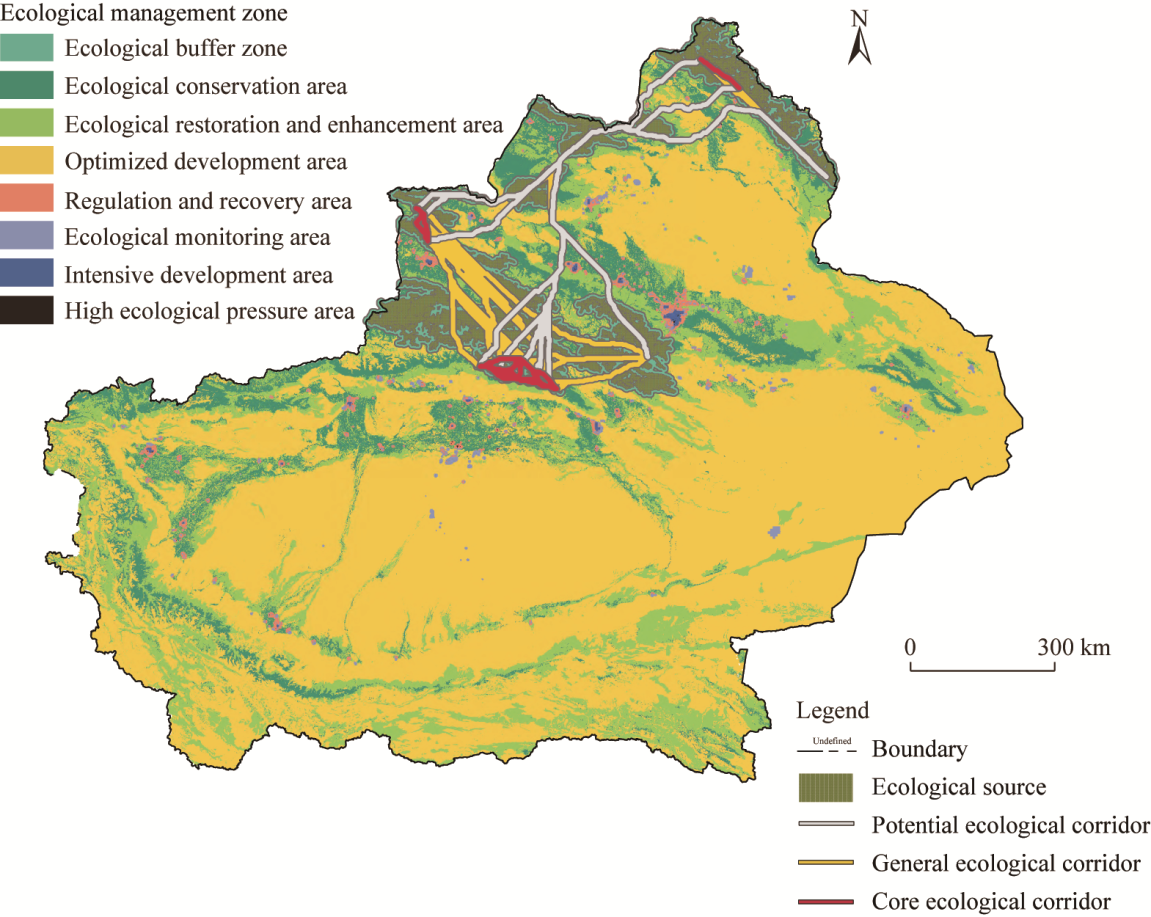
Fig. 9Regional ecological function and regulation zoning based on the ESP in Xinjiang
Period
Changed area (×105 km2)
Changed proportion (%)
Dominant transitions
Ecological implication
2000-2005
1.24
7.65
2→1, 3→2, 2→3, and 1→2
Ecological enhancement and local degradation coexisted.
2005-2010
1.35
8.30
3→2, 2→1, 2→3, and 1→2
Functional adjustment continued.
2010-2015
0.98
6.02
2→1, 1→2, 3→2, and 2→3
Zoning pattern was relatively stable.
2015-2020
1.98
12.19
3→2, 2→1, 1→2, and 2→3
Restoration demand increased significantly.
2000-2020
2.41
14.83
3→2, 2→1, 1→2, and 2→3
Long-term shifted toward restoration and conservation.
Table 8 Main transitions of ecological service function zoning in Xinjiang from 2000 to 2020
Article
Study area
Period
Resistance surface
Main scientific focus
Difference from the present study
Wang et al. (2023)
Xinjiang
2018
Predefined resistance factors and coefficients
Regional ESP and ecological network construction
Focused mainly on identifying ecological sources, corridors, and nodes rather than the temporal ES-HAI relationship
Cao et al. (2024)
Xinjiang
-
Integrated resistance surface within the InVEST-Conefor-MCRM framework
ESP construction based on ES importance and landscape connectivity
Improved source identification and connectivity representation, but did not examine the temporal relationship between ES and human activity
Wang et al. (2025)
Xinjiang
2000, 2010, and 2020
Empirical resistance coefficients combined with MCR
Network evolution, robustness, critical transitions, and early warning
Focused on ecological network vulnerability and resilience rather than ES-HAI spatial relationships
He et al. (2025)
Tarim Basin
2000, 2010, and 2020
AHP-based integration of natural and anthropogenic resistance factors
Landscape ecological risk and ESP construction
Emphasized ecological risk and connectivity at the basin scale without explicitly analyzing ES-HAI relationships
An et al. (2025)
Northern Tianshan urban agglomeration
2000-2020
Expert scoring and AHP-weighted natural, anthropogenic, and accessibility factors
Revised ESV, ecological sensitivity, and ESP optimization
Considered temporal ES change and urbanization-related factors, but focused on ES value and ecological sensitivity rather than the spatiotemporal ES-HAI relationship
Present study
Xinjiang
2000, 2005, 2010, 2015, and 2020
XGBoost-based data-driven resistance estimation with robustness tests
Spatiotemporal evolution of ESP and the relationship between ecosystem service capacity and HAI
Extends ESP research toward the spatiotemporal diagnosis and spatial regulation of ES-HAI relationships
Table 9 Comparison of the results of the present study with those of representative ESP studies in Xinjiang
[1]
An X Y, Kasimu A, Zhang X, et al. 2025. Integrating revised ecosystem service value, ecological sensitivity and circuit theory to construct an ecological security pattern in the UANSTM, China. Sustainability, 17(23): 10880, doi: 10.3390/su172310880.
[2]
Bureau of Statistics of Xinjiang Uygur Autonomous Region. 2001-2021. Xinjiang Statistical Yearbook (2000-2020). Beijing: China Statistics Press. (in Chinese)
[3]
Cai T Y, Luo X Y, Fan L Y, et al. 2022. The impact of cropland use changes on terrestrial ecosystem services value in newly added cropland hotspots in China during 2000-2020. Land, 11(12): 2294, doi: 10.3390/land11122294.
[4]
Cao C, Luo Y T, Xu L P, et al. 2024. Construction of ecological security pattern based on InVEST-Conefor-MCRM: A case study of Xinjiang, China. Ecological Indicators, 159: 111647, doi: 10.1016/j.ecolind.2024.111647.
[5]
Cardinale B J, Duffy J E, Gonzalez A, et al. 2012. Biodiversity loss and its impact on humanity. Nature, 486(7401): 59-67.
doi: 10.1038/nature11148
[6]
Chen B L, Liu X, Liu J P. 2025. Construction and optimization of ecological security patterns in Chinese black soil areas considering ecological importance and vulnerability. Scientific Reports, 15: 12142, doi: 10.1038/s41598-025-95927-6.
[7]
Chen C L, Shi L, Lu Y, et al. 2020. The optimization of urban ecological network planning based on the minimum cumulative resistance model and granularity reverse method: a case study of Haikou, China. IEEE Access, 8: 43592-43605.
doi: 10.1109/Access.6287639
[8]
Chen Y N, Han P Y, Wang P F, et al. 2026. Construction and optimization of ecological network based on SOM and XGBoost-SHAP: a case study of the Zhengzhou-Kaifeng-Luoyang Region. Land, 15(1): 173, doi: 10.3390/land15010173.
[9]
Cui F Q, Tang H P, Zhang Q, et al. 2019. Integrating ecosystem services supply and demand into optimized management at different scales: a case study in Hulunbuir, China. Ecosystem Services, 39: 100984, doi: 10.1016/j.ecoser.2019.100984.
[10]
Dai E F, Zhao Z X, Jia L Z, et al. 2024. Contribution of ecosystem services improvement on achieving sustainable development goals under ecological engineering projects on the Qinghai-Tibet Plateau. Ecological Engineering, 199: 107146, doi: 10.1016/j.ecoleng.2023.107146.
[11]
Feng M, Zhao W M, Zhang T. 2023. Construction and optimization strategy of county ecological infrastructure network based on MCR and gravity model-a case study of Langzhong County in Sichuan Province. Sustainability, 15(11): 8478, doi: 10.3390/su15118478.
[12]
Fischer J, Lindenmayer D B. 2007. Landscape modification and habitat fragmentation: a synthesis. Global Ecology and Biogeography, 16(3): 265-280.
doi: 10.1111/geb.2007.16.issue-3
[13]
Fu Y Y, Zhang W J, Gao F, et al. 2024. Ecological security pattern construction in Loess Plateau areas-a case study of Shanxi Province, China. Land, 13(5): 709, doi: 10.3390/land13050709.
[14]
Gao J, O'Neill B C. 2020. Mapping global urban land for the 21st century with data-driven simulations and Shared Socioeconomic Pathways. Nature Communications, 11: 2302, doi: 10.1038/s41467-020-15788-7.
pmid: 32385275
[15]
Guo R, Wu T, Liu M R, et al. 2019. The construction and optimization of ecological security pattern in the Harbin-Changchun urban agglomeration, China. International Journal of Environmental Research and Public Health, 16(7): 1190, doi: 10.3390/ijerph16071190.
[16]
Haddad N M, Brudvig L A, Clobert J, et al. 2015. Habitat fragmentation and its lasting impact on Earth's ecosystems. Science Advances, 1(2): e1500052, doi: 10.1126/sciadv.1500052.
[17]
Han G, Feng G Z, Tang C L, et al. 2023a. Evaluation of the ventilation mode in an ISO class 6 electronic cleanroom by the AHP-entropy weight method. Energy, 284: 128586, doi: 10.1016/j.energy.2023.128586.
[18]
Han W Y, Su X K, Lu H T, et al. 2023b. Impacts of human activity intensity on ecosystem services for conservation in the Lhasa River Basin. Ecosystem Health and Sustainability, 9: 0088, doi: 10.34133/ehs.0088.
[19]
Haseeb M, Tahir Z, Mehmood S A, et al. 2024. Enhancing carbon sequestration through afforestation: evaluating the impact of land use and cover changes on carbon storage dynamics. Earth Systems and Environment, 8: 1563-1582.
doi: 10.1007/s41748-024-00414-z
[20]
He P Y, Wang L H, Zhai S Q, et al. 2025. Assessment of landscape risks and ecological security patterns in the Tarim Basin, Xinjiang, China. Land, 14(6): 1221, doi: 10.3390/land14061221.
[21]
Huynh L T M, Gasparatos A, Su J, et al. 2022. Linking the nonmaterial dimensions of human-nature relations and human well-being through cultural ecosystem services. Science Advances, 8(31): eabn8042, doi: 10.1126/sciadv.abn8042.
[22]
Jiang H, Peng J, Liu M L, et al. 2024. Integrating patch stability and network connectivity to optimize ecological security pattern. Landscape Ecology, 39: 54, doi: 10.1007/s10980-024-01852-w.
[23]
Kremen C, Ostfeld R S. 2005. A call to ecologists: measuring, analyzing, and managing ecosystem services. Frontiers in Ecology and the Environment, 3(10): 540-548.
doi: 10.1890/1540-9295(2005)003[0540:ACTEMA]2.0.CO;2
[24]
Lai J L, Qi S. 2025. Construction of ecological security pattern based on ecological protection red line, machine learning algorithms, and circuit theory: a case study of Kunming City, China. Journal of Cleaner Production, 520: 146117, doi: 10.1016/j.jclepro.2025.146117.
[25]
Li J W, Dong S C, Li Y, et al. 2023. Environmental governance of transnational regions based on ecological security: the China-Mongolia-Russia Economic Corridor. Journal of Cleaner Production, 422: 138625, doi: 10.1016/j.jclepro.2023.138625.
[26]
Li K, Yan X L, Hou Y, et al. 2024a. Can ecological zoning act as an environmental management tool for protecting regional habitat quality: causal evidence from the National Key Ecological Function Zone in China. Journal of Cleaner Production, 475: 143623, doi: 10.1016/j.jclepro.2024.143623.
[27]
Li R B, Du Z Q, Yan Y Y, et al. 2025. Integrating ecosystem health and human footprint in ecological function zoning: a framework for sustainable landscape management in Sanchuan River Watershed, China. Landscape Ecology, 40: 213, doi: 10.1007/s10980-025-02211-z.
[28]
Li Z, Liu J C, Ma R Q, et al. 2024b. Construction of ecological security pattern based on ecosystem services, sensitivity, connectivity, and resistance-a case study in the Huang-Huai-Hai Plain. Land, 13(12): 2243, doi: 10.3390/land13122243.
[29]
Liu H L, Wang Z L, Zhang L P, et al. 2023a. Construction of an ecological security network in the Fenhe River Basin and its temporal and spatial evolution characteristics. Journal of Cleaner Production, 417: 137961, doi: 10.1016/j.jclepro.2023.137961.
[30]
Liu X Y, Su Y, Li Z G, et al. 2023b. Constructing ecological security patterns based on ecosystem services trade-offs and ecological sensitivity: a case study of Shenzhen Metropolitan Area, China. Ecological Indicators, 154: 110626, doi: 10.1016/j.ecolind.2023.110626.
[31]
Ludford A, Cole V J, Porri F, et al. 2012. Testing source-sink theory: the spill-over of mussel recruits beyond marine protected areas. Landscape Ecology, 27(6): 859-868.
doi: 10.1007/s10980-012-9739-y
[32]
Luo J L, Zhu L, Fu H. 2024. Construction of wetland ecological network based on MSPA-Conefor-MCR: a case study of Haikou City. Ecological Indicators, 166: 112329, doi: 10.1016/j.ecolind.2024.112329.
[33]
McRae B H, Beier P. 2007. Circuit theory predicts gene flow in plant and animal populations. Proceedings of the National Academy of Sciences, 104(50): 19885-19890.
[34]
Mohammadyari F, Tavakoli M, Zarandian A, et al. 2023. Optimization land use based on multi-scenario simulation of ecosystem service for sustainable landscape planning in a mixed urban-forest watershed. Ecological Modelling, 483: 110440, doi: 10.1016/j.ecolmodel.2023.110440.
[35]
Nie H R, Zhao Y, Zhu J, et al. 2024. Ecological security pattern construction in typical oasis area based on ant colony optimization: a case study in Yili River Valley, China. Ecological Indicators, 169: 112770, doi: 10.1016/j.ecolind.2024.112770.
[36]
Pan J H, Wang Y M, Zhang Z. 2023. Identification and optimization of ecological network in arid inland river basin using MSPA and spatial syntax: a case study of Shule River Basin, NW China. Land, 12(2): 292, doi: 10.3390/land12020292.
[37]
Reyers B, Selig E R. 2020. Global targets that reveal the social-ecological interdependencies of sustainable development. Nature Ecology & Evolution, 4(8): 1011-1019.
[38]
Santini L, Saura S, Rondinini C. 2016. Connectivity of the global network of protected areas. Diversity and Distributions, 22(2): 199-211.
doi: 10.1111/ddi.2016.22.issue-2
[39]
Saura S, Torné J. 2009. Conefor Sensinode 2.2: a software package for quantifying the importance of habitat patches for landscape connectivity. Environmental Modelling & Software, 24(1): 135-139.
[40]
Shen Z, Wu W, Tian S Q, et al. 2022. A multi-scale analysis framework of different methods used in establishing ecological networks. Landscape and Urban Planning, 228: 104579, doi: 10.1016/j.landurbplan.2022.104579.
[41]
Shi J L, Wang T D, Xu L P, et al. 2024. Study on the ecological compensation standard in the Xinjiang Uygur Autonomous Region of China under the perspective of natural capital supply and demand. Sustainability, 16(7): 3078, doi: 10.3390/su16073078.
[42]
Song J, Betz F, Aishan T, et al. 2024. Impact of water supply on the restoration of the severely damaged riparian plants along the Tarim River in Xinjiang, Northwest China. Ecological Indicators, 158: 111570, doi: 10.1016/j.ecolind.2024.111570.
[43]
Sun D L, Wu X Q, Wen H J, et al. 2024a. Ecological security pattern based on XGBoost-MCR model: a case study of the Three Gorges Reservoir Region. Journal of Cleaner Production, 470: 143252, doi: 10.1016/j.jclepro.2024.143252.
[44]
Sun W J, Yu Q, Xu C L, et al. 2024b. Construction and optimization of ecological spatial network in typical mining cities of the Yellow River Basin: the case study of Shenmu City, Shaanxi. Ecological Processes, 13(1): 60, doi: 10.1186/s13717-024-00539-z.
[45]
Sun Y X, Liu S L, Shi F N, et al. 2020. Spatio-temporal variations and coupling of human activity intensity and ecosystem services based on the four-quadrant model on the Qinghai-Tibet Plateau. Science of The Total Environment, 743: 140721, doi: 10.1016/j.scitotenv.2020.140721.
[46]
Tian H Z, Wang H, Lü X, et al. 2024. Construction and optimization of ecological security patterns in dryland watersheds considering ecosystem services flows. Ecological Indicators, 159: 111664, doi: 10.1016/j.ecolind.2024.111664.
[47]
Wang J, Bai Y, Huang Z D, et al. 2024a. Identifying ecological security patterns to prioritize conservation and restoration: a case study in Xishuangbanna tropical region, China. Journal of Cleaner Production, 444: 141222, doi: 10.1016/j.jclepro.2024.141222.
[48]
Wang S, Wu M Q, Hu M M, et al. 2021. Promoting landscape connectivity of highly urbanized area: an ecological network approach. Ecological Indicators, 125: 107487, doi: 10.1016/j.ecolind.2021.107487.
[49]
Wang X X, Wang X F, Tu Y, et al. 2024b. Systematic conservation planning considering ecosystem services can optimize the conservation system in the Qinling-Daba Mountains. Journal of Environmental Management, 368: 122096, doi: 10.1016/j.jenvman.2024.122096.
[50]
Wang Y, Pan J H. 2019. Building ecological security patterns based on ecosystem services value reconstruction in an arid inland basin: a case study in Ganzhou District, NW China. Journal of Cleaner Production, 241: 118337, doi: 10.1016/j.jclepro.2019.118337.
[51]
Wang Y S, Zhang F, Li X Y, et al. 2023. Methodology for mapping the ecological security pattern and ecological network in the arid region of Xinjiang, China. Remote Sensing, 15(11): 2836, doi: 10.3390/rs15112836.
[52]
Wang Y S, Zhang F, Chen W Y, et al. 2025. Critical phase transitions and early-warning frameworks for ecological networks in typical arid regions. Journal of Cleaner Production, 531: 146888, doi: 10.1016/j.jclepro.2025.146888.
[53]
Wei L, Zhou L, Sun D Q, et al. 2022a. Evaluating the impact of urban expansion on the habitat quality and constructing ecological security patterns: a case study of Jiziwan in the Yellow River Basin, China. Ecological Indicators, 145: 109544, doi: 10.1016/j.ecolind.2022.109544.
[54]
Wei Q Q, Halike A, Yao K X, et al. 2022b. Construction and optimization of ecological security pattern in Ebinur Lake Basin based on MSPA-MCR models. Ecological Indicators, 138: 108857, doi: 10.1016/j.ecolind.2022.108857.
[55]
Wu J H, Wang G Z, Chen W X, et al. 2022. Terrain gradient variations in the ecosystem services value of the Qinghai-Tibet Plateau, China. Global Ecology and Conservation, 34: e02008, doi: 10.1016/j.gecco.2022.e02008.
[56]
Wu J S, Fan X N, Li K Y, et al. 2023. Assessment of ecosystem service flow and optimization of spatial pattern of supply and demand matching in Pearl River Delta, China. Ecological Indicators, 153: 110452, doi: 10.1016/j.ecolind.2023.110452.
[57]
Yang D H, Gao Y, Chen J, et al. 2025. Optimizing regional ecological security patterns based on interpretable machine learning models: a case study of Huzhou, Zhejiang Province. Journal of Environmental Management, 393: 126905, doi: 10.1016/j.jenvman.2025.126905.
[58]
Yao C L, Wang Y J, Yang G, et al. 2023. Spatial and temporal variation in vegetation response to runoff in the Ebinur Lake Basin. Forests, 14(9): 1699, doi: 10.3390/f14091699.
[59]
Yi L, Sun Y, Yin S H, et al. 2022. Construction of ecological security pattern: concept, framework and prospect. Ecology and Environmental Sciences, 31(4): 845-856. (in Chinese)
[60]
Yu K J. 1996. Security patterns and surface model in landscape ecological planning. Landscape and Urban Planning, 36(1): 1-17.
doi: 10.1016/S0169-2046(96)00331-3
[61]
Yuan L G, Geng M M, Li F, et al. 2024. Spatiotemporal characteristics and drivers of ecosystem service interactions in the Dongting Lake Basin. Science of The Total Environment, 926: 172012, doi: 10.1016/j.scitotenv.2024.172012.
[62]
Zeller K A, McGarigal K, Whiteley A R. 2012. Estimating landscape resistance to movement: a review. Landscape Ecology, 27(6): 777-797.
doi: 10.1007/s10980-012-9737-0
[63]
Zhang J, Zhang P, Deng X Y, et al. 2024a. Study on the spatial and temporal trends of ecological environment quality and influencing factors in Xinjiang Oasis. Remote Sensing, 16(11): 1980, doi: 10.3390/rs16111980.
[64]
Zhang Y L, Zhang P, Gu X C, et al. 2024b. Projections of temperature and precipitation changes in Xinjiang from 2021 to 2050 based on the CMIP6 model. PLOS ONE, 19(10): e0307911, doi: 10.1371/journal.pone.0307911.
[65]
Zhang Y Y, Yang R J, Sun M Y, et al. 2024c. Identification of spatial protection and restoration priorities for ecological security pattern in a rapidly urbanized region: a case study in the Chengdu-Chongqing Economic Circle, China. Journal of Environmental Management, 366: 121789, doi: 10.1016/j.jenvman.2024.121789.
[66]
Zhang Z, Hu B Q, Jiang W G, et al. 2023. Construction of ecological security pattern based on ecological carrying capacity assessment 1990-2040: a case study of the Southwest Guangxi Karst-Beibu Gulf. Ecological Modelling, 479: 110322, doi: 10.1016/j.ecolmodel.2023.110322.
[67]
Zhang Z P, Xia F Q, Yang D G, et al. 2020. Spatiotemporal characteristics in ecosystem service value and its interaction with human activities in Xinjiang, China. Ecological Indicators, 110: 105826, doi: 10.1016/j.ecolind.2019.105826.
[68]
Zhou Y Q, Li Y M, Li W, et al. 2022. Ecological responses to climate change and human activities in the arid and semi-arid regions of Xinjiang in China. Remote Sensing, 14(16): 3911, doi: 10.3390/rs14163911.