Surface water dynamics and driving factors in the Huangshui River Basin of the Xining-Haidong Corridor in China from 2000 to 2024 based on Google Earth Engine
CHENG Ruixuan1, QIN Ke1,*(), YIN Sijiang2
1College of Horticulture, China Agricultural University, Beijing 100083, China 2Beijing Academy of Forestry and Landscape Architecture, Beijing 100102, China
Sustaining surface water in arid mountain-valley corridors has become increasingly difficult under a warming-wetting climate and urbanization. Focusing on the Huangshui River Basin in the Xining-Haidong Corridor of China, this study used Google Earth Engine (GEE) to process Landsat 5/7/8/9 surface reflectance imagery to reconstruct open-water dynamics within the riparian corridor. A three-expert ensemble voting framework integrated spectral water indices, Dynamic Surface Water Extent rules, and a Random Forest classifier, and the extraction results were validated using 1200 manually interpreted points. Trend analysis, Random Forest attribution, and GeoDetector were then applied to assess temporal changes and the combined effects of climate, topography, and human activity. The extraction achieved an overall accuracy of 96.17% and a Kappa coefficient of 0.923. The mapped open-water area increased from 74.33 km2 in 2000 to 121.67 km2 in 2024, corresponding to a net gain of 47.34 km2 (63.68%). The Mann-Kendall test indicated a significant upward trend (Z=6.66; P<0.001), with a Theil-Sen slope of 1.45 km2/a. Sequential Mann-Kendall analysis identified no robust year of abrupt change, although the increasing trend became significant after 2007. Attribution results showed that topography remained the dominant spatial regulator of water persistence, as low-elevation valley floors concentrate both runoff accumulation and human land use. Population density (PD) and nighttime light (NTL) signals were stronger in urbanized reaches, where high impervious-surface values and mapped water co-occurred around managed water environments, including regulated channels, impoundments, and reservoir storage. Overlay analysis of barriers and reservoirs further suggested that engineering regulation may account for part of the persistent water patches along the corridor. These findings reveal a coupled mechanism involving climate, topography, and human regulation in shaping surface water change in a water-limited plateau river corridor, and provide evidence for water-resource management and ecological restoration in the upper Yellow River Basin.
Received: 31 December 2025
Published: 09 July 2026
CHENG Ruixuan, QIN Ke, YIN Sijiang. Surface water dynamics and driving factors in the Huangshui River Basin of the Xining-Haidong Corridor in China from 2000 to 2024 based on Google Earth Engine. Journal of Arid Land, 2026, 18(7): 1192-1212.
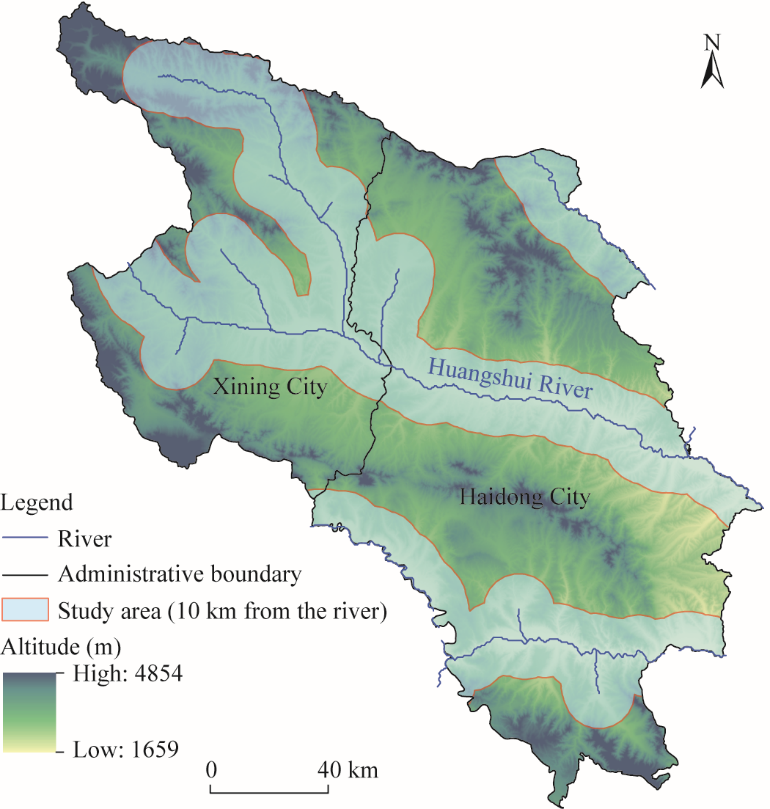
Fig. 1Elevation and river networks of the study area. The map shows the 10 km riparian study area along the major river network across Xining City and Haidong City.
Table 1 Main datasets, variables, and analytical roles in the analysis
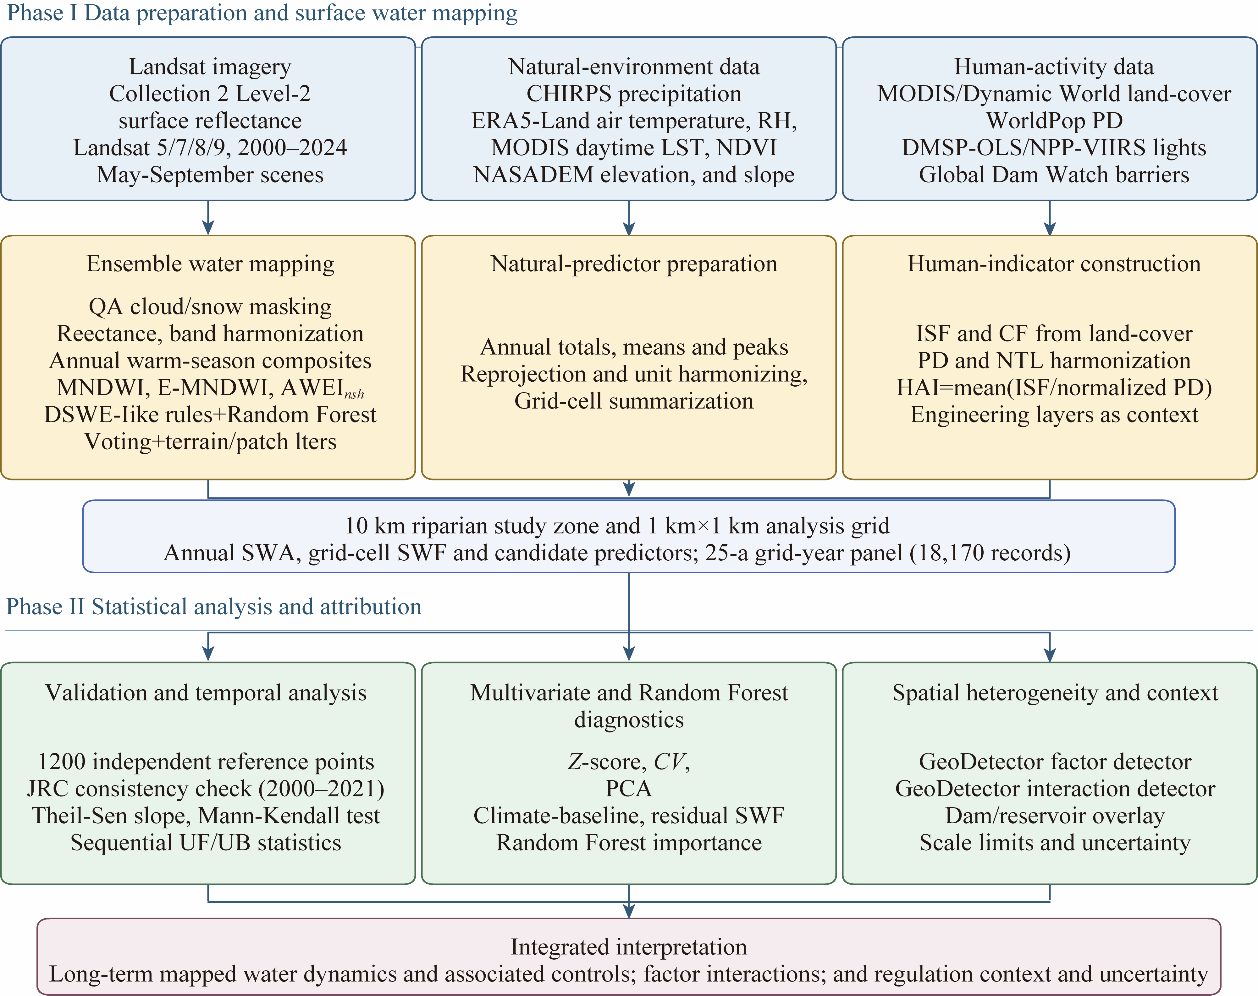
Fig. 2Analytical framework of this study. CHIRPS, Climate Hazards Group InfraRed Precipitation with Station data; ERA5-Land, fifth-generation European Centre for Medium-Range Weather Forecasts (ECMWF) atmospheric reanalysis for land; RH, relative humidity; MODIS, Moderate Resolution Imaging Spectroradiometer; LST, land surface temperature; NDVI, normalized difference vegetation index; NASADEM, National Aeronautics and Space Administration (NASA)-digital elevation model; DMSP-OLS, Defense Meteorological Satellite Program-Operational Linescan System; NPP-VIIRS, National Polar-orbiting Partnership-Visible Infrared Imaging Radiometer Suite; QA, quality assessment; MNDWI, modified normalized difference water index; E-MNDWI, enhanced-modified normalized difference water index; AWEInsh, automated water extraction index for no-shadow conditions; DSWE, Dynamic Surface Water Extent; ISF, impervious-surface fraction; CF, cropland fraction; PD, population density; NTL, nighttime light; HAI, composite human-activity index; JRC, Joint Research Centre; UF and UB, forward and backward sequential Mann-Kendall statistics, respectively; SWA, surface water area; SWF, surface water fraction; CV, coefficient of variation; PCA, principal component analysis.
Classification
Reference: water point
Reference: non-water point
Row total
User's accuracy
Classified: water point
569
15
584
97.42%
Classified: non-water point
31
585
616
95.00%
Column total
600
600
1200
-
Producer's accuracy
94.83%
97.50%
-
Overall accuracy 96.17%
Kappa coefficient: 0.923
Table 2 Confusion matrix for surface water extraction accuracy assessment
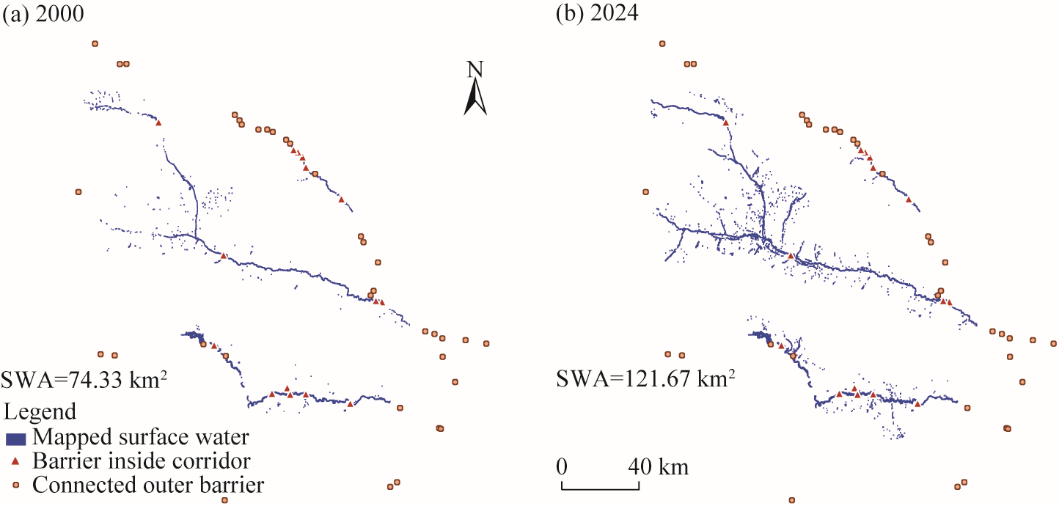
Fig. 3Spatial distribution of mapped surface water and candidate hydrological barriers in the two representative years 2000 (a) and 2024 (b)
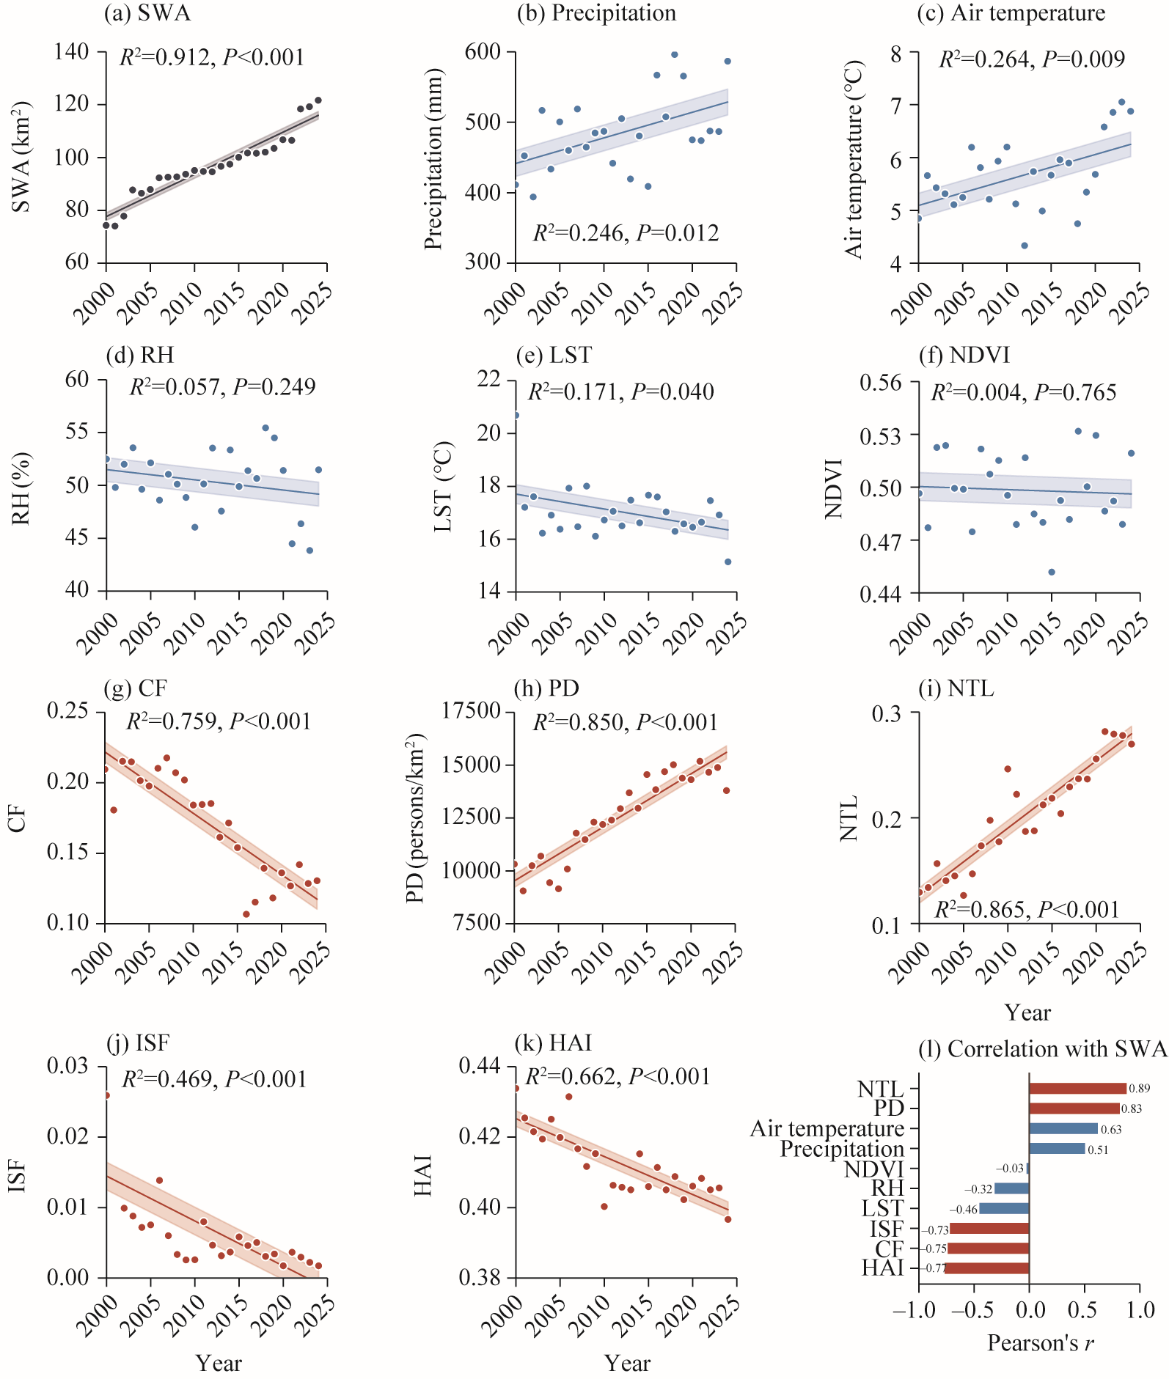
Fig. 4Interannual trends of SWA and driving factors in the study area during 2000-2024. (a), annual SWA; (b), annual total precipitation; (c), annual mean 2-m air temperature; (d), RH; (e), LST; (f), NDVI; (g), CF; (h), PD; (i), NTL; (j), ISF; (k), HAI; (l), Pearson's correlation coefficient (r) between SWA and each driver.
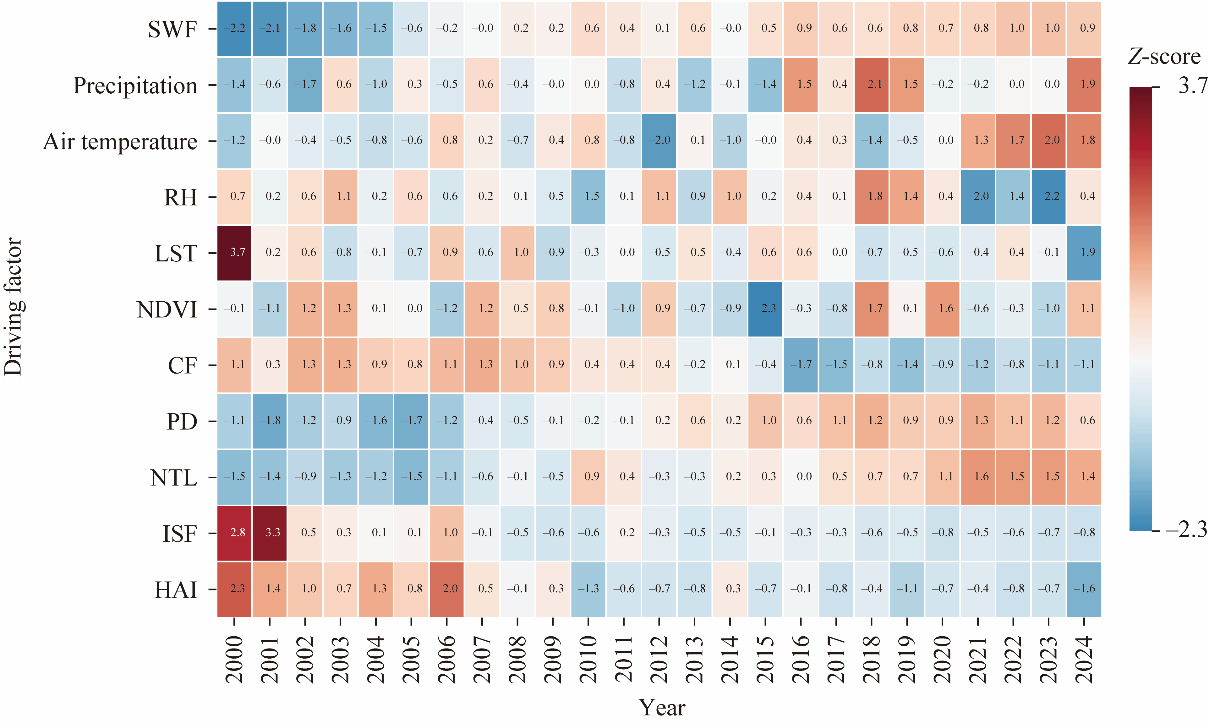
Fig. 5Spatiotemporal fingerprint (Z-score) of grid-cell SWF and driving factors during 2000-2024. Each cell represents the annual Z-score; red and blue denote positive and negative anomalies relative to the multi-year mean.
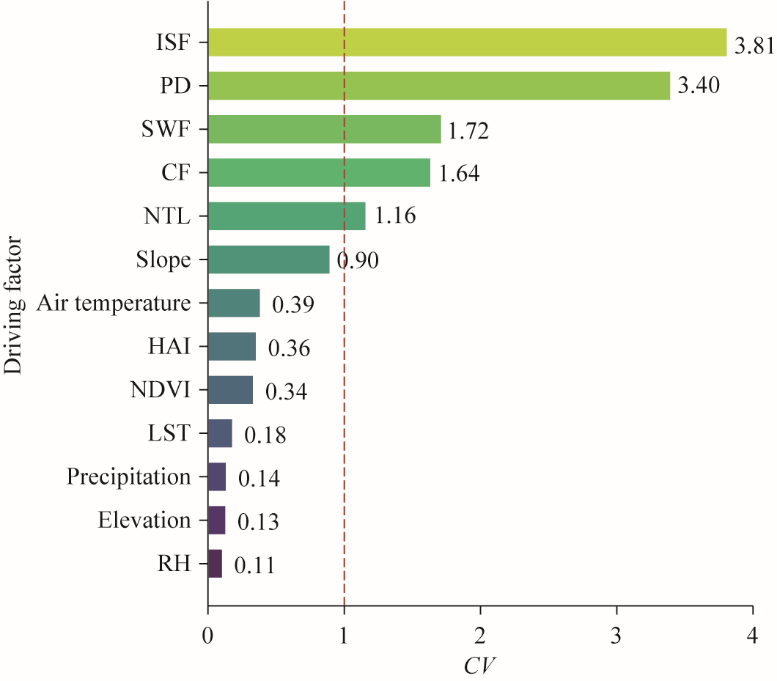
Fig. 6Spatiotemporal heterogeneity ranking of SWF and driving factors quantified by the CV. The red dashed line denotes CV=1.00; variables above this line show high heterogeneity, whereas variables below this line indicate more stable spatiotemporal patterns.
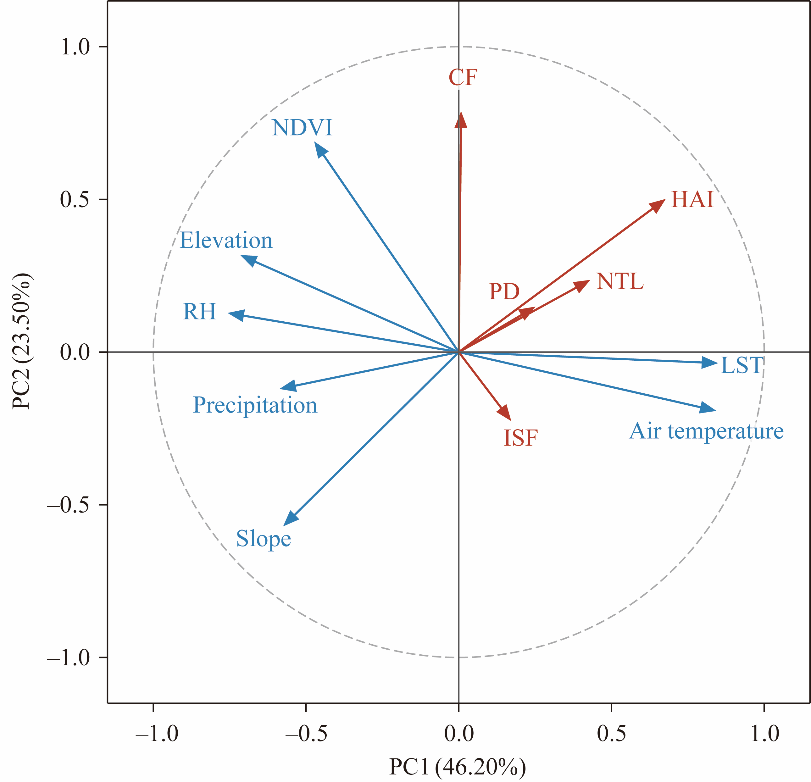
Fig. 7PCA biplot of candidate driving variables for grid-cell SWF. Arrows represent variable loadings on first principal component (PC1) and second principal component (PC2). Arrow direction indicates the sign of the loading, and arrow length indicates loading magnitude. Red arrows denote the human-activity proxy variables (PD, NTL, ISF and HAI) and blue arrows denote the hydroclimatic, terrain, and vegetation variables; the colors are used only to distinguish these analytical groups. Smaller angles between arrows indicate stronger positive correlations, angles close to 180.00° indicate negative correlations, and near-right angles indicate weak correlations. The dashed circle represents the unit circle.
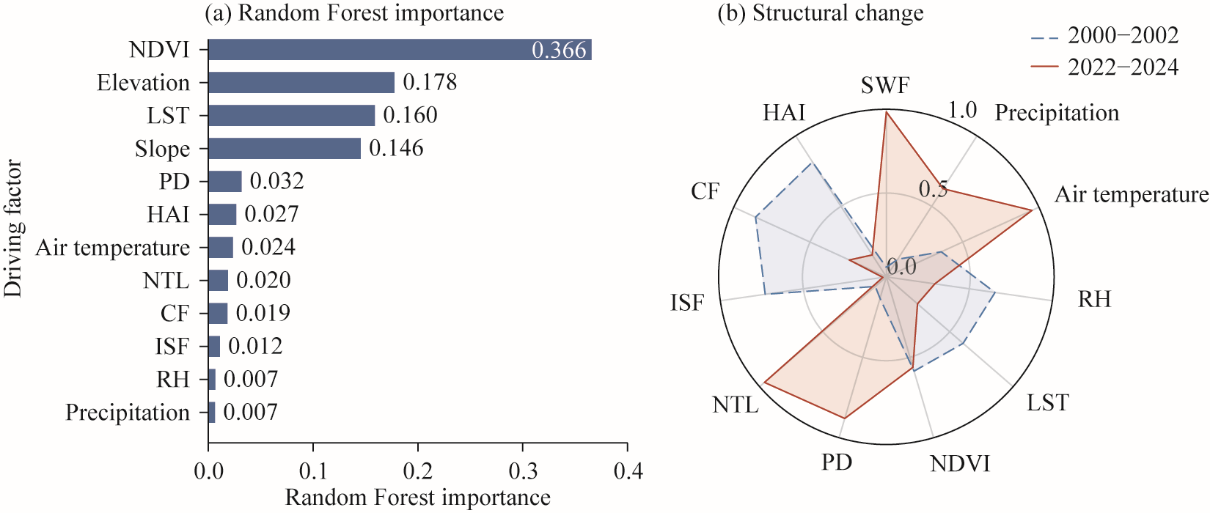
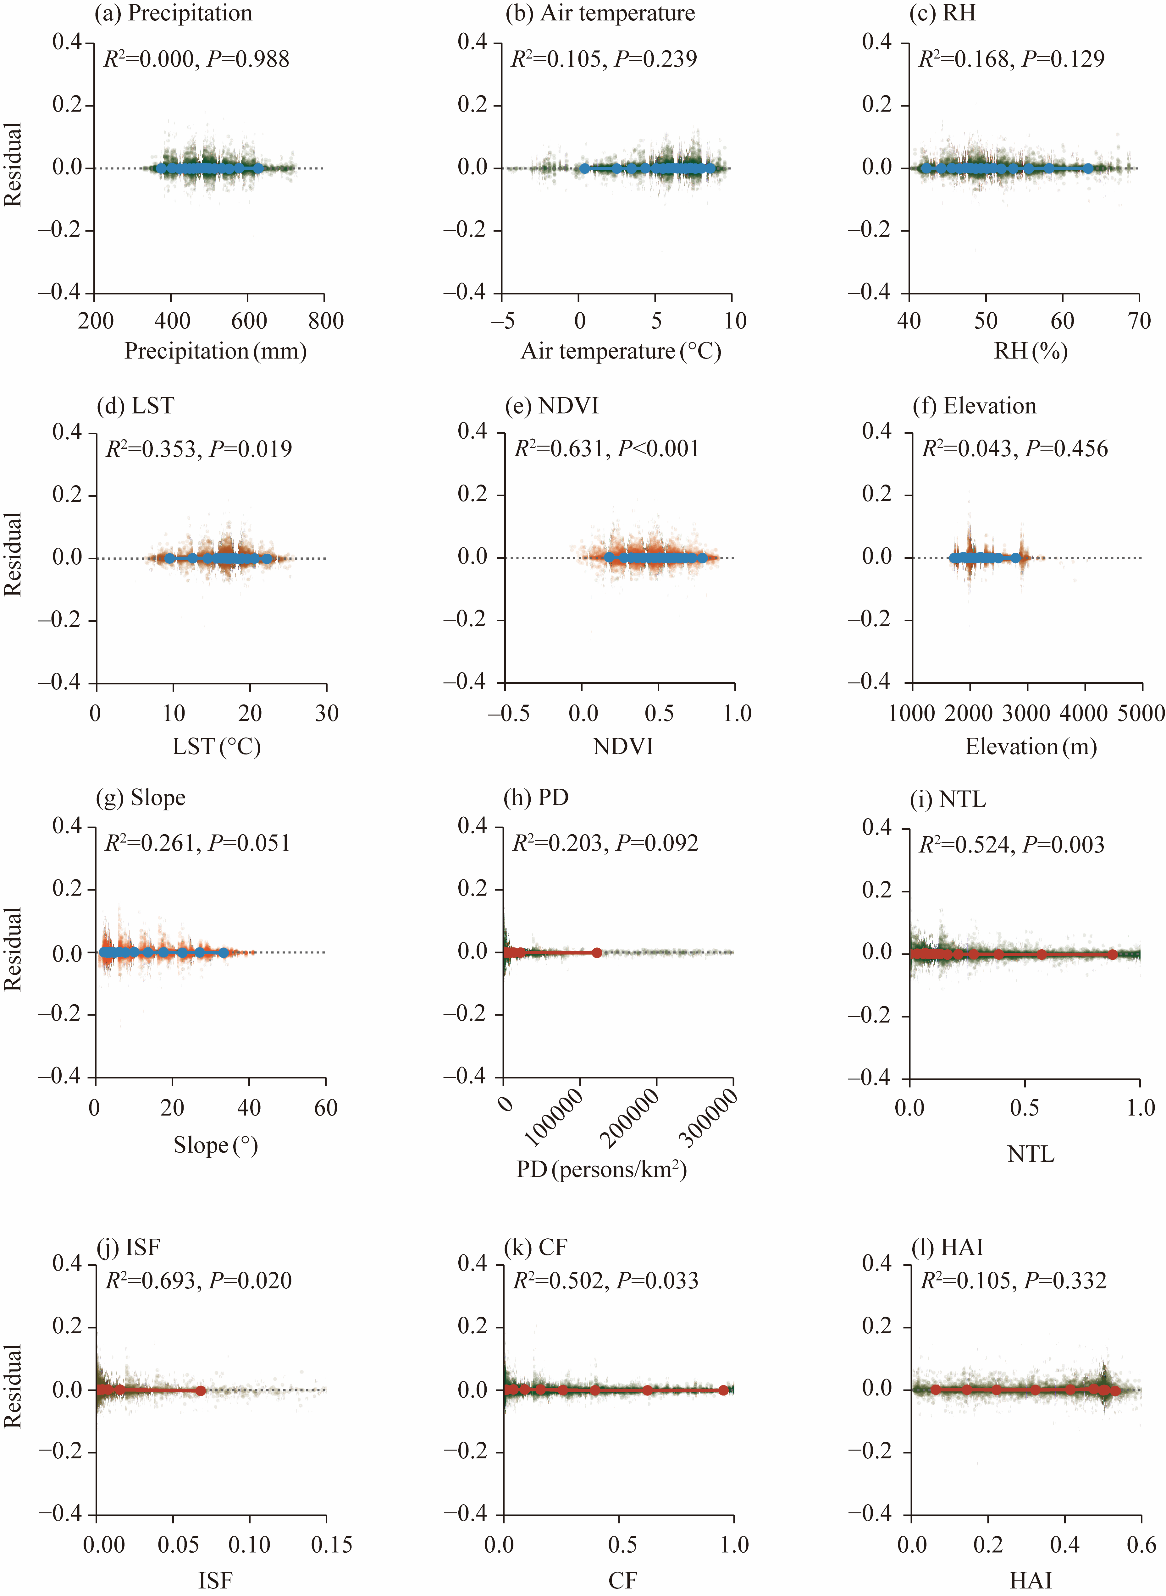
Fig. 8Random Forest importance (a) and early-late min-max-normalized profiles (b) of SWF and candidate driving variables. In Figure 8a, the importance is non-negative and bar length represents the magnitude of the importance, which does not indicate the direction of the effect. Values in Figure 8b were normalized to 0-1 across the annual series before averaging within each period.
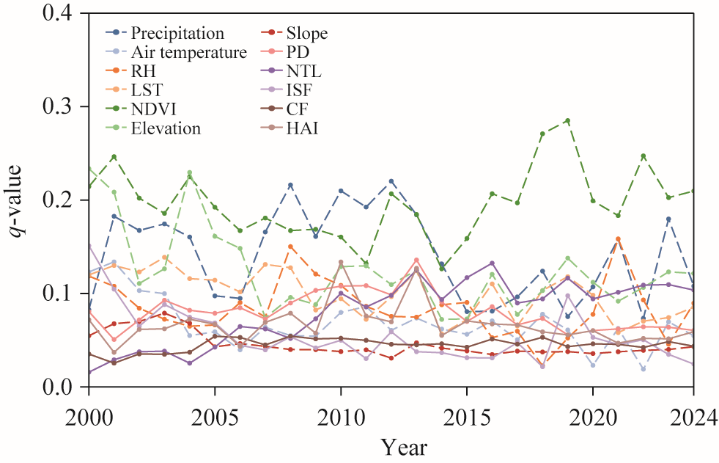
Fig. 10Temporal trends of q-values for each driving factor
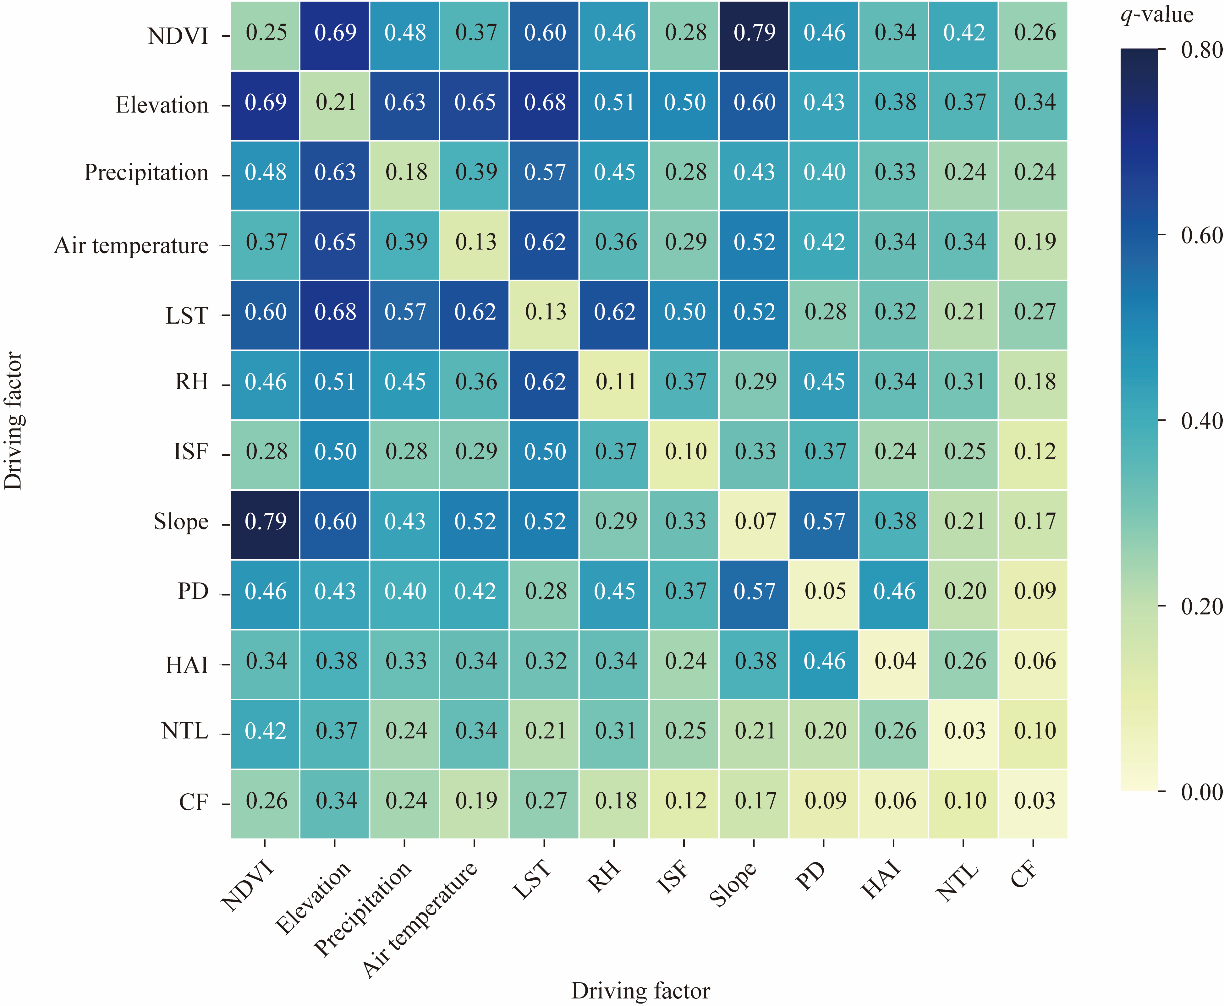
Fig. 11Interaction detector heatmap of driving factors for surface water in the study area in 2001. Diagonal values represent single-factor q-values and off-diagonal values represent two-factor interaction q-values.
[1]
Banner J L, Black B A, Tremaine D M. 2024. Positive unintended consequences of urbanization for climate-resilience of stream ecosystems. npj Urban Sustainability, 4: 16, doi: 10.1038/s42949-024-00144-1.
[2]
Best J. 2019. Anthropogenic stresses on the world's big rivers. Nature Geoscience, 12(1): 7-21.
doi: 10.1038/s41561-018-0262-x
Dong Y T, Fan L B, Zhao J, et al. 2022. Mapping of small water bodies with integrated spatial information for time series images of optical remote sensing. Journal of Hydrology, 614(Part B): 128580, doi: 10.1016/j.jhydrol.2022.128580.
[6]
Evans J, Geerken R. 2004. Discrimination between climate and human-induced dryland degradation. Journal of Arid Environments, 57(4): 535-554.
doi: 10.1016/S0140-1963(03)00121-6
[7]
Fan L J, Liu L X, Hu J, et al. 2024. A long-term evaluation of the ecohydrological regime in a semiarid basin: A case study of the Huangshui River in the Yellow River Basin, China. Hydrology, 11(10): 168, doi: 10.3390/hydrology11100168.
[8]
Feyisa G L, Meilby H, Fensholt R, et al. 2014. Automated Water Extraction Index: A new technique for surface water mapping using Landsat imagery. Remote Sensing of Environment, 140: 23-35.
doi: 10.1016/j.rse.2013.08.029
[9]
Gorelick N, Hancher M, Dixon M, et al. 2017. Google Earth Engine: Planetary-scale geospatial analysis for everyone. Remote Sensing of Environment, 202: 18-27.
doi: 10.1016/j.rse.2017.06.031
[10]
Grill G, Lehner B, Thieme M, et al. 2019. Mapping the world's free-flowing rivers. Nature, 569(7755): 215-221.
doi: 10.1038/s41586-019-1111-9
[11]
Heritage G, Entwistle N. 2020. Impacts of river engineering on river channel behaviour: Implications for managing downstream flood risk. Water, 12(5): 1355, doi: 10.3390/w12051355.
[12]
Immerzeel W W, Lutz A F, Andrade M, et al. 2020. Importance and vulnerability of the world's water towers. Nature, 577(7790): 364-369.
doi: 10.1038/s41586-019-1822-y
[13]
Jones J W. 2019. Improved automated detection of subpixel-scale inundation—Revised Dynamic Surface Water Extent (DSWE) partial surface water tests. Remote Sensing, 11(4): 374, doi: 10.3390/rs11040374.
[14]
Kaneko H. 2022. Cross-validated permutation feature importance considering correlation between features. Analytical Science Advances, 3(9-10): 278-287.
doi: 10.1002/ansa.v3.9-10
[15]
Konapala G, Mishra A K, Wada Y, et al. 2020. Climate change will affect global water availability through compounding changes in seasonal precipitation and evaporation. Nature Communications, 11: 3044, doi: 10.1038/s41467-020-16757-w.
pmid: 32576822
[16]
Lehner B, Beames P, Mulligan M, et al. 2024. The Global Dam Watch database of river barrier and reservoir information for large-scale applications. Scientific Data, 11: 1069, doi: 10.1038/s41597-024-03752-9.
pmid: 39379379
[17]
Li R, Zhu G F, Lu S Y, et al. 2023. Effects of urbanization on the water cycle in the Shiyang River Basin: Based on a stable isotope method. Hydrology and Earth System Sciences, 27(24): 4437-4452.
doi: 10.5194/hess-27-4437-2023
[18]
Li X Y, Xin Z B. 2024. Land-use composition, distribution patterns, and influencing factors of villages in the Hehuang Valley, Qinghai, China, based on UAV photogrammetry. Remote Sensing, 16(12): 2213, doi: 10.3390/rs16122213.
[19]
Liu L X, Fan L J, Hu J, et al. 2024. Human activities impacts on runoff and ecological flow in the Huangshui River of the Yellow River Basin, China. Water, 16(16): 2331, doi: 10.3390/w16162331.
[20]
Mann H B. 1945. Nonparametric tests against trend. Econometrica, 13(3): 245-259.
doi: 10.2307/1907187
[21]
Mao X F, Wei X Y, Engel B, et al. 2021. Biological response to 5 years of operations of cascade rubber dams in a plateau urban river, China. River Research and Applications, 37(8): 1201-1211.
doi: 10.1002/rra.v37.8
[22]
Masek J G, Wulder M A, Markham B, et al. 2020. Landsat 9: Empowering open science and applications through continuity. Remote Sensing of Environment, 248: 111968, doi: 10.1016/j.rse.2020.111968.
[23]
Mulligan M, van Soesbergen A, Sáenz L. 2020. GOODD, a global dataset of more than 38,000 georeferenced dams. Scientific Data, 7: 31, doi: 10.1038/s41597-020-0362-5.
pmid: 31964896
[24]
Oswald C J, Kelleher C, Ledford S, et al. 2023. Integrating urban water fluxes and moving beyond impervious surface cover: A review. Journal of Hydrology, 618: 129188, doi: 10.1016/j.jhydrol.2023.129188.
[25]
Pekel J F, Cottam A, Gorelick N, et al. 2016. High-resolution mapping of global surface water and its long-term changes. Nature, 540(7633): 418-422.
doi: 10.1038/nature20584
[26]
Pickens A H, Hansen M C, Hancher M, et al. 2020. Mapping and sampling to characterize global inland water dynamics from 1999 to 2018 with full Landsat time-series. Remote Sensing of Environment, 243: 111792, doi: 10.1016/j.rse.2020.111792.
[27]
Ran Q W, Aires F, Ciais P, et al. 2023. The status and influencing factors of surface water dynamics on the Qinghai-Tibet Plateau during 2000-2020. IEEE Transactions on Geoscience and Remote Sensing, 61: 4200114, doi: 10.1109/TGRS.2022.3231552.
[28]
Sen P K. 1968. Estimates of the regression coefficient based on Kendall's Tau. Journal of the American Statistical Association, 63(324): 1379-1389.
doi: 10.1080/01621459.1968.10480934
[29]
Sui T B, Ye C M, Tang R, et al. 2023. Spatio-temporal change monitoring for surface water on the Qinghai-Tibet Plateau from 1990 to 2020 using remote sensing. Frontiers in Earth Science, 11: 1124425, doi: 10.3389/feart.2023.1124425.
[30]
Tyralis H, Papacharalampous G A, Langousis A. 2019. A brief review of random forests for water scientists and practitioners and their recent history in water resources. Water, 11(5): 910, doi: 10.3390/w11050910.
[31]
Vanderhoof M K, Alexander L, Christensen J, et al.2023. High-frequency time series comparison of Sentinel-1 and Sentinel-2 satellites for mapping open and vegetated water across the United States (2017-2021). Remote Sensing of Environment, 288: 113498, doi: 10.1016/j.rse.2023.113498.
[32]
Veldkamp T I E, Wada Y, Aerts J C J H, et al. 2017. Water scarcity hotspots travel downstream due to human interventions in the 20th and 21st century. Nature Communications, 8: 15697, doi: 10.1038/ncomms15697.
pmid: 28643784
[33]
Viviroli D, Dürr H H, Messerli B, et al. 2007. Mountains of the world, water towers for humanity: Typology, mapping, and global significance. Water Resources Research, 43(7): W07447, doi: 10.1029/2006WR005653.
[34]
Viviroli D, Kummu M, Meybeck M, et al. 2020. Increasing dependence of lowland populations on mountain water resources. Nature Sustainability, 3(11): 917-928.
doi: 10.1038/s41893-020-0559-9
[35]
Wang J F, Li X H, Christakos G, et al. 2010. Geographical detectors-based health risk assessment and its application in the neural tube defects study of the Heshun Region, China. International Journal of Geographical Information Science, 24(1): 107-127.
doi: 10.1080/13658810802443457
[36]
Wang J F, Zhang T L, Fu B J. 2016. A measure of spatial stratified heterogeneity. Ecological Indicators, 67: 250-256.
doi: 10.1016/j.ecolind.2016.02.052
[37]
Wei H, Lu C H, Liu Y Q. 2021. Farmland changes and their ecological impact in the Huangshui River Basin. Land, 10(10): 1082, doi: 10.3390/land10101082.
[38]
Wessels K J, Prince S D, Malherbe J, et al. 2007. Can human-induced land degradation be distinguished from the effects of rainfall variability? A case study in South Africa. Journal of Arid Environments, 68(2): 271-297.
doi: 10.1016/j.jaridenv.2006.05.015
[39]
Wies C, Miltenberger R, Grieser G, et al. 2023. Exploring the variable importance in random forests under correlations: A general concept applied to donor organ quality in post-transplant survival. BMC Medical Research Methodology, 23: 209, doi: 10.1186/s12874-023-02023-2.
pmid: 37726680
[40]
Xiao Z, Ding M J, Li L H, et al. 2024. Divergent changes of surface water and its climatic drivers in the headwater region of the Three Rivers on the Qinghai-Tibet Plateau. Ecological Indicators, 158: 111615, doi: 10.1016/j.ecolind.2024.111615.
[41]
Xu B, Mao X F, Li X Y, et al. 2024. Anthropogenic activities dominated the spatial and temporal changes of normalized difference vegetation index (NDVI) in the Hehuang Valley in the northeastern Qinghai Province between 2000 and 2020. Frontiers in Environmental Science, 12: 1384032, doi: 10.3389/fenvs.2024.1384032.
[42]
Xu H Q. 2006. Modification of normalized difference water index (NDWI) to enhance open water features in remotely sensed imagery. International Journal of Remote Sensing, 27(14): 3025-3033.
doi: 10.1080/01431160600589179
[43]
Zhang A T, Gu V X. 2023. Global Dam Tracker: A database of more than 35,000 dams with location, catchment, and attribute information. Scientific Data, 10: 111, doi: 10.1038/s41597-023-02008-2.
pmid: 36823207
[44]
Zhang J, Du J Q, Fang S F, et al. 2023. Dynamic changes, spatiotemporal differences, and ecological effects of impervious surfaces in the Yellow River Basin, 1986-2020. Remote Sensing, 15(1): 268, doi: 10.3390/rs15010268.