| Research article |
|


|
|
|
| Impact of climate change and land use/cover change on water yield in the Liaohe River Basin, Northeast China |
LYU Leting1,2,*( ), JIANG Ruifeng1, ZHENG Defeng1,2, LIANG Liheng3 ), JIANG Ruifeng1, ZHENG Defeng1,2, LIANG Liheng3 |
1College of Geosciences, Liaoning Normal University, Dalian 116029, China
2Dalian Key Laboratory of Agro-Meteorological Disaster Risk Prevention and Control, Dalian 116029, China
3College of Geographic Sciences, Changchun Normal University, Changchun 130032, China |
|
|
|
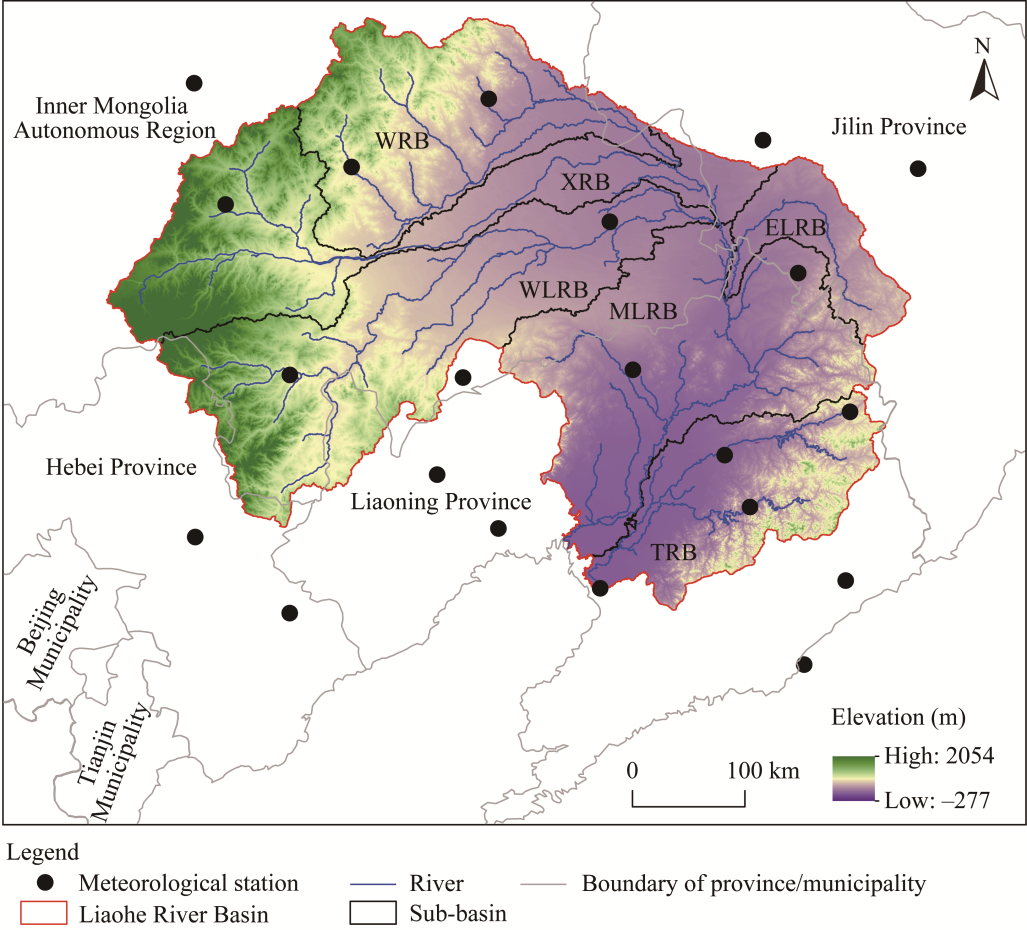
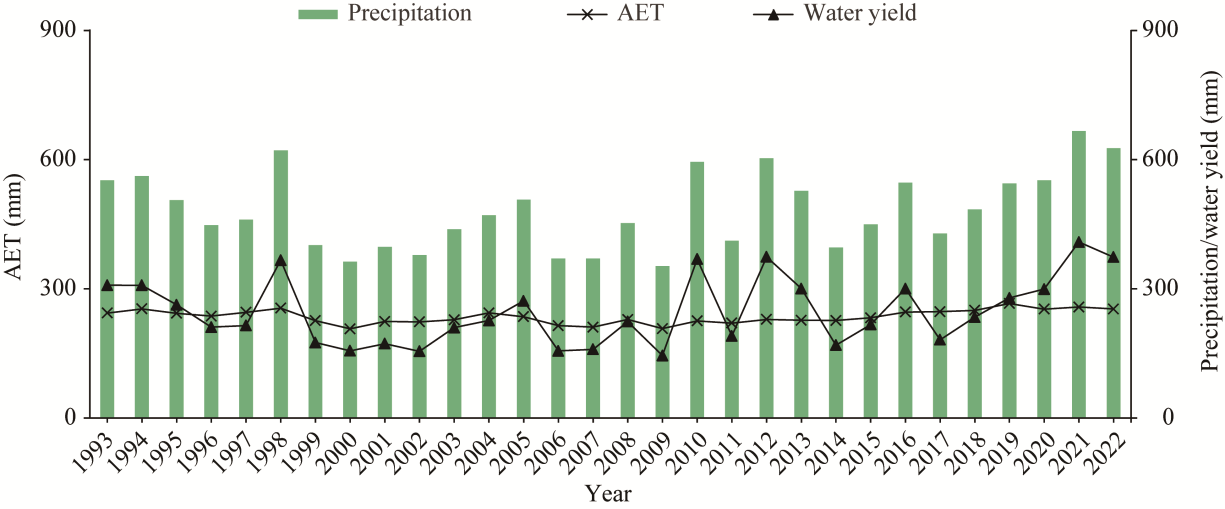
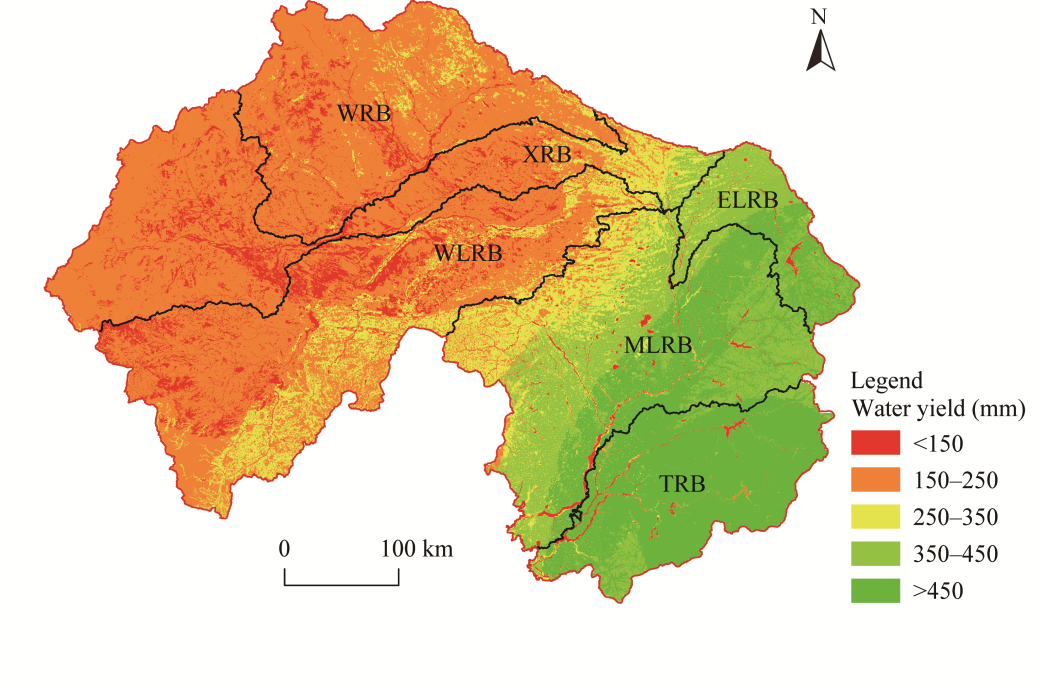
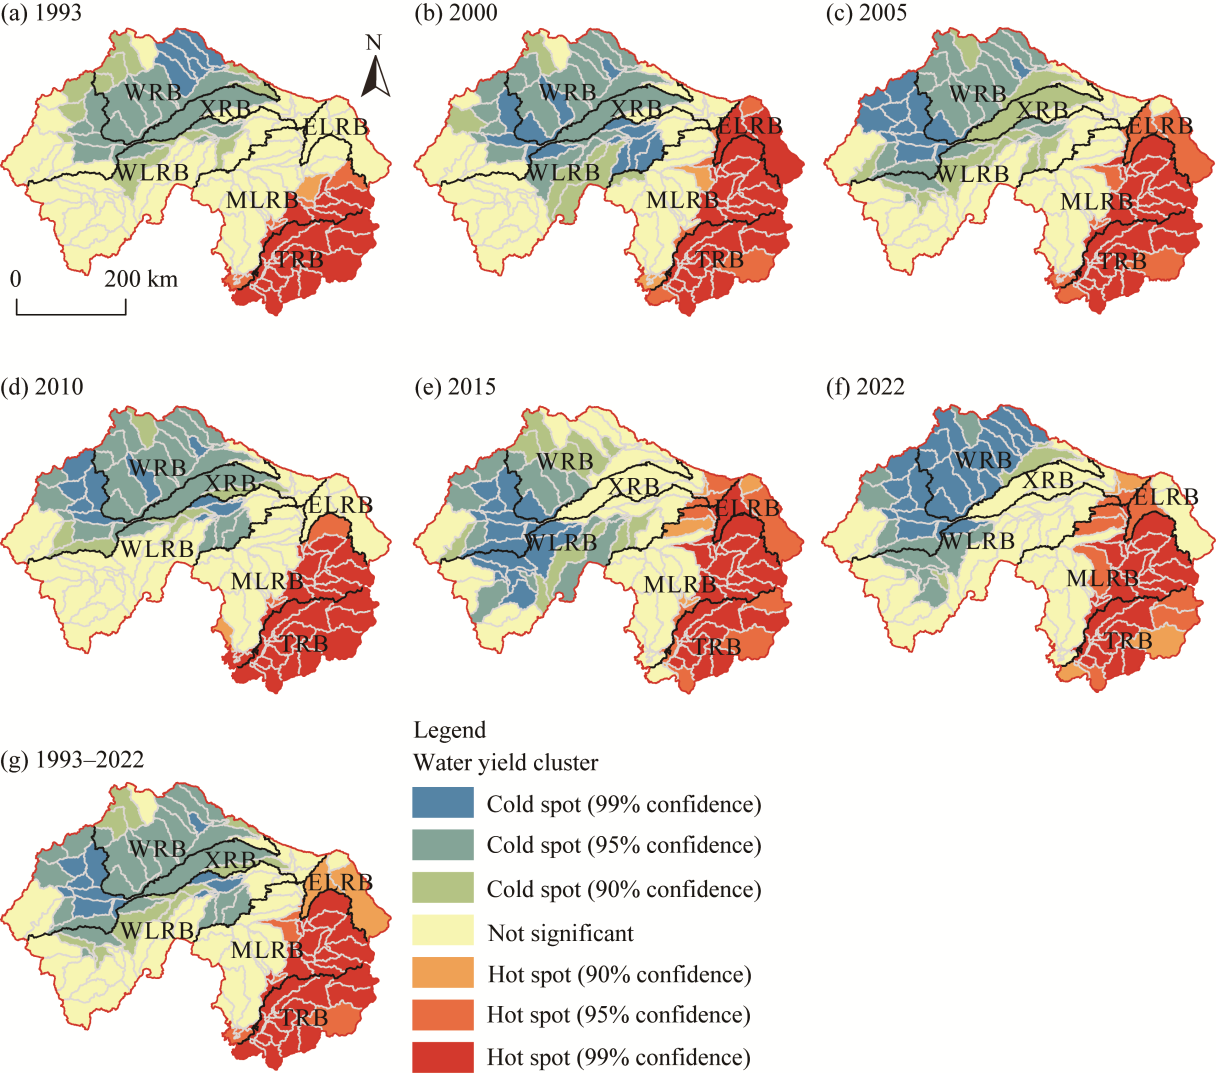
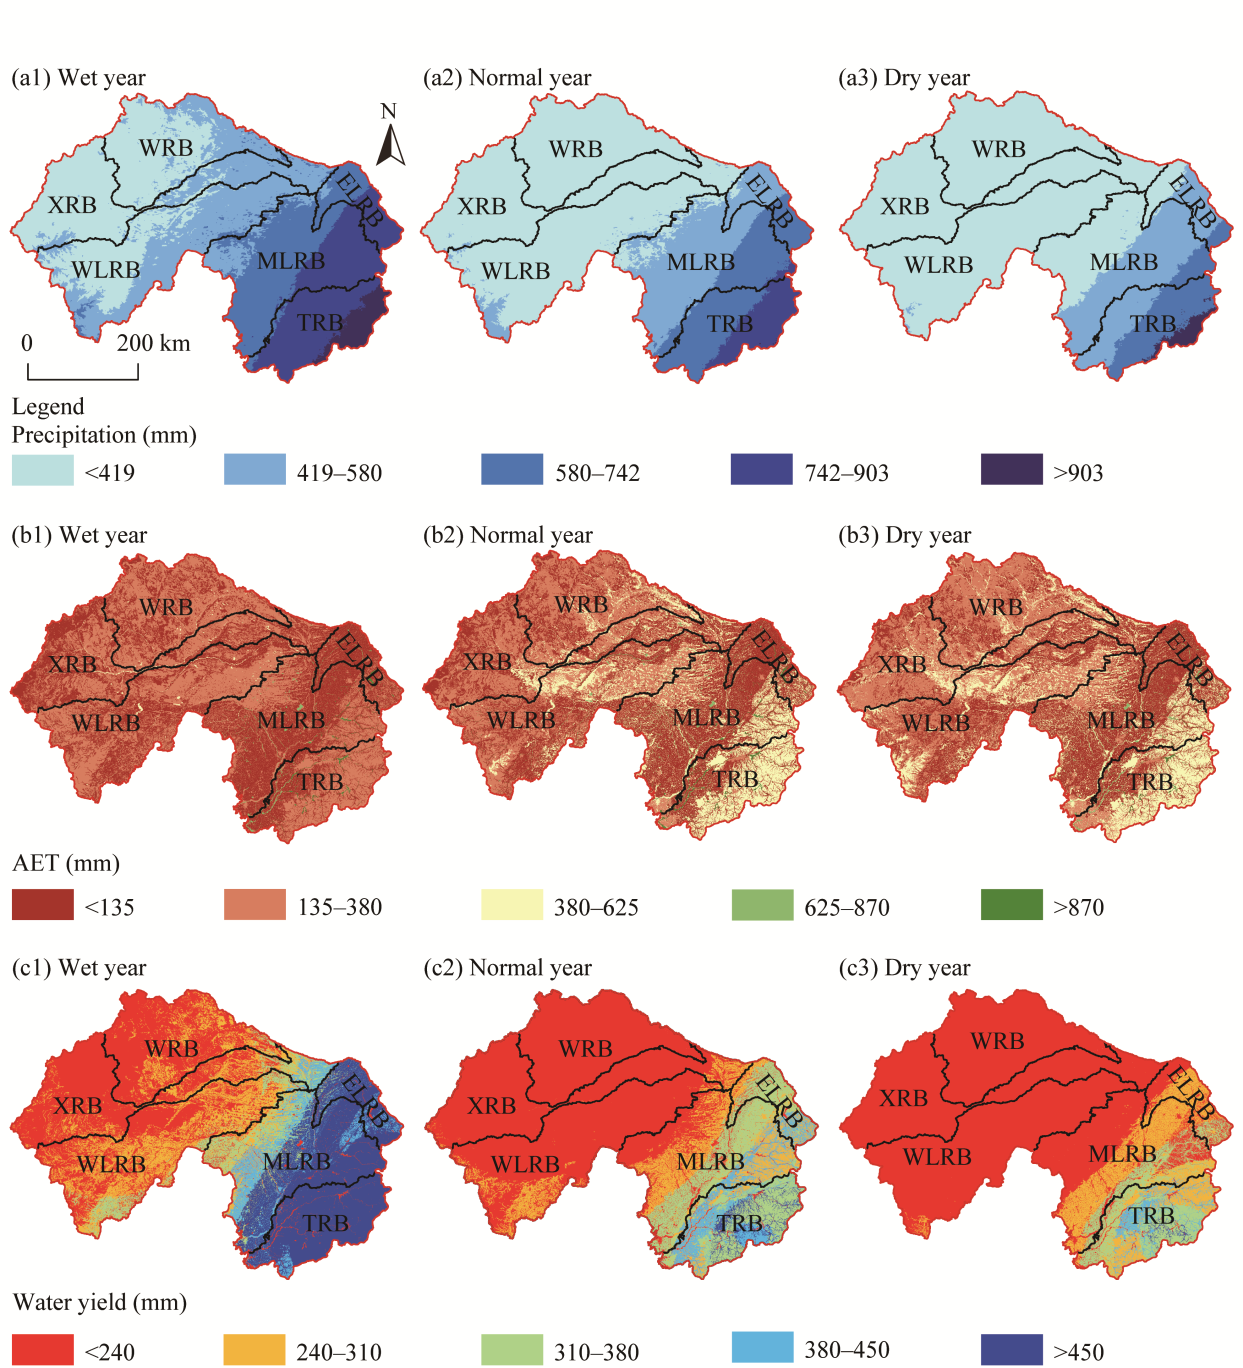
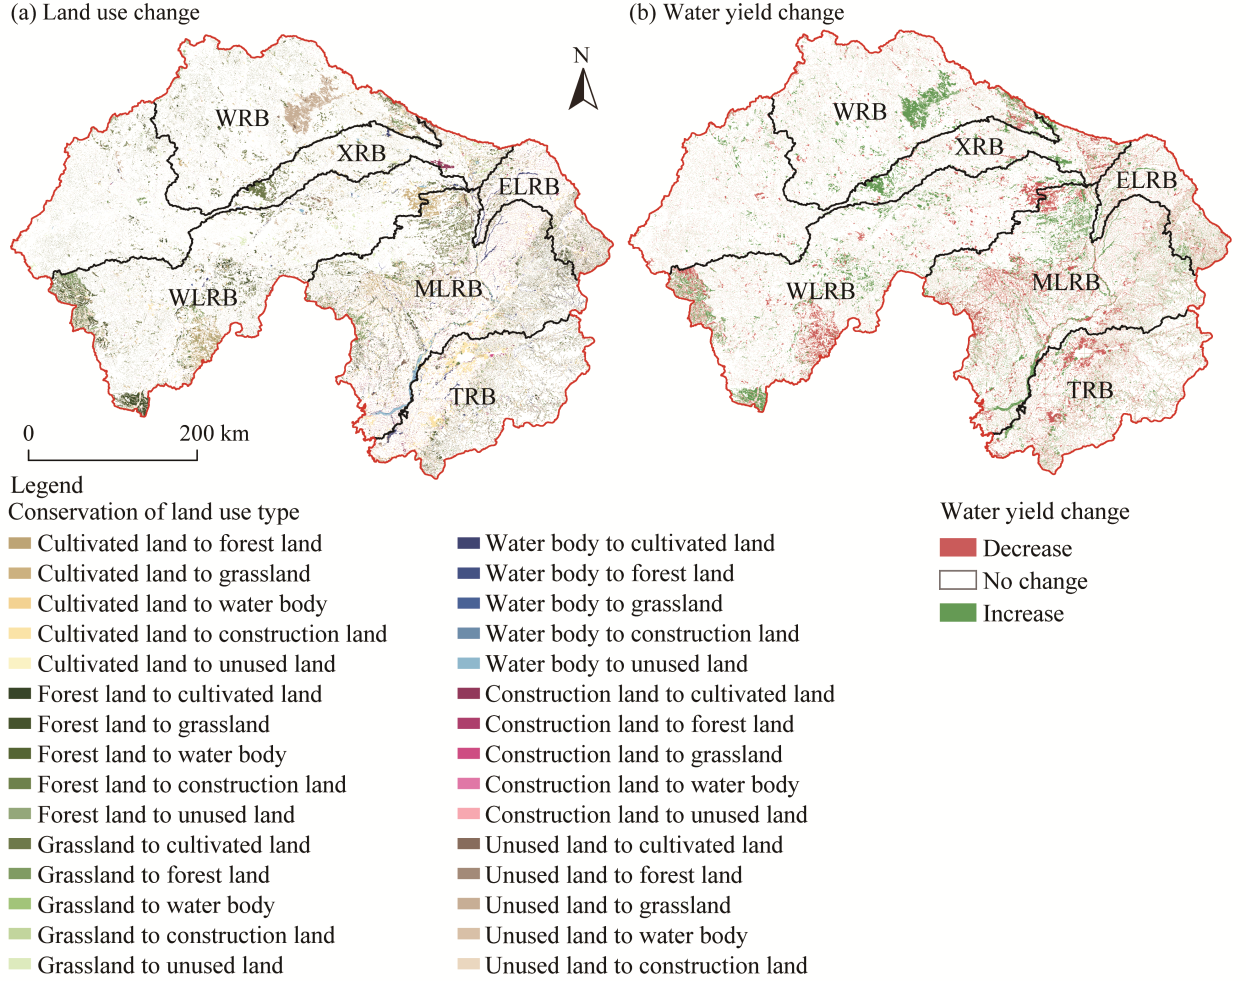
Abstract The Liaohe River Basin (LRB) in Northeast China, a critical agricultural and industrial zone, has faced escalating water resource pressures in recent decades due to rapid urbanization, intensified land use changes, and climate variability. Understanding the spatiotemporal dynamics of water yield and its driving factors is essential for sustainable water resource management in this ecologically sensitive region. This study employed the Integrated Valuation of Ecosystem Services and Tradeoffs (InVEST) model to quantify the spatiotemporal patterns of water yield in the LRB (dividing into six sub-basins from east to west: East Liaohe River Basin (ELRB), Taizi River Basin (TRB), Middle Liaohe River Basin (MLRB), West Liaohe River Basin (WLRB), Xinkai River Basin (XRB), and Wulijimuren River Basin (WRB)) from 1993 to 2022, with a focus on the impacts of climate change and land use cover change (LUCC). Results revealed that the LRB had an average annual precipitation of 483.15 mm, with an average annual water yield of 247.54 mm, both showing significant upward trend over the 30-a period. Spatially, water yield demonstrated significant heterogeneity, with higher values in southeastern sub-basins and lower values in northwestern sub-basins. The TRB exhibited the highest water yield due to abundant precipitation and favorable topography, while the WRB recorded the lowest water yield owing to arid conditions and sparse vegetation. Precipitation played a significant role in shaping the annual fluctuations and total volume of water yield, with its variability exerting substantially greater impacts than actual evapotranspiration (AET) and LUCC. However, LUCC, particularly cultivated land expansion and grassland reduction, significantly reshaped the spatial distribution of water yield by modifying surface runoff and infiltration patterns. This study provides critical insights into the spatiotemporal dynamics of water yield in the LRB, emphasizing the synergistic effects of climate change and land use change, which are pivotal for optimizing water resource management and advancing regional ecological conservation.
|
|
Received: 25 July 2024
Published: 28 February 2025
|
|
Corresponding Authors:
*LYU Leting (E-mail: lvleting@lnnu.edu.cn)
|
|
|
| [1] |
Anache J A A, Flanagan D C, Srivastava A, et al. 2018. Land use and climate change impacts on runoff and soil erosion at the hillslope scale in the Brazilian Cerrado. Science of the Total Environment, 622-623: 140-151.
|
|
|
| [2] |
Bejagam V, Keesara V R, Sridhar V. 2022. Impacts of climate change on water provisional services in Tungabhadra Basin using InVEST model. River Research and Applications, 38(1): 94-106.
|
|
|
| [3] |
Cheng B, Li H E. 2020. Impact of climate change and human activities on economic values produced by ecosystem service functions of rivers in water shortage area of Northwest China. Environmental Science and Pollution Research, 27: 26570-26578.
|
|
|
| [4] |
Chu J Y, Wang Z C, Bao X G, et al. 2024. Addressing the contradiction between water supply and demand: a study on multi-objective regional water resources optimization allocation. Environment, Development and Sustainability, doi: 10.1007/s10668-024-05214-z.
|
|
|
| [5] |
Daneshi A, Brouwer R, Najafinejad A, et al. 2021. Modelling the impacts of climate and land use change on water security in a semi-arid forested watershed using InVEST. Journal of Hydrology, 593: 125621, doi: 10.1016/j.jhydrol.2020.125621.
|
|
|
| [6] |
Dashtbozorgi F, Hedayatiaghmashhadi A, Dashtbozorgi A, et al. 2023. Ecosystem services valuation using InVEST modeling: Case from southern Iranian mangrove forests. Regional Studies in Marine Science, 60: 102813, doi: 10.1016/j.rsma.2023.102813.
|
|
|
| [7] |
Donohue R J, Roderick M L, McVicar T R. 2012. Roots, storms and soil pores: Incorporating key ecohydrological processes into Budyko's hydrological model. Journal of Hydrology, 436-437: 35-50.
|
|
|
| [8] |
Emlaei Z, Pourebrahim S, Heidari H, et al. 2022. The impact of climate change as well as land-use and land-cover changes on water yield services in Haraz Basin. Sustainability, 14(13): 7578, doi: 10.3390/su14137578.
|
|
|
| [9] |
Getis A, Ord J K. 1995. Local spatial autocorrelation statistics: distributional issues and an application. Geographical Analysis, 27(4), 286-306.
|
|
|
| [10] |
Gharun M, Vervoort R W, Turnbull T L, et al. 2014. A test of how coupling of vegetation to the atmosphere and climate spatial variation affects water yield modelling in mountainous catchments. Journal of Hydrology, 514: 202-213.
|
|
|
| [11] |
Gomariz-Castillo F, Alonso-Sarría F, Cabezas-Calvo-Rubio F. 2018. Calibration and spatial modelling of daily ET0 in semiarid areas using Hargreaves equation. Earth Science Informatics, 11: 325-340.
|
|
|
| [12] |
Griffith D A. 2021. Interpreting Moran eigenvector maps with the Getis-Ord Gi* statistic. The Professional Geographer, 73(3): 447-463.
|
|
|
| [13] |
Guo Q, Yu C X, Xu Z H, et al. 2023. Impacts of climate and land-use changes on water yields: Similarities and differences among typical watersheds distributed throughout China. Journal of Hydrology: Regional Studies, 45: 101294, doi: 10.1016/j.ejrh.2022.101294.
|
|
|
| [14] |
Gusev E M, Nasonova O N, Kovalev E E, et al. 2019. Impact of possible climate change on extreme annual runoff from river basins located in different regions of the globe. Water Resources, 46(Suppl. 1): S126-S136.
|
|
|
| [15] |
Hasan S S, Lin Z, Miah M G, et al. 2020. Impact of land use change on ecosystem services: A review. Environmental Development, 34: 100527, doi: 10.1016/j.envdev.2020.100527.
|
|
|
| [16] |
Hu W M, Yang R H, Jia G Y, et al. 2022. Response of water yield function to land use changes and its driving factors in the Yangtze River Basin. Acta Ecologica Sinica, 42(17): 7011-7027. (in Chinese)
|
|
|
| [17] |
Hu Y F, Gao M, Batunacun. 2020. Evaluations of water yield and soil erosion in the Shaanxi-Gansu Loess Plateau under different land use and climate change scenarios. Environmental Development, 34: 100488, doi: 10.1016/j.envdev.2019.100488.
|
|
|
| [18] |
Jiang C, Li D Q, Wang D W, et al. 2016. Quantification and assessment of changes in ecosystem service in the Three-River Headwaters Region, China as a result of climate variability and land cover change. Ecological Indicators, 66: 199-211.
|
|
|
| [19] |
Jiang D, Xin Y D. 2022. Study on the impact of meteorological factors on evapotranspiration in the Liaohe River Basin. Water Resources & Hydropower of Northeast China, 40(11): 33-34. (in Chinese)
|
|
|
| [20] |
Kiziloglu F M, Sahin U, Kuslu Y, et al. 2009. Determining water-yield relationship, water use efficiency, crop and pan coefficients for silage maize in a semiarid region. Irrigation Science, 27: 129-137.
|
|
|
| [21] |
Latinopoulos D, Koulouri M, Kagalou I. 2021. How historical land use/land cover changes affected ecosystem services in Lake Pamvotis, Greece. Human and Ecological Risk Assessment, 27(6): 1472-1491.
|
|
|
| [22] |
Li M, Li S S, Liu H C, et al. 2023. Balancing water ecosystem services: assessing water yield and purification in Shanxi. Water, 15(18): 3261, doi: 10.3390/w15183261.
|
|
|
| [23] |
Li M Y, Liang D, Xia J, et al. 2021a. Evaluation of water conservation function of Danjiang River Basin in Qinling Mountains, China based on InVEST model. Journal of Environmental Management, 286: 112212, doi: 10.1016/j.jenvman.2021.112212.
|
|
|
| [24] |
Li R J, Li H M, Wu F F, et al. 2024a. Study on the spatial differentiation pattern and driving forces of ecosystem services in Qinghai Lake Basin. Ecology and Environment Sciences, 33(2): 301-309. (in Chinese)
|
|
|
| [25] |
Li S, Du T, Gippel C J. 2022. A modified Fu (1981) equation with a time-varying parameter that improves estimates of inter-annual variability in catchment water balance. Water Resources Management, 36: 1645-1659.
|
|
|
| [26] |
Li X L, Xu X F, Sonnenborg T O, et al. 2024b. Effect of ecological restoration on evapotranspiration and water yield in the agro-pastoral ecotone in northern China during 2000-2018. Journal of Hydrology, 638: 131531, doi: 10.1016/j.jhydrol.2024.131531.
|
|
|
| [27] |
Li X Y, Guo J M, Qi S Z. 2021b. Forestland landscape change induced spatiotemporal dynamics of subtropical urban forest ecosystem services value in forested region of China: A case of Hangzhou City. Environmental Research, 193: 110618, doi: 10.1016/j.envres.2020.110618.
|
|
|
| [28] |
Liang J, Li S, Li X D, et al. 2021. Trade-off analyses and optimization of water-related ecosystem services (WRESs) based on land use change in a typical agricultural watershed, southern China. Journal of Cleaner Production, 279: 123851, doi: 10.1016/j.jclepro.2020.123851.
|
|
|
| [29] |
Malhi Y, Franklin J, Seddon N, et al. 2020. Climate change and ecosystems: threats, opportunities and solutions. Philosophical Transactions of the Royal Society B, 375(1794): 20190104, doi: 10.1098/rstb.2019.0104.
|
|
|
| [30] |
Mao C R, Dai L M, Qi L, et al. 2020. Constructing of ecological security pattern based on ecosystem services: A case study of the Liaohe River Basin, Liaoning Province, China. Acta Ecologica Sinica, 40(18): 6486-6494. (in Chinese)
|
|
|
| [31] |
Nahib I, Ambarwulan W, Rahadiati A, et al. 2021. Assessment of the impacts of climate and LULC changes on the water yield in the Citarum River Basin, West Java Province, Indonesia. Sustainability, 13(7): 3919, doi: 10.3390/su13073919.
|
|
|
| [32] |
Ningrum A, Setiawan Y, Tarigan S D. 2022. Annual water yield analysis with InVEST model in Tesso Nilo National Park, Riau Province. IOP Conference Series: Earth and Environmental Science, 950: 012098, doi: 10.1088/1755-1315/950/1/012098.
|
|
|
| [33] |
Qi X K, Li Q, Yue Y M, et al. 2021. Rural-urban migration and conservation drive the ecosystem services improvement in China karst: A case study of Huanjiang County, Guangxi. Remote Sensing, 13(4): 566, doi: 10.3390/rs13040566.
|
|
|
| [34] |
Redhead J W, Stratford C, Sharps K, et al. 2016. Empirical validation of the InVEST water yield ecosystem service model at a national scale. Science of the Total Environment, 569-570: 1418-1426.
|
|
|
| [35] |
Ren Q R, Liu D D, Liu Y F. 2023. Spatio-temporal variation of ecosystem services and the response to urbanization: Evidence based on Shandong Province of China. Ecological Indicators, 151: 110333, doi: 10.1016/j.ecolind.2023.110333.
|
|
|
| [36] |
Rodríguez V A, Mazza S M. 2020. The impact of land use change on water resources. International Water and Irrigation, doi: 10.52783/iwi.v39i2.20.
|
|
|
| [37] |
Singkran N, Intharawichian N, Anantawong P. 2021. Determining land use influences on the hydrologic regime of the Chao Phraya River Basin, Thailand. Physics and Chemistry of the Earth, Parts A/B/C, 121: 102978, doi: 10.1016/j.pce.2021.102978.
|
|
|
| [38] |
Song S, Fang L H, Yang J X, et al. 2024. The spatial-temporal matching characteristics of water resources and socio-economic development factors: A case study of Guangdong Province. Water, 16(2): 362, doi: 10.3390/w16020362.
|
|
|
| [39] |
Todhunter P E, Jackson C C, Mahmood T H, et al. 2020. Streamflow partitioning using the Budyko framework in a northern glaciated watershed under drought to deluge conditions. Journal of Hydrology, 591: 125569, doi: 10.1016/J.HYDROL.2020.125569.
|
|
|
| [40] |
Wan Z G, Ding W G, Pu X T, et al. 2023. Analysis of temporal and spatial changes in water yield and driving factors in Qilian Mountain National Park. Journal of Soil and Water Conservation, 37(6): 161-169. (in Chinese)
|
|
|
| [41] |
Wang X J, Liu G X, Lin D R, et al. 2022a. Water yield service influenced by climate and land use change based on InVEST model in the monsoon hilly watershed in South China. Geomatics, Natural Hazards and Risk, 13(1): 2024-2048.
|
|
|
| [42] |
Wang Y F, Ye A Z, Peng D Z, et al. 2022b. Spatiotemporal variations in water conservation function of the Tibetan Plateau under climate change based on InVEST model. Journal of Hydrology: Regional Studies, 41: 101064, doi: 10.1016/j.ejrh.2022.101064.
|
|
|
| [43] |
Wu C X, Qiu D X, Gao P, et al. 2022. Application of the InVEST model for assessing water yield and its response to precipitation and land use in the Weihe River Basin, China. Journal of Arid Land, 14(4): 426-440.
doi: 10.1007/s40333-022-0013-0
|
|
|
| [44] |
Xu Z X, Liu X C, Li Y L. 2015. Zoning of aquatic ecoregions at levels Ⅰ and Ⅱ: Case study in Liaohe Basin. Advances in Science and Technology of Water Resources, 35(5): 176-180. (in Chinese)
|
|
|
| [45] |
Yang J, Xie B P, Zhang D G, et al. 2020. Response of temporal and spatial changes in water yield in the Yellow River Basin to precipitation and land use changes based on the InVEST model. Chinese Journal of Applied Ecology, 31(8): 2731-2739. (in Chinese)
|
|
|
| [46] |
Yang Y. 2024. Evaluation of water security in Liaohe River Basin. Heilongjiang Hydraulic Science and Technology, 52(1): 155-159. (in Chinese)
|
|
|
| [47] |
Yin L C, Feng X M, Fu B J, et al. 2021. A coupled human-natural system analysis of water yield in the Yellow River Basin, China. Science of the Total Environment, 762: 143141, doi: 10.1016/j.scitotenv.2020.143141.
|
|
|
| [48] |
Yudistiro, Kusratmoko E, Semedi J M. 2019. Water availability in Patuha Mountain region using InVEST model "hydropower water yield". E3S Web of Conferences, 125: 01015, doi: 10.1051/e3sconf/201912501015.
|
|
|
| [49] |
Zhang K W, Zhang Q, Wang G, et al. 2024. Spatiotemporal interactions between soil moisture and water availability across the Yellow River Basin, China. Journal of Hydrology: Regional Studies, 54: 101874, doi: 10.1016/j.ejrh.2024.101874.
|
|
|
| [50] |
Zhang S D. 2021. Study on the relationship between supply and demand of ecosystem services in Liaohe River Basin. MSc Thesis. Yanji: Yanbian University. (in Chinese)
|
|
|
| [51] |
Zhang S D, Li M Y, Xiang H X, et al. 2021a. Trade-offs and synergies of ecosystem services in the Liaohe River Basin. Agricultural Science Journal of Yanbian University, 43(1): 73-83. (in Chinese)
|
|
|
| [52] |
Zhang Y C, Rossow W B, Lacis A A, et al. 2004. Calculation of radiative fluxes from the surface to top of atmosphere based on ISCCP and other global data sets: Refinements of the radiative transfer model and the input data. Journal of Geophysical Research Atmospheres, 109(D19): D19105, doi: 10.1029/2003JD004457.
|
|
|
| [53] |
Zhang Y L, Guo X L, Wang N, et al. 2021b. Analysis on the optimal sowing date of dry-land winter wheat under different precipitation pattern based on wheat decision system. Chinese Journal of Agrometeorology, 42(6): 475-485. (in Chinese)
|
|
|
| [54] |
Zhang Z D, Yang Y, Chen Y C, et al. 2020. Spatial-temporal analysis of water supply services at different scales in the Wuhua River Basin. Geoinformatics in Sustainable Ecosystem and Society, 1228: 290-306.
|
|
|
| [55] |
Zhao Y Z, Wang L C, Jiang Q X, et al. 2024. Sensitivity of gross primary production to precipitation and the driving factors in China's agricultural ecosystems. Science of the Total Environment, 948: 174938, doi: 10.1016/j.scitotenv.2024.174938.
|
|
|
| [56] |
Zheng C X. 2018. Study on matching degree of water resources status and social economic development in Liaohe River Basin. Water Resources Planning and Design, 6: 1-3, 41. (in Chinese)
|
|
|
|
Viewed |
|
|
|
Full text
|
|
|
|
|
Abstract
|
|
|
|
|
Cited |
|
|
|
|
| |
Shared |
|
|
|
|
| |
Discussed |
|
|
|
|