Performance-based assessment of gross primary production (GPP) products in a typical inland river basin of northwestern China
HU Jieyuan1,2, CHANG Xiaoge1, YANG Linshan1, NING Tingting1,*()
1State Key Laboratory of Ecological Safety and Sustainable Development in Arid Lands, Northwest Institute of Eco-Environment and Resources, Chinese Academy of Sciences, Lanzhou 730000, China 2University of Chinese Academy of Sciences, Beijing 101408, China
Accurate estimation of gross primary production (GPP) is crucial for understanding terrestrial carbon cycling, yet the regional performance of existing GPP products remains insufficiently quantified. This study evaluated four widely used GPP products, i.e., the Moderate Resolution Imaging Spectroradiometer (MODIS, e.g., MOD17), Global OCO-2-based Solar-Induced Chlorophyll Fluorescence (SIF) product (GOSIF), Global Land Surface Satellite (GLASS), and Penman-Monteith-Leuning Version 2 (PML_V2), across five representative ecosystems in the Heihe River Basin (HRB), northwestern China using 18 eddy covariance (EC) sites during 2007-2022. Multi-scale validation revealed pronounced spatial and ecosystem-dependent differences. Although all products captured the general basin-scale gradient, an analysis of the spatial coefficient of variation (CV) revealed distinct differences in their ability to resolve spatial heterogeneity: PML_V2 and GLASS reasonably captured the observed spatial variability, whereas MOD17 and GOSIF tended to smooth over fine-scale details. Furthermore, a systematic compression of the productivity gradient was evident across products, characterized by considerable underestimation in high-productivity ecosystems (forest land and cropland) and general overestimation in grassland. Temporally, all products performed more reliably in capturing seasonal dynamics than in reproducing inter-annual variations. At the growing season scale, GLASS and GOSIF achieved the highest explanatory power (r>0.95 at several sites), whereas MOD17 exhibited the lowest error (root mean square error (RMSE)=25.26 g C/m2 at the Jingyangling site (JYL)). However, inter-annual performance declined markedly, with MOD17 showing weak correlations (r<0.30) at most sites. Ecosystem-specific results identified GOSIF as superior for cropland and wetland ecosystems, while PML_V2 offered the best performance in grassland and desert ecosystems by minimizing systematic bias. Notably, all products consistently failed to establish meaningful correlations (r<0.21) with observations in desert areas due to the low ratios of signal to noise. Consequently, we recommend an ecosystem-dependent application strategy—specifically prioritizing GOSIF for cropland and wetland and PML_V2 for grassland—and urge extreme caution when applying single remote-sensing GPP products in arid desert areas.
Received: 19 December 2025
Published: 31 July 2026
Methodology, data curation, software, and writing - original draft preparation: HU Jieyuan; Data curation, resources, and writing - review and editing: CHANG Xiaoge; Writing - review and editing: YANG Linshan; Conceptualization, supervision, validation, and writing - review and editing: NING Tingting. All authors approved the manuscript.
HU Jieyuan, CHANG Xiaoge, YANG Linshan, NING Tingting. Performance-based assessment of gross primary production (GPP) products in a typical inland river basin of northwestern China. Journal of Arid Land, 2026, 18(7): 1115-1134.
Fig. 1Sampling site and land use type in the Heihe River Basin (HRB). HMo, Huangmo; NTi, Nongtian; SDQ, Sidaoqiao; LDi, Luodi; HYL, Huyanglin; HHL, Hunhelin; DSL, Dashalong; ZYW, Zhangye wetland; BJT, Bajitan; DMS, super Daman; YKe, Yingke; SSW, Shenshawo; HZZ, Huazhaizi; DDS, Dadongshu; ARS, super Arou; ARo, Arou; JYL, Jingyangling; GTa, Guantan.
No.
Name
Site_ID
Longitude
Latitude
Land use type
Dominant plant
Elevation (m)
Period
Stream
1
Jingyangling site
JYL
101°06′58″E
37°50′18″N
Alpine grassland
Kobresia pygmaea (C. B. Clarke) C. B. Clarke
3750
2018-2022
Up
2
Super Arou site
ARS
100°27′51″E
38°02′50″N
Alpine grassland
K. pygmaea
3033
2013-2022
Up
3
Dadongshu site
DDS
100°14′32″E
38°00′51″N
Alpine grassland
K. pygmaea
4148
2015-2022
Up
4
Dashalong site
DSL
98°56′26″E
38°50′24″N
Alpine marshland
K. pygmaea
3739
2013-2022
Up
5
Super Daman site
DMS
100°22′20″E
38°51′20″N
Cropland
Seed corn
1556
2012-2022
Middle
6
Zhangye wetland site
ZYW
100°26′47″E
38°58′30″N
Wetland
Reed
1460
2012-2022
Middle
7
Huazhaizi site
HZZ
100°19′07″E
38°45′55″N
Desert
Salsola passerina Bunge
1731
2012-2022
Middle
8
Sidaoqiao site
SDQ
101°08′15″E
42°00′04″N
Woodland
Tamarisk
873
2013-2022
Down
9
Hunhelin site
HHL
101°08′01″E
41°59′25″N
Woodland
Populus euphratica Olivier and Tamarix L.
874
2013-2022
Down
10
Huangmo site
HMo
100°59′14″E
42°06′49″N
Desert
Reaumuria L.
1054
2015-2022
Down
11
Arou site
ARo
100°27′53″E
38°02′39″N
Alpine grassland
K. pygmaea
3033
2008-2011
Up
12
Guantan site
GTa
100°15′00″E
38°32′00″N
Subalpine forest land
Picea crassifolia Kom.
2835
2010-2011
Up
13
Yingke site
YKe
100°24′37″E
38°51′26″N
Cropland
Seed corn
1519
2008-2011
Middle
14
Bajitan site
BJT
100°18′15″E
38°54′54″N
Gobi
-
1562
2012-2014
Middle
15
Shenshawo site
SSW
100°29′36″E
38°47′21″N
Desert
-
1594
2012-2015
Middle
16
Luodi site
LDi
101°07′57″E
41°59′57″N
Bare land
-
878
2013-2015
Down
17
Nongtian site
NTi
101°08′02″E
42°00′17″N
Cropland
Cucumis melo L.
875
2013-2015
Down
18
Huyanglin site
HYL
101°07′26″E
41°59′36″N
Woodland
P. euphratica
876
2013-2015
Down
Table 1 Site information from the eddy covariance (EC) flux stations in the Heihe River Basin (HRB)
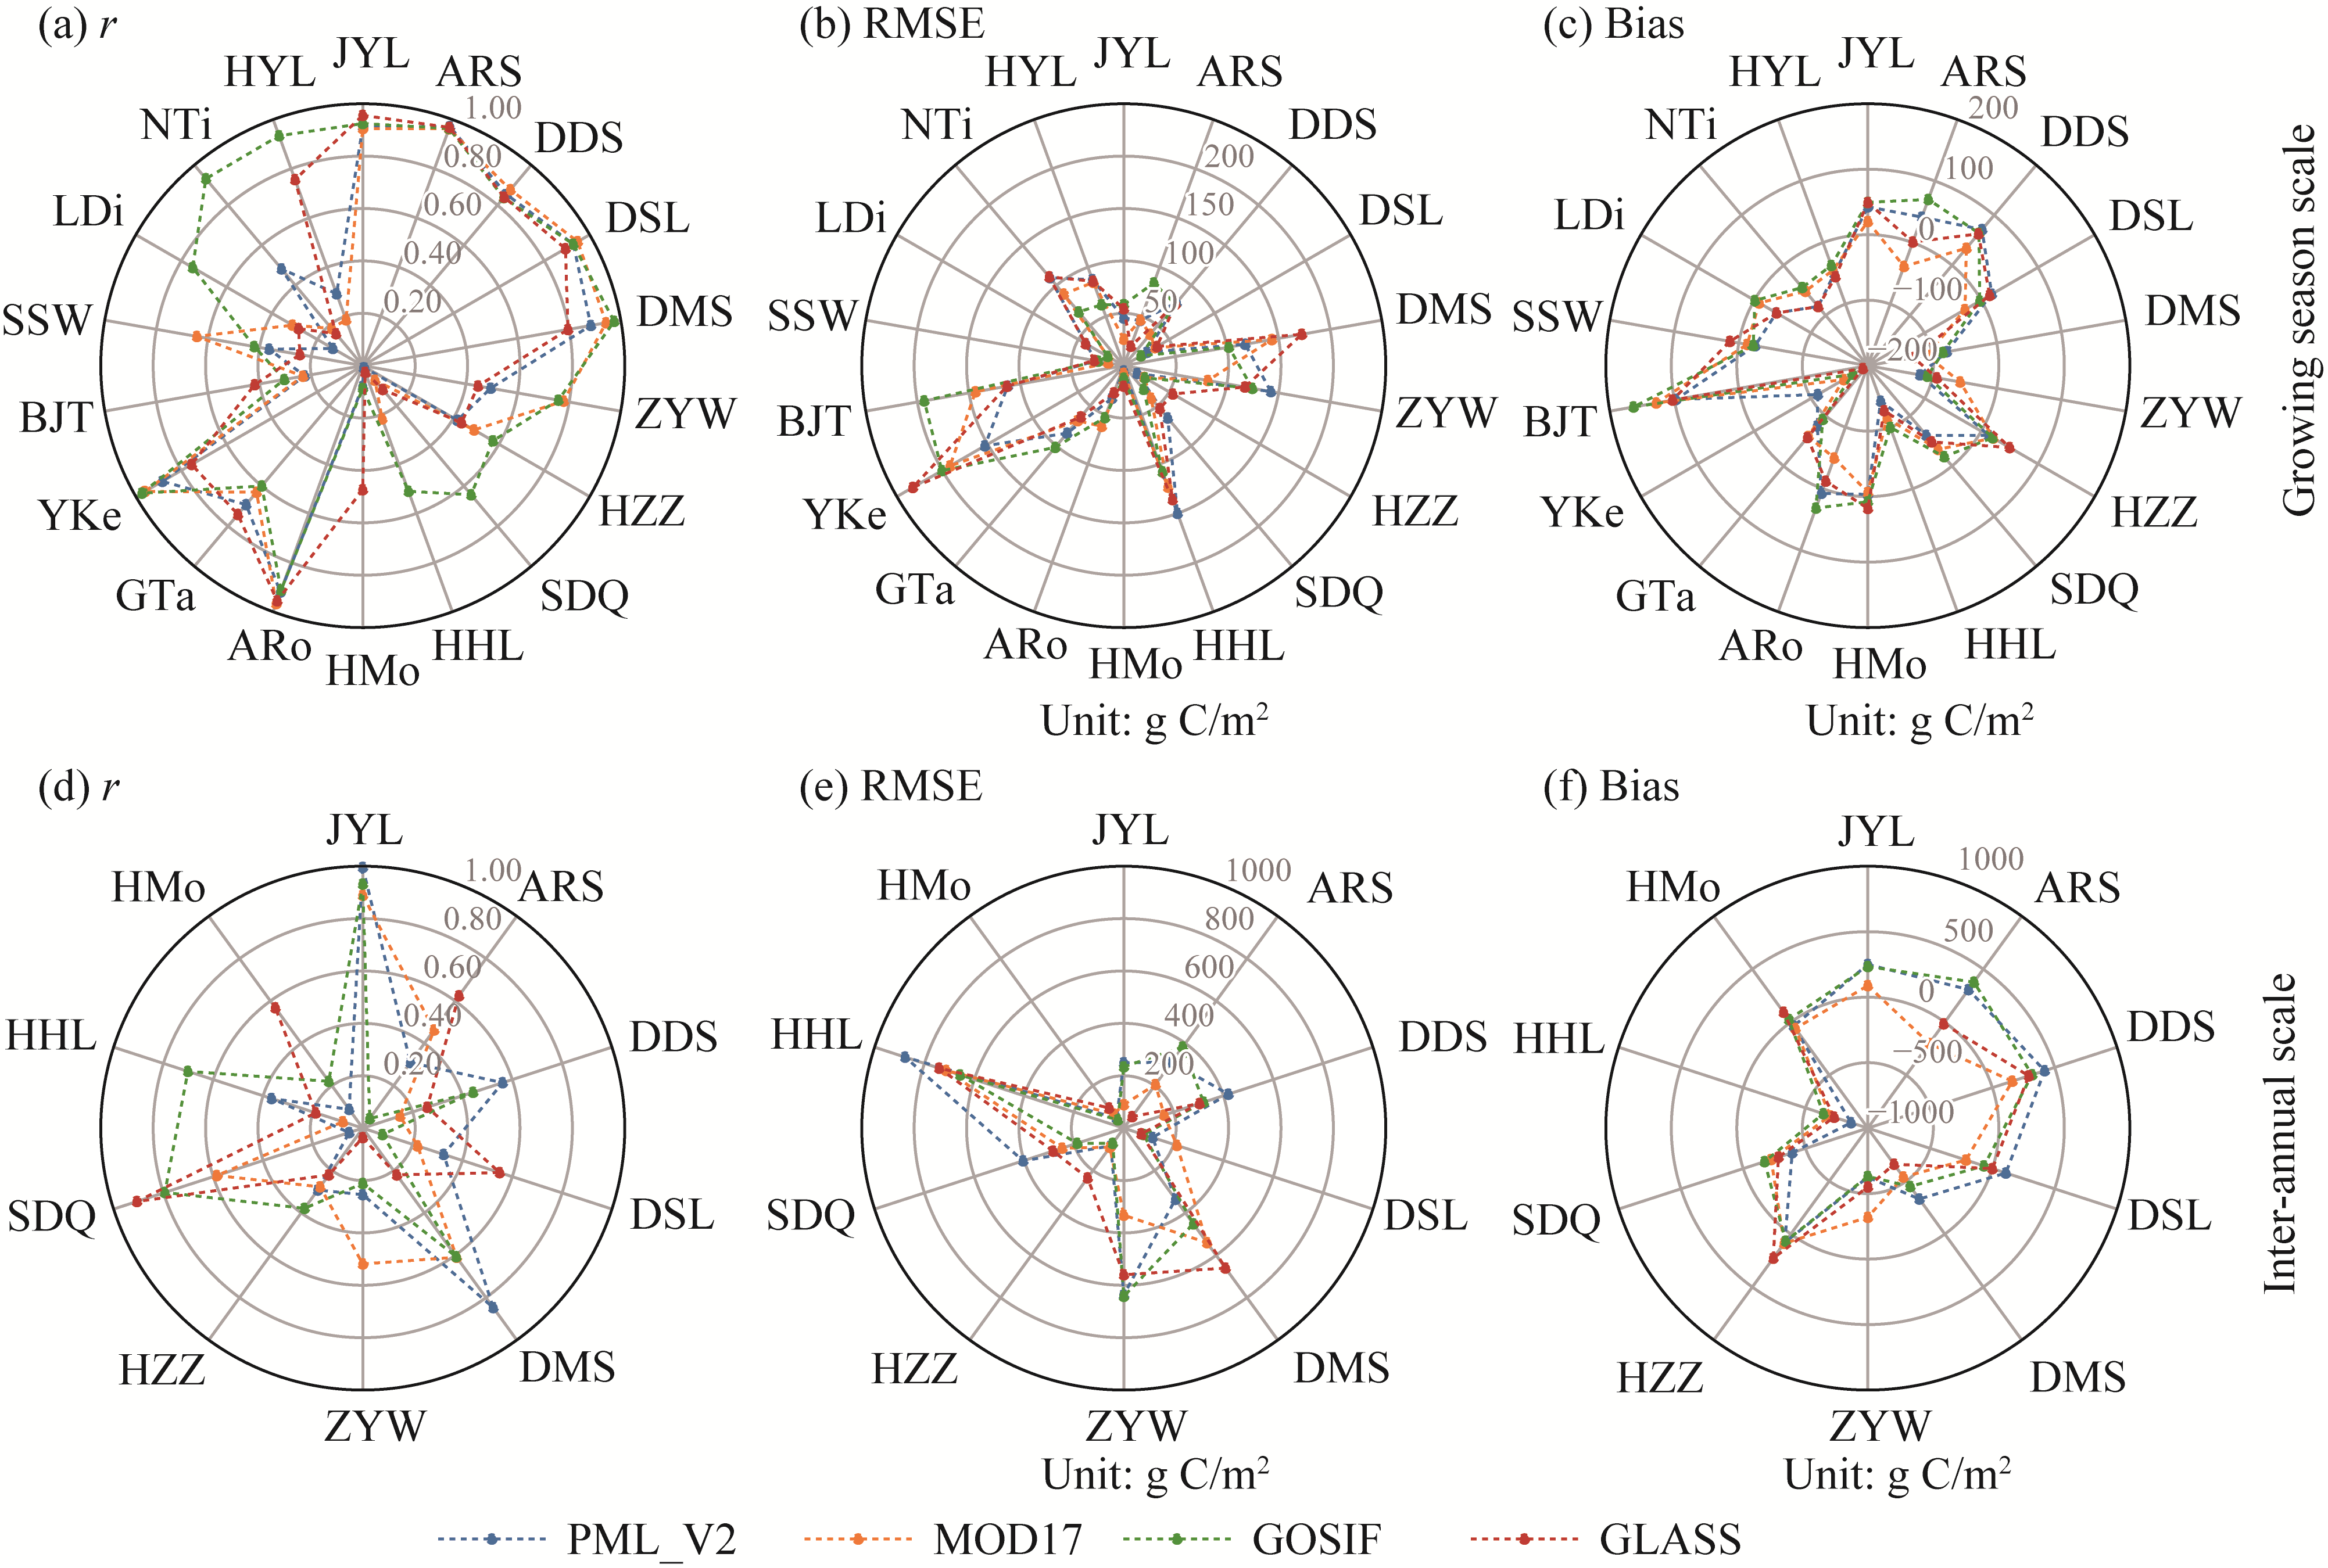
Fig. 2Statistical comparison between site-based observations and four gross primary production (GPP) products, i.e., Penman-Monteith-Leuning Version 2 (PML_V2), Moderate Resolution Imaging Spectroradiometer (MODIS, e.g., MOD17), GOSIF (Global OCO-2-based Solar-Induced Chlorophyll Fluorescence), and GLASS (Global Land Surface Satellite). (a-c), Pearson's correlation coefficient (r), root mean square error (RMSE), and bias at the growing season scale across the 18 sites, respectively; (d-f), r, RMSE, and bias at the inter-annual scale across the 11 sites with at least 5 a of continuous observations to ensure statistical robustness, respectively. The information of sampling sites is shown in Table 1.
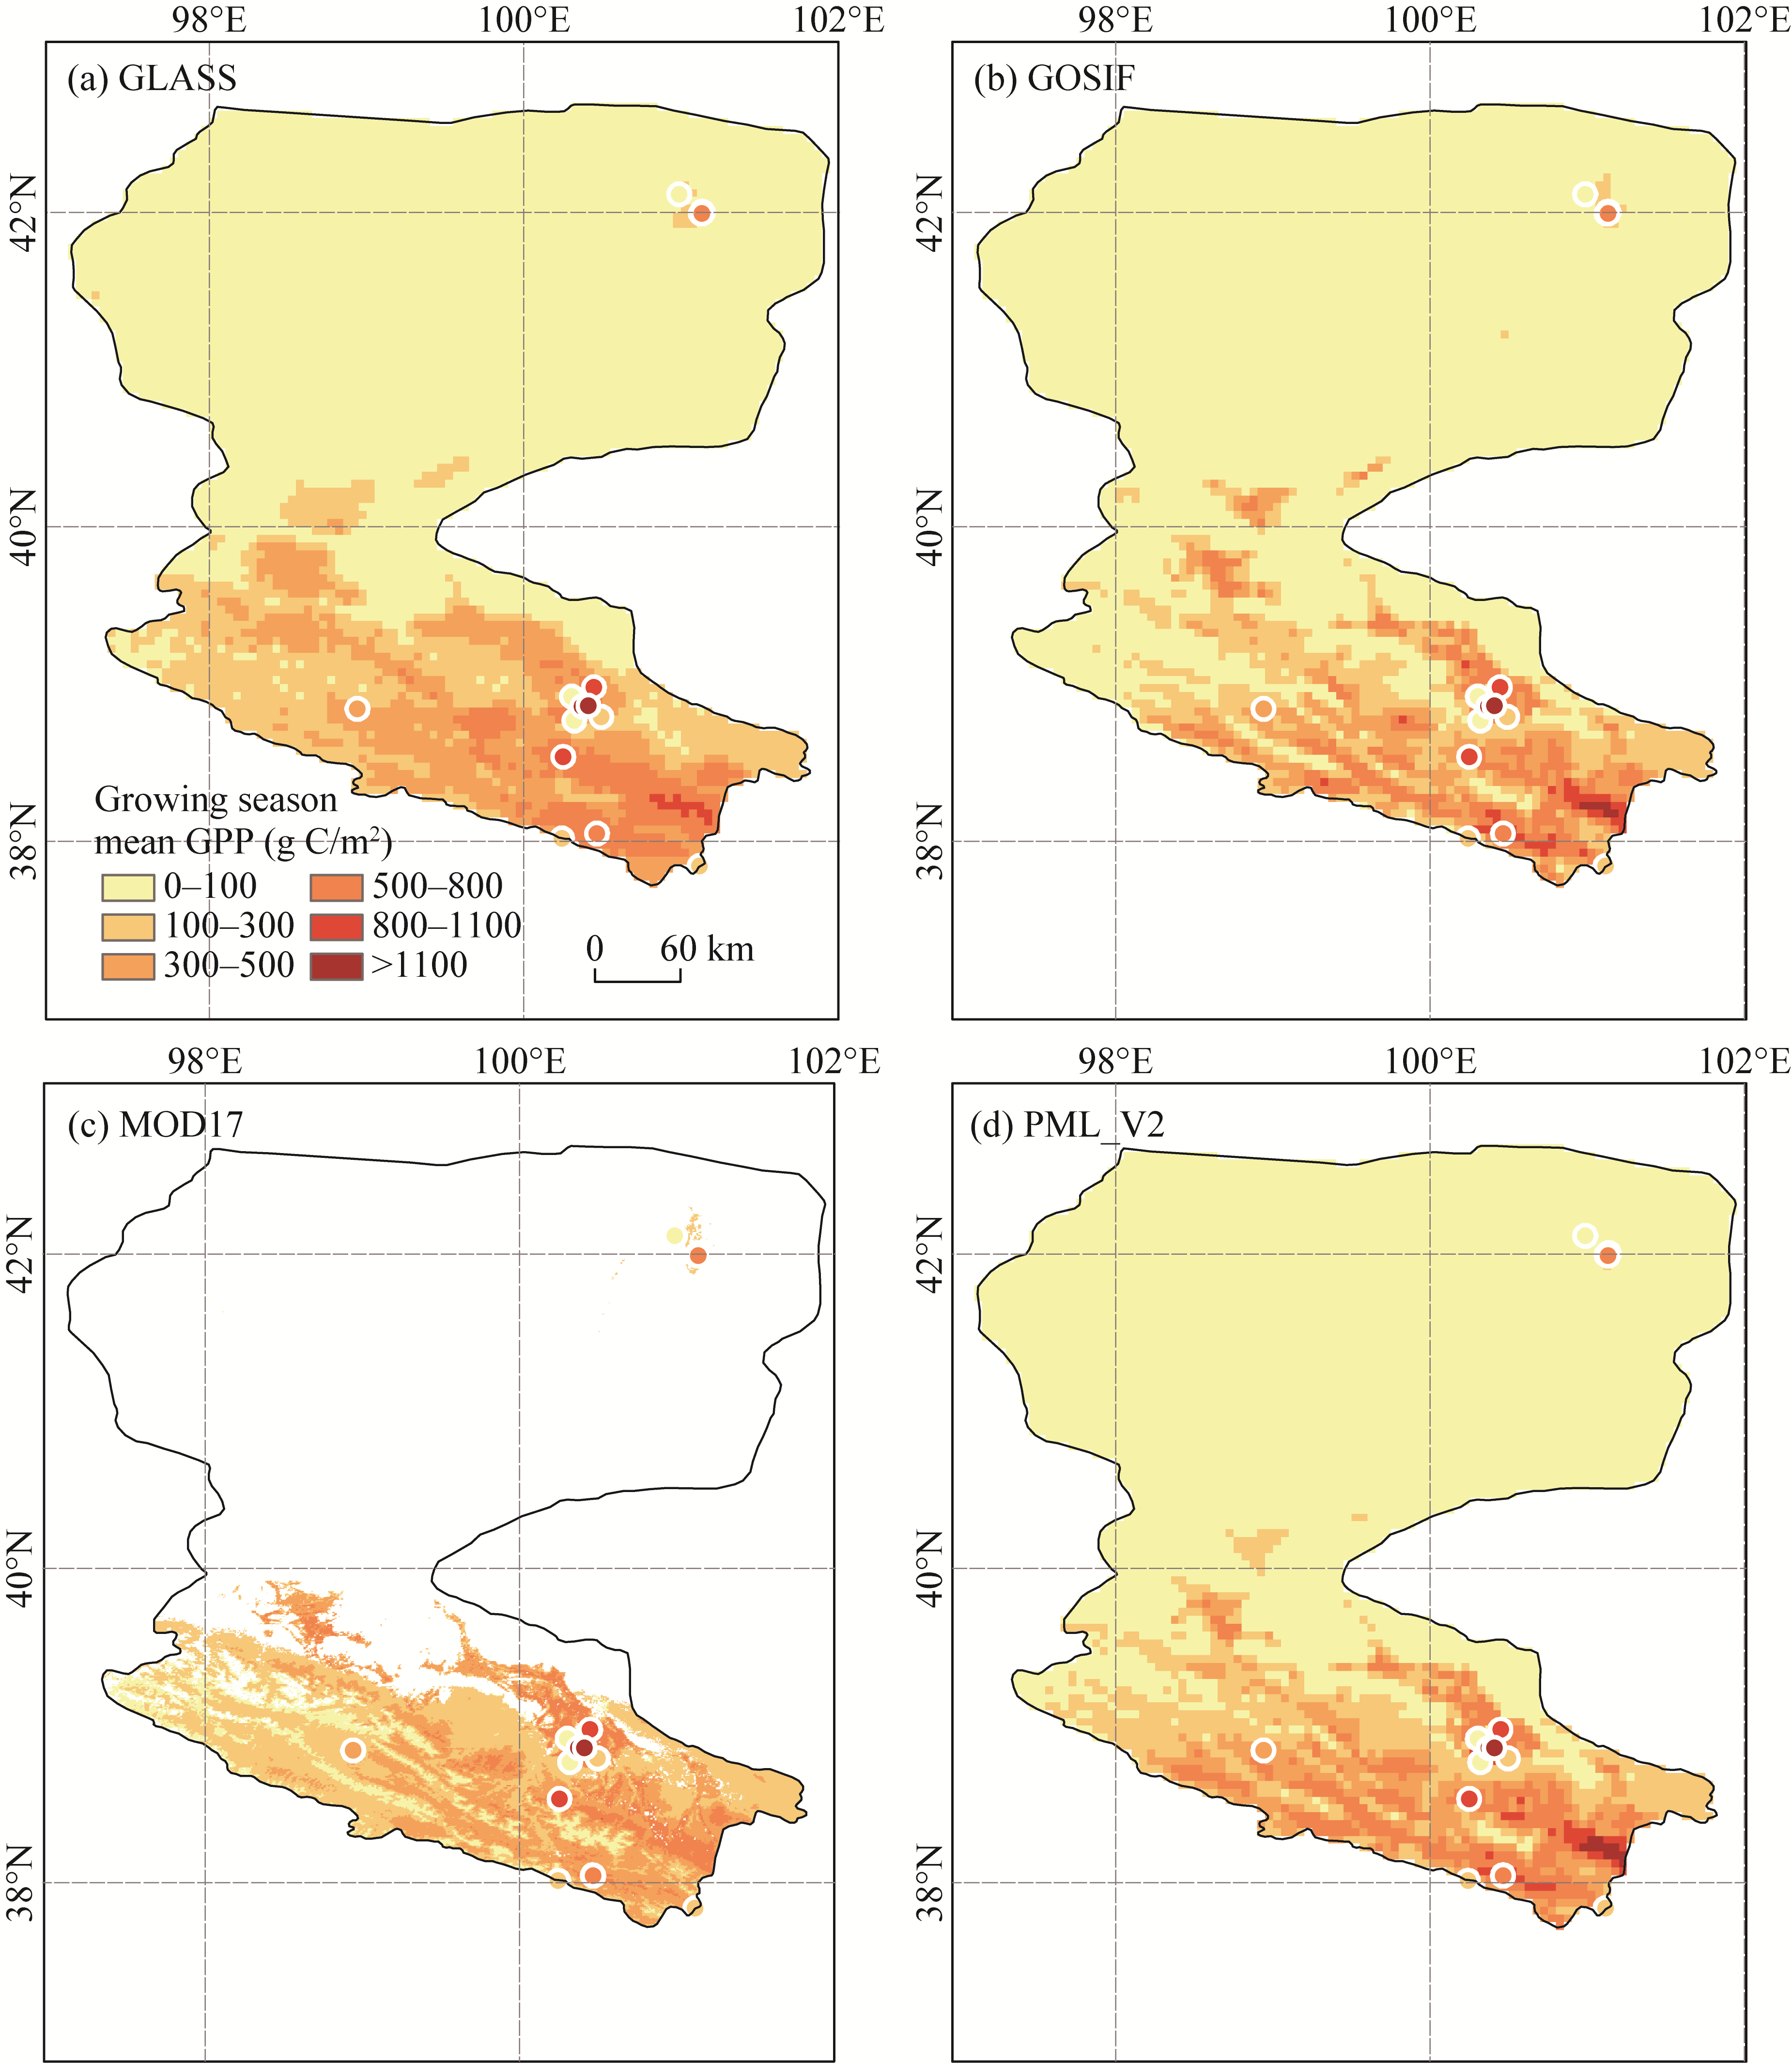
Fig. 3Spatial pattern of growing season mean GPP derived from the products (map color) and observations (point markers). (a), GLASS; (b), GOSIF; (c), MOD17; (d), PML_V2.
Fig. 4Spatial pattern of annual mean GPP derived from the products (map color) and observations (point markers). (a), GLASS; (b), GOSIF; (c), MOD17; (d), PML_V2.
Scale
Dataset
Mean GPP (g C/m2)
Standard deviation (g C/m2)
CV (%)
Growing season
Observed
517.23
423.31
82
MOD17
359.59
241.29
67
PML_V2
378.41
331.70
88
GOSIF
440.20
304.97
69
GLASS
272.38
225.42
83
Annual
Observed
605.25
450.45
74
MOD17
400.10
260.07
65
PML_V2
447.59
374.17
84
GOSIF
465.06
315.89
68
GLASS
294.01
230.60
78
Table 2 Coefficient of variation (CV) of observed and product-derived GPP at the growing season and annual scales in the HRB
Fig. 5Monthly time series of GPP derived from observations (Obs) and products for (a) grassland, (b) cropland, (c) forest land, (d) desert, and (e) wetland ecosystems
Fig. 6Scatter plots of observed and product-derived GPP across different ecosystems. (a1-a4), grassland; (b1-b4), wetland; (c1-c4), forest land; (d1-d4), desert; (e1-e4), cropland.
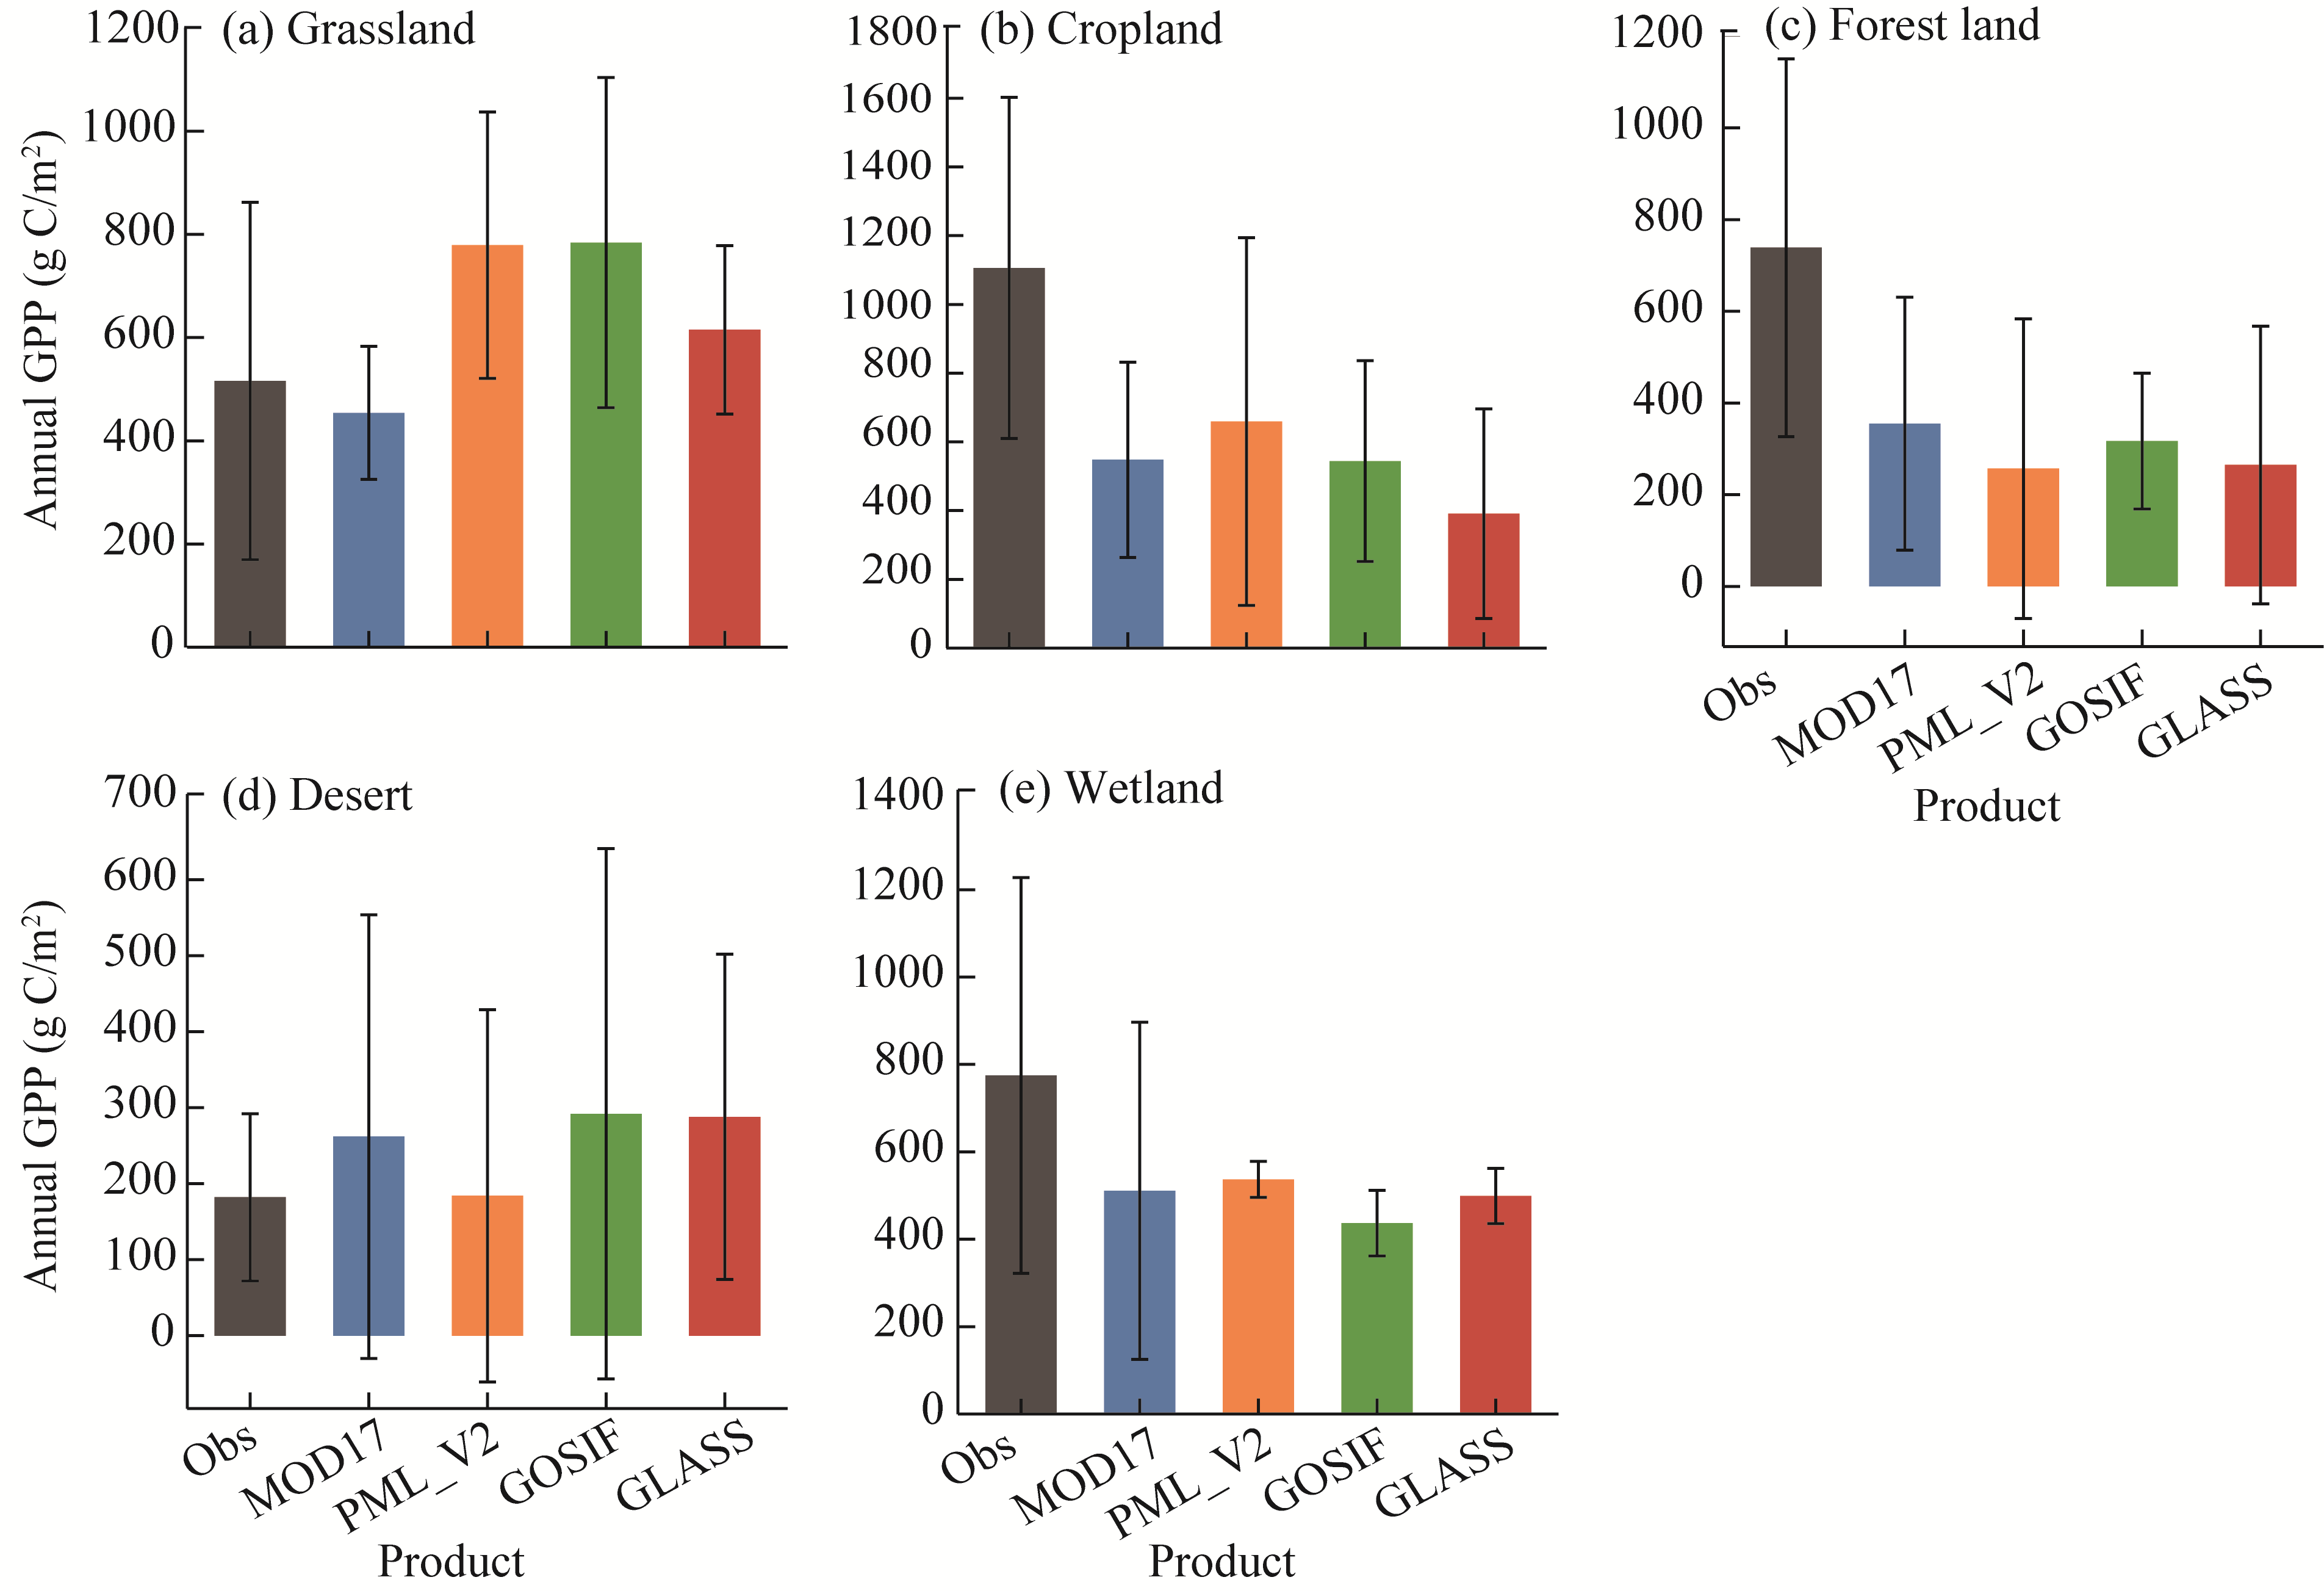
Fig. 7Multi-year annual mean GPP derived from observations (Obs) and products across different ecosystems. (a), grassland; (b), cropland; (c), forest land; (d), desert; (e), wetland. Bars represent standard deviation. Negative lower bounds occur mathematically due to high spatial variance, though actual GPP values are strictly non-negative.
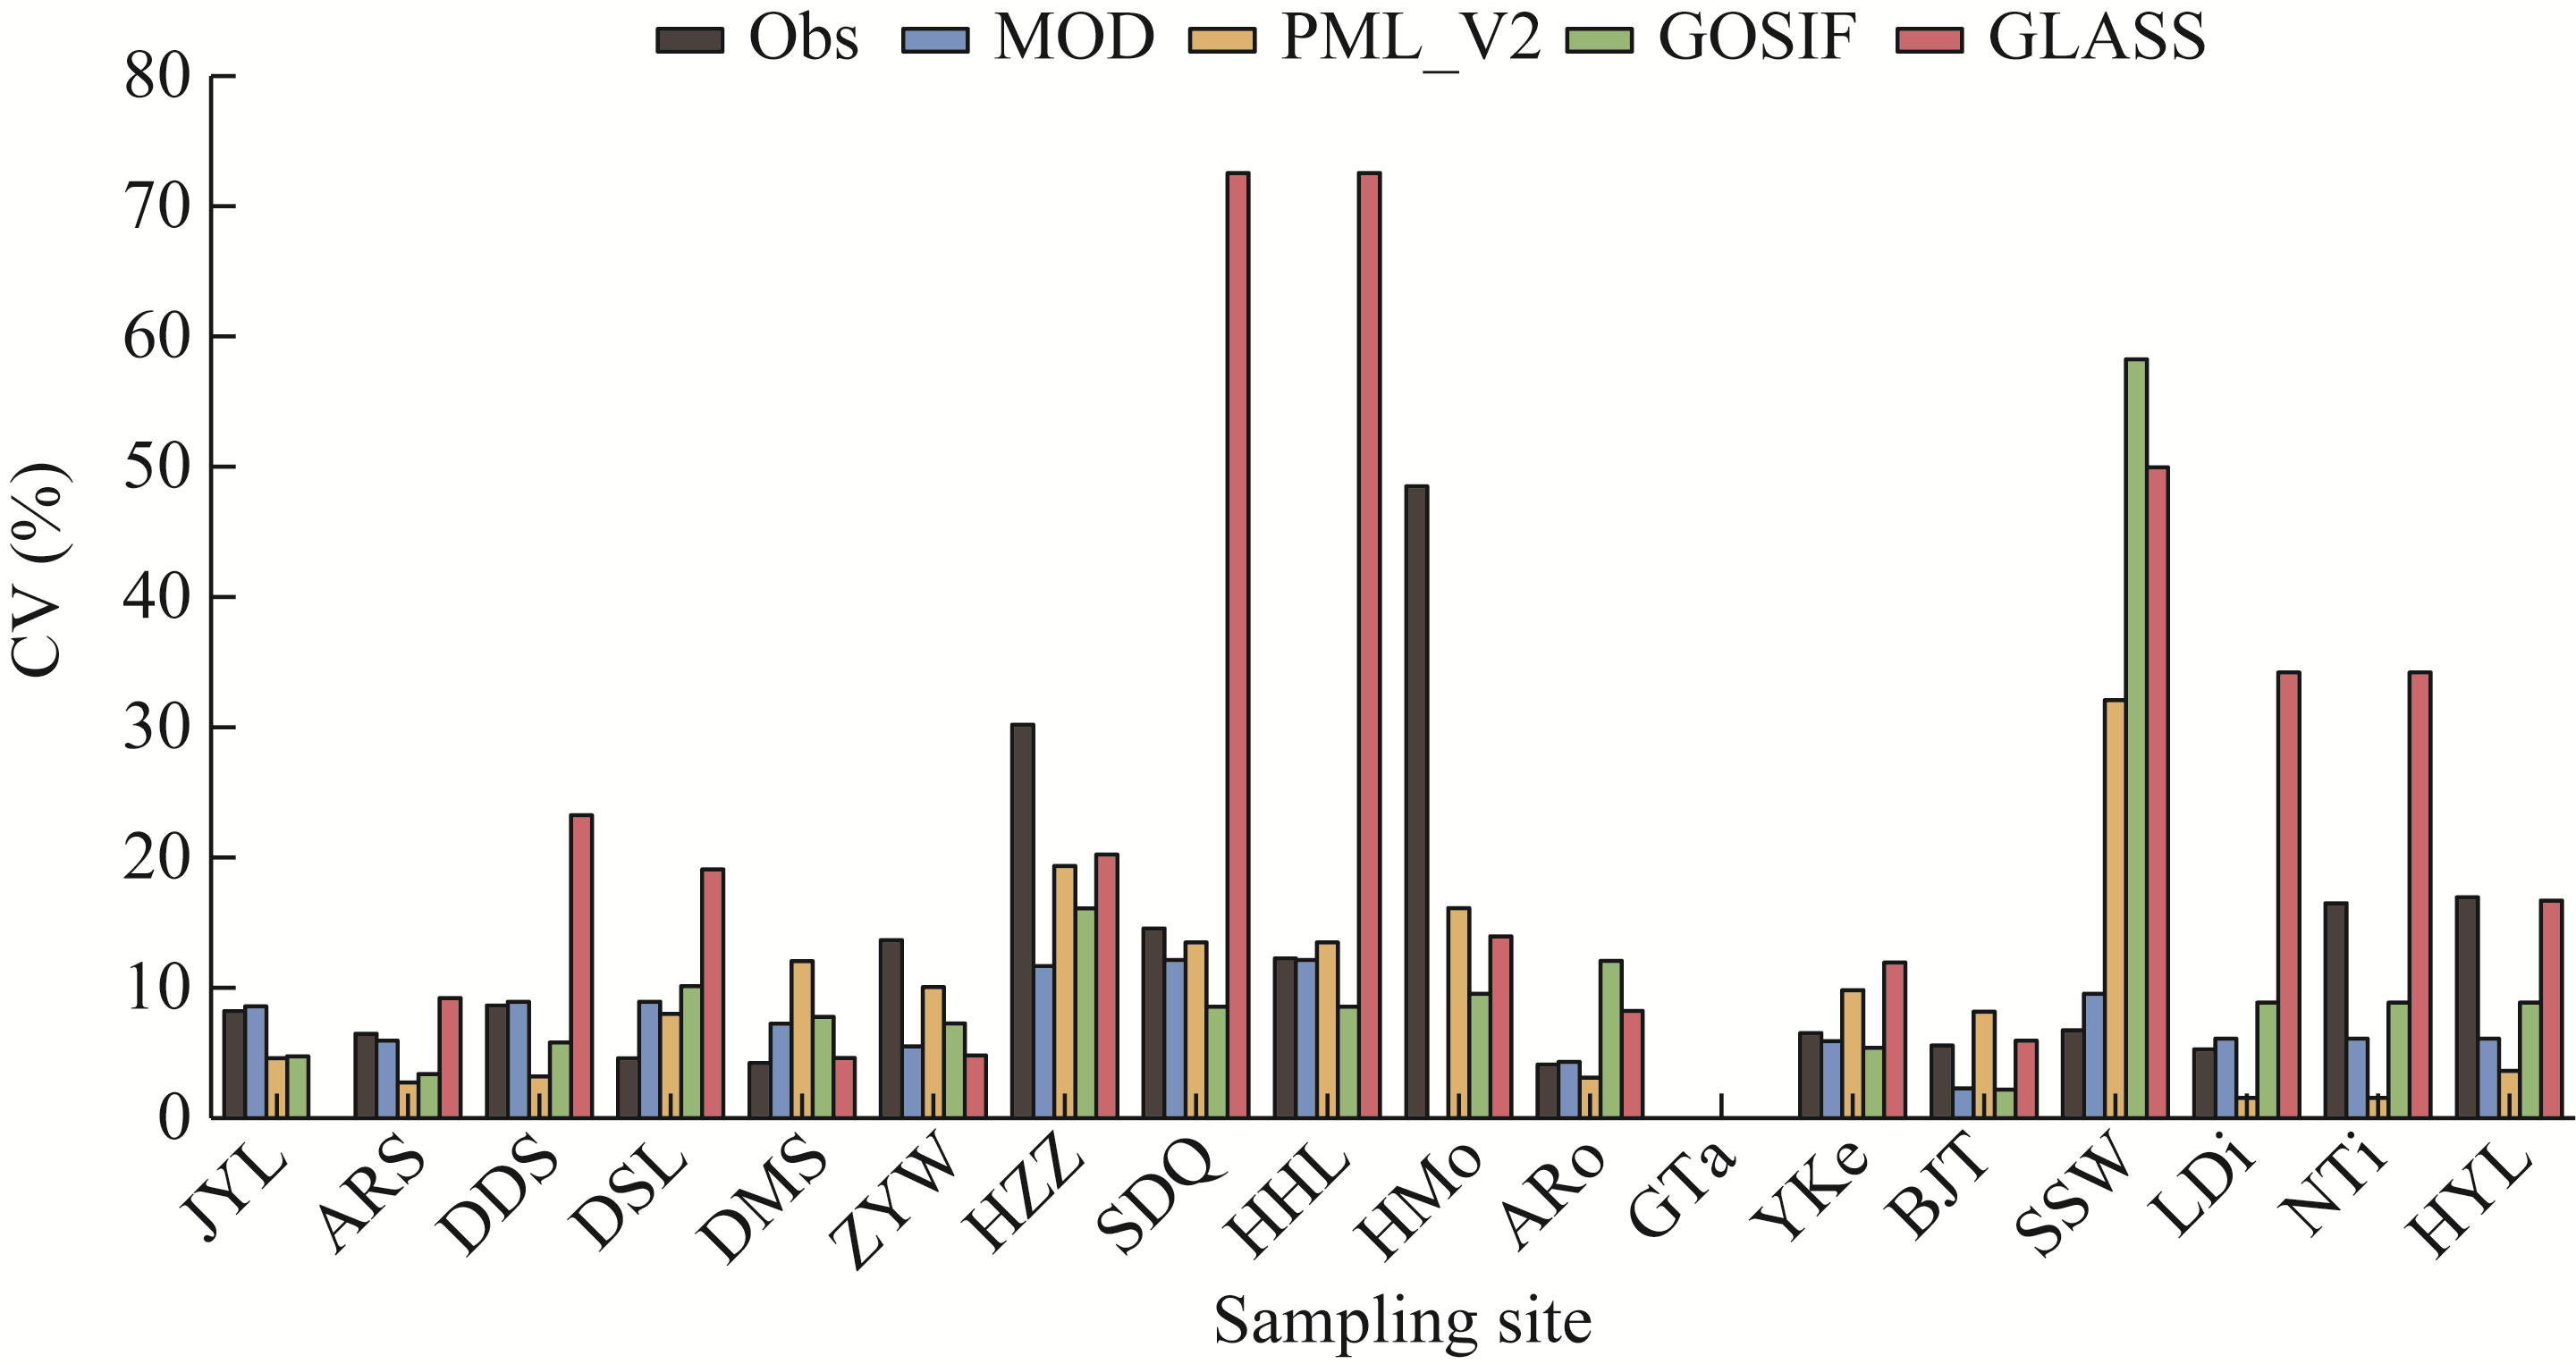
Fig. 8Comparison of inter-annual variability between observed and product-derived GPP across the 18 sites in the HRB. CV, coefficient of variation.
Fig. 9Response of product-derived GPP relative biases to inter-annual precipitation anomalies (Z-score) during 2007-2022 across the 18 sites in the HRB
[1]
Bai D C, Wang Y C, Ma Y M, et al. 2025. Fine-scale variations and driving factors of GPP derived from multi-source data fusion in the mountainous region of northwestern Hubei. Remote Sensing, 17(13): 2186, doi: 10.3390/rs17132186.
[2]
Bai J, Zhang H L, Sun R, et al. 2022. Estimation of global GPP from GOME-2 and OCO-2 SIF by considering the dynamic variations of GPP-SIF relationship. Agricultural and Forest Meteorology, 326: 109180, doi: 10.1016/j.agrformet.2022.109180.
[3]
Bai Y F, Ma L N, Degen A A, et al. 2020. Long-term active restoration of extremely degraded alpine grassland accelerated turnover and increased stability of soil carbon. Global Change Biology, 26(12): 7217-7228.
doi: 10.1111/gcb.v26.12
[4]
Cao D L, Huang X J, Liu G, et al. 2025. Evaluating the performance of satellite-derived vegetation indices in gross primary productivity (GPP) estimation at 30 m and 500 m spatial resolution. Remote Sensing, 17: 3291, doi: 10.3390/rs17193291.
[5]
Cracknell A P, Kanniah K D, Tan K P, et al. 2015. Towards the development of a regional version of MOD17 for the determination of gross and net primary productivity of oil palm trees. International Journal of Remote Sensing, 36(1): 262-289.
doi: 10.1080/01431161.2014.995278
[6]
Cui T X, Wang Y J, Sun R, et al. 2016. Estimating vegetation primary production in the Heihe River Basin of China with multi-source and multi-scale data. PLoS ONE, 11(4): e0153971, doi: 10.1371/journal.pone.0153971.
[7]
Dashti H, Pandit K, Glenn N F, et al. 2021. Performance of the ecosystem demography model (EDv2.2) in simulating gross primary production capacity and activity in a dryland study area. Agricultural and Forest Meteorology, 297: 108270, doi: 10.1016/j.agrformet.2020.108270.
[8]
Gelybó G, Barcza Z, Kern A, et al. 2013. Effect of spatial heterogeneity on the validation of remote sensing based GPP estimations. Agricultural and Forest Meteorology, 174-175: 43-53.
doi: 10.1016/j.agrformet.2013.02.003
[9]
Hou X, Zhang B, Chen J, et al. 2024. Response of vegetation productivity to greening and drought in the Loess Plateau based on VIs and SIF. Forests, 15(2): 339, doi: 10.3390/f15030339.
[10]
Huang X J, Zheng Y, Zhang H, et al. 2022. High spatial resolution vegetation gross primary production product: Algorithm and validation. Science of Remote Sensing, 5: 100049, doi: 10.1016/j.srs.2022.100049.
[11]
Jiang C Y, Ryu Y. 2016. Multi-scale evaluation of global gross primary productivity and evapotranspiration products derived from Breathing Earth System Simulator (BESS). Remote Sensing of Environment, 186: 528-547.
doi: 10.1016/j.rse.2016.08.030
[12]
Jung M, Reichstein M, Margolis H A, et al. 2011. Global patterns of land-atmosphere fluxes of carbon dioxide, latent heat, and sensible heat derived from eddy covariance, satellite, and meteorological observations. Journal of Geophysical Research: Biogeosciences, 116(G3): G00J07, doi: 10.1029/2010JG001566.
[13]
Jung M, Schwalm C, Migliavacca M, et al. 2020. Scaling carbon fluxes from eddy covariance sites to globe: Synthesis and evaluation of the FLUXCOM approach. Biogeosciences, 17(5): 1343-1365.
doi: 10.5194/bg-17-1343-2020
[14]
Li J, Cui Y P, Liu J Y, et al. 2013a. Estimation and analysis of net primary productivity by integrating MODIS remote sensing data with a light use efficiency model. Ecological Modelling, 252: 3-10.
doi: 10.1016/j.ecolmodel.2012.11.026
[15]
Li X, Cheng G D, Liu S M, et al. 2013b. Heihe watershed allied telemetry experimental research (HiWATER): Scientific objectives and experimental design. Bulletin of the American Meteorological Society, 94(8): 1145-1160.
doi: 10.1175/BAMS-D-12-00154.1
[16]
Li X, Xiao J F. 2019. Mapping photosynthesis solely from solar-induced chlorophyll fluorescence: A global, fine-resolution dataset of gross primary production derived from OCO-2. Remote Sensing, 11(21): 2563, doi: 10.3390/rs11212563.
[17]
Li Y Y, Guan X B, Shen H F. 2025. Optimal parameter schemes for global and regional gross primary productivity estimation: A comparative analysis. Geo-spatial Information Science, 28(1): 65-84.
doi: 10.1080/10095020.2024.2416658
[18]
Li Y Z, Zhang Y, Lv J. 2022. Interannual variations in GPP in forest ecosystems in Southwest China and regional differences in the climatic contributions. Ecological Informatics, 69: 101591, doi: 10.1016/j.ecoinf.2022.101591.
[19]
Liang S L, Zhao X, Liu S H, et al. 2013. A long-term global land surface satellite (GLASS) data-set for environmental studies. International Journal of Digital Earth, 6(S1): 5-33.
doi: 10.1080/17538947.2013.805262
[20]
Lin S R, Huang X J, Wang C Q, et al. 2024a. A 30-m gross primary production dataset from 2016 to 2020 in China. Scientific Data, 11: 1065, doi: 10.1038/s41597-024-01065-0.
[21]
Lin Y, Chen Z, Yu G R, et al. 2024b. Spatial patterns of light response parameters and their regulation on gross primary productivity in China. Agricultural and Forest Meteorology, 345: 109833, doi: 10.1016/j.agrformet.2024.109833.
[22]
Liu H H, Liu Y, Chen Y, et al. 2023. Dynamics of global dryland vegetation were more sensitive to soil moisture: Evidence from multiple vegetation indices. Agricultural and Forest Meteorology, 331: 109327, doi: 10.1016/j.agrformet.2023.109327.
[23]
Liu L Y, Guan L L, Liu X J. 2017. Directly estimating diurnal changes in GPP for C3 and C4 crops using far-red sun-induced chlorophyll fluorescence. Agricultural and Forest Meteorology, 232: 1-9.
doi: 10.1016/j.agrformet.2016.06.014
[24]
Lloyd J, Taylor J A. 1994. On the temperature dependence of soil respiration. Functional Ecology, 8(3): 315-323.
doi: 10.2307/2389824
[25]
Ma Y M, Guan X B, Chen J M, et al. 2024. Improving MODIS gross primary productivity by bridging big-leaf and two-leaf light use efficiency models. Journal of Geophysical Research: Biogeosciences, 129(5): e2023JG007737, doi: 10.1029/2023JG007737.
[26]
Ma Z H, Wu B F, Yan N N, et al. 2021. Coupling water and carbon processes to estimate field-scale maize evapotranspiration with Sentinel-2 data. Agricultural and Forest Meteorology, 306: 108421, doi: 10.1016/j.agrformet.2021.108421.
[27]
Mauder M, Cuntz M, Drüe C, et al. 2013. A strategy for quality and uncertainty assessment of long-term eddy-covariance measurements. Agricultural and Forest Meteorology, 169: 122-135.
doi: 10.1016/j.agrformet.2012.09.006
[28]
Pandey V, Harde S, Rajasekaran E, et al. 2024. Gross primary productivity of terrestrial ecosystems: A review of observations, remote sensing, and modelling studies over South Asia. Theoretical and Applied Climatology, 155: 8461-8491.
doi: 10.1007/s00704-024-05158-4
[29]
Pei Y Y, Dong J W, Zhang Y, et al. 2020. Performance of four state-of-the-art GPP products (VPM, MOD17, BESS and PML) for grasslands in drought years. Ecological Informatics, 56: 101052, doi: 10.1016/j.ecoinf.2020.101052.
[30]
Peng X B, Lu X L, Cai H J, et al. 2025. The potential of SIF, NDVI·PAR, and NIRv·PAR in estimating winter wheat GPP across multi-temporal scales. European Journal of Agronomy, 170: 127777, doi: 10.1016/j.eja.2025.127777.
[31]
Qiu R A, Han G, Li S W, et al. 2023. Soil moisture dominates the variation of gross primary productivity during hot drought in drylands. Science of The Total Environment, 899: 165686, doi: 10.1016/j.scitotenv.2023.165686.
[32]
Reich E, Guo J, Peltier D, et al. 2025. Precipitation pulse dynamics are not ubiquitous: A global meta-analysis of plant and ecosystem carbon- and water-related pulse responses. Global Change Biology, 31(7): e70327, doi: 10.1111/gcb.70327.
[33]
Rodell M, Houser P, Jambor U, et al. 2004. The global land data assimilation system. Bulletin of the American Meteorological Society, 85: 381-394.
doi: 10.1175/BAMS-85-3-381
[34]
Running S W, Nemani R R, Heinsch F, et al. 2004. A continuous satellite-derived measure of global terrestrial primary production. Bioscience, 54(6): 547-560.
doi: 10.1641/0006-3568(2004)054[0547:ACSMOG]2.0.CO;2
[35]
Running S W, Zhao M S. 2015. Daily GPP and annual NPP (MOD17A2/A3) products NASA Earth Observing System MODIS land algorithm. In: MOD17 User's Guide. Missoula: University of Montana. [2025-08-26].https://modis-land.gsfc.nasa.gov/pdf/MOD17UsersGuide2015v3.pdf.
[36]
Shao W, Wu C C, Yue T X, et al. 2025. Prediction of gross primary productivity change in Central Asia under climate change using deep learning. IEEE Journal of Selected Topics in Applied Earth Observations and Remote Sensing, 18: 11031-11046.
doi: 10.1109/JSTARS.2025.3556678
[37]
Tang X G, Li H P, Huang N, et al. 2015. A comprehensive assessment of MODIS-derived GPP for forest ecosystems using the site-level FLUXNET database. Environmental Earth Sciences, 74: 5907-5918.
[38]
Tao J B, Mishra D R, Cotten D L, et al. 2018. A comparison between the MODIS product (MOD17A2) and a tide-robust empirical GPP model evaluated in a Georgia wetland. Remote Sensing, 10(11): 1831, doi: 10.3390/rs10111831.
[39]
Wang L C, Zhu H J, Lin A W, et al. 2017. Evaluation of the latest MODIS GPP products across multiple biomes using global eddy covariance flux data. Remote Sensing, 9(5): 418, doi: 10.3390/rs9050418.
[40]
Wang T X, Sun S K, Yin Y L, et al. 2024. Status of crop water use efficiency evaluation methods: A review. Agricultural and Forest Meteorology, 349: 109961, doi: 10.1016/j.agrformet.2024.109961.
[41]
Wang X F, Ma M G, Huang G H, et al. 2012. Vegetation primary production estimation at maize and alpine meadow over the Heihe River Basin, China. International Journal of Applied Earth Observation and Geoinformation, 17: 94-101.
doi: 10.1016/j.jag.2011.09.009
[42]
Wang X F, Cheng G D, Li X, et al. 2015. An algorithm for gross primary production (GPP) and net ecosystem production (NEP) estimations in the midstream of the Heihe River Basin, China. Remote Sensing, 7(4): 3651-3669.
doi: 10.3390/rs70403651
[43]
Wang X F, Che T, Xiao J F, et al. 2025a. A post-processed carbon flux dataset for 34 eddy covariance flux sites across the Heihe River Basin, China. Earth System Science Data, 17(4): 1329-1346.
doi: 10.5194/essd-17-1329-2025
[44]
Wang Y, She X J, Zhu C J, et al. 2025b. Unveiling the accuracy of global GPP products in data-scarce mountain ecosystems of southwest China. International Journal of Applied Earth Observation and Geoinformation, 144: 104908, doi: 10.1016/j.jag.2025.104908.
[45]
Wu H, Li Z L. 2009. Scale issues in remote sensing: A review on analysis, processing and modeling. Sensors, 9(3): 1768-1793.
doi: 10.3390/s90301768
pmid: 22573986
[46]
Xiao X M, Doughty R, Wu X C, et al. 2019. Spatial-temporal dynamics of global terrestrial gross primary production during 2000-2018: An update on vegetation photosynthesis model and it simulations with Terra/MODIS images. In: AGU (American Geophysical Union) Fall Meeting Abstracts. San Francisco: AUG, 2019AGUFMGC11K1116X.
[47]
Xiao X M, Hollinger D, Aber J, et al. 2004. Satellite-based modeling of gross primary production in an evergreen needle leaf forest. Remote Sensing of Environment, 89(4): 519-534.
doi: 10.1016/j.rse.2003.11.008
[48]
Yu T, Zhang Q, Sun R. 2021. Spatial representativeness of gross primary productivity from carbon flux sites in the Heihe River Basin, China. Remote Sensing, 13(24): 5016, doi: 10.3390/rs13245016.
[49]
Yu T, Jiapaer G, Bao A M, et al. 2025. Soil moisture dominates gross primary productivity variation during severe droughts in Central Asia. Ecological Informatics, 86: 103076, doi: 10.1016/j.ecoinf.2025.103076.
[50]
Zhang J, Wang X F, Ren J. 2021. Simulation of gross primary productivity using multiple light use efficiency models. Land, 10(3): 329, doi: 10.3390/land10030329.
[51]
Zhang L X, Zhou D C, Fan J W, et al. 2019a. Contrasting the performance of eight satellite-based GPP models in water-limited and temperature-limited grassland ecosystems. Remote Sensing, 11(11): 1333, doi: 10.3390/rs11111333.
[52]
Zhang P P, Liu H Q, Li H Z, et al. 2023a. Using enhanced vegetation index and land surface temperature to reconstruct the solar-induced chlorophyll fluorescence of forests and grasslands across latitude and phenology. Frontiers in Forests and Global Change, 6: 1257287, doi: 10.3389/ffgc.2023.1257287.
[53]
Zhang S, Bai Y, Zhang J H, et al. 2024. Intercomparison of gross primary productivity in spatio-temporal distribution over a typical tropical region based on different datasets. Environmental Science and Pollution Research, 31(50): 60650-60667.
doi: 10.1007/s11356-024-35267-6
[54]
Zhang W Q, Luo G P, Hamdi R, et al. 2023b. Can gross primary productivity products be effectively evaluated in regions with few observation data? GIScience & Remote Sensing, 60(1): 2213489, doi: 10.1080/15481603.2023.2213489.
[55]
Zhang Y Q, Kong D D, Gan R, et al. 2019b. Coupled estimation of 500 m and 8-day resolution global evapotranspiration and gross primary production in 2002-2017. Remote Sensing of Environment, 222: 165-182.
doi: 10.1016/j.rse.2018.12.031
[56]
Zhao A Z, Xu R H, Zou L D, et al. 2023. Response of grassland vegetation growth to drought in Inner Mongolia of China from 2002 to 2020. Atmosphere, 14(11): 1613, doi: 10.3390/atmos14111613.
[57]
Zhao S X, Zhang M M, Wu Y J, et al. 2025. Response of gross primary productivity (GPP) of the desert steppe ecosystem in the northern foothills of Yinshan Mountain to extreme climate. Land, 14(4): 884, doi: 10.3390/land14040884.
[58]
Zheng Y, Shen R Q, Wang Y W, et al. 2020. Improved estimate of global gross primary production for reproducing its long-term variation, 1982-2017. Earth System Science Data, 12(4): 2725-2746.
doi: 10.5194/essd-12-2725-2020
[59]
Zheng Z T, Cong N, Zhao G, et al. 2024. Evident influence of water availability on the relationship between solar-induced chlorophyll fluorescence and gross primary productivity in the alpine grasslands of the Tibetan Plateau. International Journal of Applied Earth Observation and Geoinformation, 129: 103821, doi: 10.1016/j.jag.2024.103821.
[60]
Zhu S Y, Olde L, Lewis K, et al. 2023a. Eddy covariance fluxes over managed ecosystems extrapolated to field scales at fine spatial resolutions. Agricultural and Forest Meteorology, 342: 109675, doi: 10.1016/j.agrformet.2023.109675.
[61]
Zhu W Q, Zhao C L, Xie Z Y. 2023b. An end-to-end satellite-based GPP estimation model devoid of meteorological and land cover data. Agricultural and Forest Meteorology, 331: 109337, doi: 10.1016/j.agrformet.2023.109337.