| Research article |
|


|
|
|
| Climate change impacts on the streamflow of Zarrineh River, Iran |
Farhad YAZDANDOOST*( ), Sogol MORADIAN ), Sogol MORADIAN |
| Department of Civil Engineering, K. N. Toosi University of Technology, Tehran 19697, Iran |
|
|
|
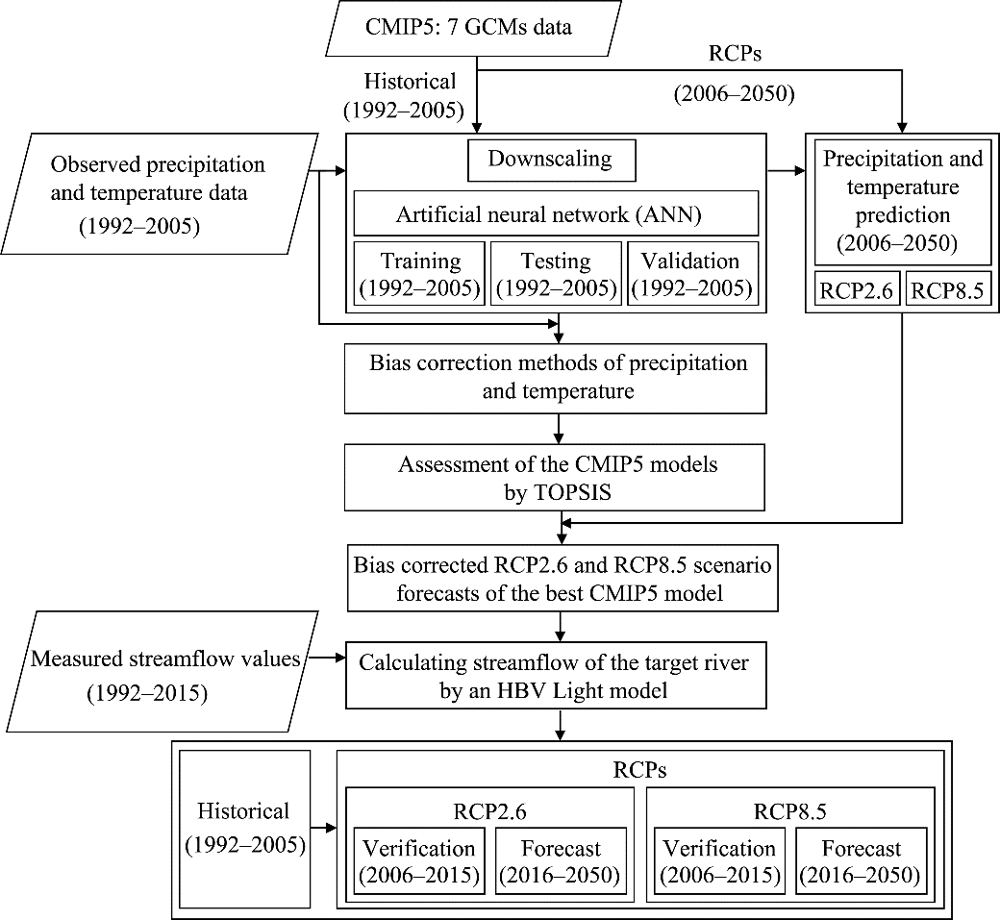
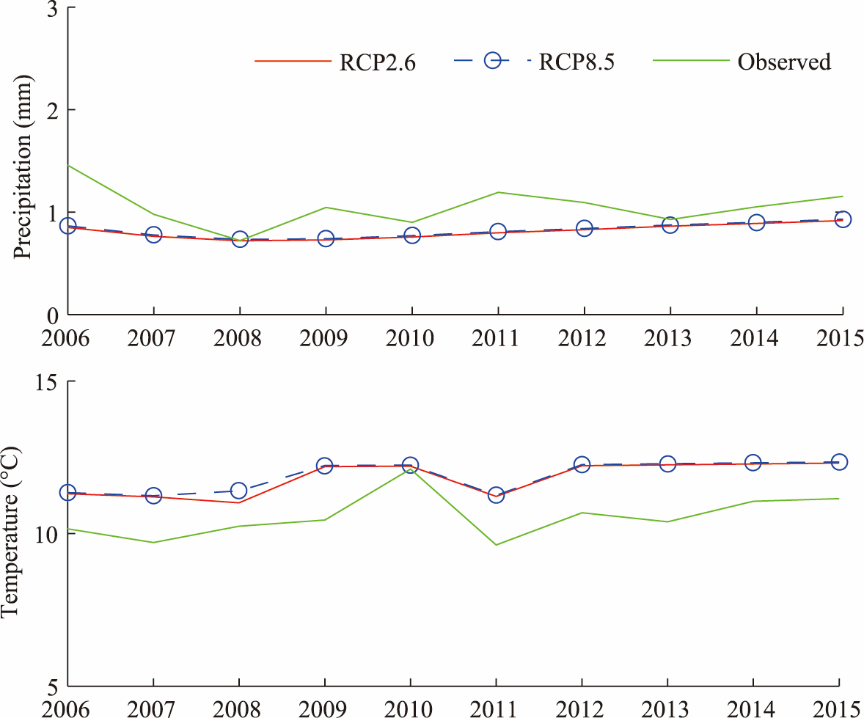
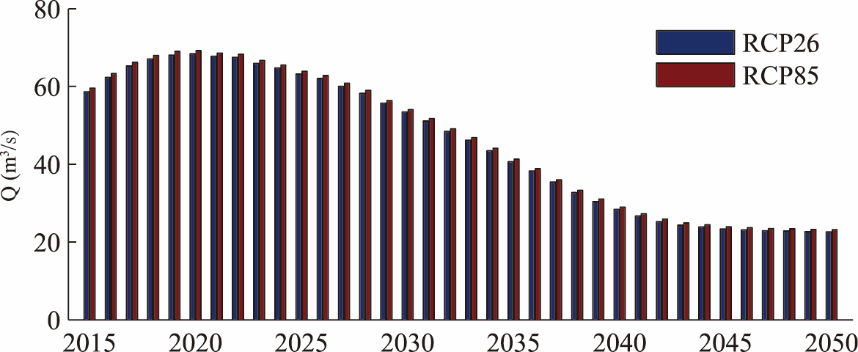
Abstract Zarrineh River is located in the northwest of Iran, providing more than 40% of the total inflow into the Lake Urmia that is one of the largest saltwater lakes on the earth. Lake Urmia is a highly endangered ecosystem on the brink of desiccation. This paper studied the impacts of climate change on the streamflow of Zarrineh River. The streamflow was simulated and projected for the period 1992-2050 through seven CMIP5 (coupled model intercomparison project phase 5) data series (namely, BCC-CSM1-1, BNU-ESM, CSIRO-Mk3-6-0, GFDL-ESM2G, IPSL-CM5A-LR, MIROC-ESM and MIROC-ESM-CHEM) under RCP2.6 (RCP, representative concentration pathways) and RCP8.5. The model data series were statistically downscaled and bias corrected using an artificial neural network (ANN) technique and a Gamma based quantile mapping bias correction method. The best model (CSIRO-Mk3-6-0) was chosen by the TOPSIS (technique for order of preference by similarity to ideal solution) method from seven CMIP5 models based on statistical indices. For simulation of streamflow, a rainfall-runoff model, the hydrologiska byrans vattenavdelning (HBV-Light) model, was utilized. Results on hydro-climatological changes in Zarrineh River basin showed that the mean daily precipitation is expected to decrease from 0.94 and 0.96 mm in 2015 to 0.65 and 0.68 mm in 2050 under RCP2.6 and RCP8.5, respectively. In the case of temperature, the numbers change from 12.33°C and 12.37°C in 2015 to 14.28°C and 14.32°C in 2050. Corresponding to these climate scenarios, this study projected a decrease of the annual streamflow of Zarrineh River by half from 2015 to 2050 as the results of climatic changes will lead to a decrease in the annual streamflow of Zarrineh River from 59.49 m3/s in 2015 to 22.61 and 23.19 m3/s in 2050. The finding is of important meaning for water resources planning purposes, management programs and strategies of the Lake's endangered ecosystem.
|
|
Received: 19 January 2021
Published: 10 September 2021
|
|
Corresponding Authors:
*Farhad YAZDANDOOST (E-mail: yazdandoost@kntu.ac.ir)
|
|
|
| [1] |
Abbaspour M, Nazaridoust A. 2007. Determination of environmental water requirements of Lake Urmia, Iran: an ecological approach. International Journal of Environmental Studies, 64(2):161-169.
doi: 10.1080/00207230701238416
|
|
|
| [2] |
Ahmadaali J, Barani G, Qaderi K, et al. 2018. Analysis of the effects of water management strategies and climate change on the environmental and agricultural sustainability of Urmia Lake basin, Iran. Water, 10(2):1-21.
doi: 10.3390/w10020001
|
|
|
| [3] |
Ahmadi A, Abbaspour M, Arjmandi R, et al. 2016. Resilient approach toward urban development in lake catchments, case of Lake Urmia. Scientia Iranica, 23(4):1627-1632
doi: 10.24200/sci.2016.2233
|
|
|
| [4] |
Ahmadzadeh K T, Pejman A, Mahin A E, et al. 2011. Evaluation of salt effects on some thermodynamic properties of Urmia Lake water. International Journal of Environmental Research, 5(2):343-348.
|
|
|
| [5] |
Alborzi A, Mirchi A, Moftakhari H, et al. 2018. Climate-informed environmental inflows to revive a drying lake facing meteorological and anthropogenic droughts. Environmental Research letters, 13(8):084010, doi: 10.1088/1748-9326/aad246.
doi: 10.1088/1748-9326/aad246
|
|
|
| [6] |
Anderson J W P, Storniolo R E, Rice J S. 2011. Bank thermal storage as a sink of temperature surges in urbanized streams. Journal of Hydrology, 409(1-2):525-537.
doi: 10.1016/j.jhydrol.2011.08.059
|
|
|
| [7] |
Bozkurt D, Rojas M, Boisier J P, et al. 2018. Projected hydroclimate changes over Andean basins in Central Chile from downsca led CMIP5 models under the low and high emission scenarios. Climatic Change, 150:131-147.
doi: 10.1007/s10584-018-2246-7
|
|
|
| [8] |
Cai L, Alexeev V A, Walsh J E, et al. 2018. Patterns, impacts, and future projections of summer variability in the Arctic from CMIP5 models. Journal of Climate, 31(24):9815-9833.
doi: 10.1175/JCLI-D-18-0119.1
|
|
|
| [9] |
Campozano L, Tenelanda D, Sanchez E, et al. 2015. Comparison of statistical downscaling methods for monthly total precipitation: Case study for the paute river basin in southern Ecuador. Advances in Meteorology, Special Issue: 6526341, doi: 10.1155/2016/6526341.
doi: 10.1155/2016/6526341
|
|
|
| [10] |
Chadwick R, Coppola E, Giorgi F. 2011. An artificial neural network technique for downscaling GCM outputs to RCM spatial scale. Nonlinear Processes in Geophysics, 18:1013-1028.
doi: 10.5194/npg-18-1013-2011
|
|
|
| [11] |
Coulibaly P, Dibike Y B, Anctil F. 2005. Downscaling precipitation and temperature with temporal neural networks. Journal of Hydrometeorology, 6(4):483-496.
doi: 10.1175/JHM409.1
|
|
|
| [12] |
Cramer H. 1999. Mathematical Methods of Statistics (9th ed.). Princeton: Princeton University Press, 208-232, 310- 316, 557-559.
|
|
|
| [13] |
Delju A, Ceylan A, Piguet E, et al. 2013. Observed climate variability and change in Urmia Lake Basin, Iran. Theoretical and Applied Climatology, 111:285-296.
doi: 10.1007/s00704-012-0651-9
|
|
|
| [14] |
Do Hoai N, Udo K, Mano A. 2011. Downscaling global weather forecast outputs using ANN for flood prediction. Journal of Applied Mathematics, Special Issue: 246286, doi: 10.1155/2011/246286.
doi: 10.1155/2011/246286
|
|
|
| [15] |
Fang G, Yang J H, Chen Y N, et al. 2015. Comparing bias correction methods in downscaling meteorological variables for a hydrologic impact study in an arid area in China. Hydrology and Earth System Sciences, 19:2547-2559.
doi: 10.5194/hess-19-2547-2015
|
|
|
| [16] |
Fowler H J, Ekström M, Blenkinsop S, et al. 2007. Estimating change in extreme European precipitation using a multimodel ensemble. Journal of Geophysical Research, 112(D18):104, doi: 10.1029/2007JD008619.
doi: 10.1029/2007JD008619
|
|
|
| [17] |
García-Cascales M S, Lamata T M. 2012. On rank reversal and TOPSIS method. Journal of Mathematical and Computer Modelling, 56(5-6):123-132.
doi: 10.1016/j.mcm.2011.12.022
|
|
|
| [18] |
Ghale Y, Altunkaynak A, Unal A. 2018. Investigation anthropogenic impacts and climate factors on drying up of Urmia Lake using water budget and drought analysis. Water Resources Management, 32:325-337.
doi: 10.1007/s11269-017-1812-5
|
|
|
| [19] |
Gholampour A, Nabizadeh R, Hassanvand M S, et al. 2015. Characterization of saline dust emission resulted from Urmia Lake drying. Journal of Environmental Health Science and Engineering, 13:82, doi: 10.1186/s40201-015-0238-3.
doi: 10.1186/s40201-015-0238-3
pmid: 26617986
|
|
|
| [20] |
Gondim R, Silveira C, Souza F, et al. 2018. Climate change impacts on water demand and availability using CMIP5 models in the Jaguaribe basin, semi-arid Brazil. Environmental Earth Sciences, 77:550, doi: 10.1007/s12665-018-7723-9.
doi: 10.1007/s12665-018-7723-9
|
|
|
| [21] |
Hung N Q, Babel M S, Weesakul S, et al. 2009. An artificial neural network model for rainfall forecasting in Bangkok, Thailand. Hydrology and Earth System Sciences, 13(8):1413-1425.
doi: 10.5194/hess-13-1413-2009
|
|
|
| [22] |
IPCC (Intergovernmental Panel on Climate Change). 2013. Climate change 2013:The physical science basis, contribution of working group I to the fifth assessment report of the intergovernmental panel on climate change. Cambridge: Cambridge University Press, 75, 109,113.
|
|
|
| [23] |
Jena P, Azad S, Nair Rajeevan M. 2015. Statistical selection of the optimum models in the cmip5 dataset for climate change projections of indian monsoon rainfall. Climate, 3(4):858-875.
doi: 10.3390/cli3040858
|
|
|
| [24] |
Khalili M, Nguyen V T, Gachon P. 2013. A statistical approach to multi-site multivariate downscaling of daily extreme temperature series. International Journal of Climatology, 33(1):15-32.
doi: 10.1002/joc.3402
|
|
|
| [25] |
Khan N, Shahid S, Ahmed K, et al. 2018. Performance assessment of general circulation model in simulating daily precipitation and temperature using multiple gridded datasets. Water, 10(12):1793, doi: 10.3390/w10121793.
doi: 10.3390/w10121793
|
|
|
| [26] |
Lippmann R P. 1987. An introduction to computing with neural nets. IEEE ASSP Magazine, 4(2):4-22.
|
|
|
| [27] |
Liu T, Willems P, Pan X L, et al. 2011. Climate change impact on water resource extremes in a headwater region of the Tarim basin in China, Hydrology and Earth System Sciences, 15:3511-3527.
doi: 10.5194/hess-15-3511-2011
|
|
|
| [28] |
Liu Z, Xu Z, Huang J, et al. 2010. Impacts of climate change on hydrological processes in the headwater catchment of the Tarim River basin, China. Hydrological Processes, 24(2):196-208.
|
|
|
| [29] |
Maraun D, Wetterhall F, Ireson A M, et al. 2010. Precipitation downscaling under climate change: recent developments to bridge the gap between dynamical models and the end user. Reviews of Geophysics, 48(3): RG3003, doi: 10.1029/2009RG000314.
doi: 10.1029/2009RG000314
|
|
|
| [30] |
McSweeney C F, Jones R G, Lee R W, et al. 2015. Selecting CMIP5 GCMs for downscaling over multiple regions. Climate Dynamics, 44(11-12):3237-3260.
doi: 10.1007/s00382-014-2418-8
|
|
|
| [31] |
Mendes D, Marengo J A. 2010. Temporal downscaling: a comparison between artificial neural network and autocorrelation techniques over the Amazon Basin in present and future climate change scenarios. Theoretical and Applied Climatology, 100(3):413-421.
doi: 10.1007/s00704-009-0193-y
|
|
|
| [32] |
Nikbakht J, Tabari H, Talaee P H. 2013. Streamflow drought severity analysis by percent of normal index (PNI) in Northwest Iran. Theoretical and Applied Climatology, 112:565-573.
doi: 10.1007/s00704-012-0750-7
|
|
|
| [33] |
Patil N S, Laddimath R, Pooja S, et al. 2015. Downscaling of precipitation data from GCM outputs using artificial neural network for Bhima basin. International Journal of Applied Environmental, 10(4):1493-1508.
|
|
|
| [34] |
Piani C, Haerter J, Coppola E. 2010. Statistical bias correction for daily precipitation in regional climate models over Europe. Theoretical and Applied Climatology, 99:187-192.
doi: 10.1007/s00704-009-0134-9
|
|
|
| [35] |
Skamarock W C, Klemp J B, Dudhia J. 2008. A Description of the Advanced Research WRF Version 3. In: NCAR Technical Note TN-475+STR. Colorado, USA.
|
|
|
| [36] |
Teutschbein C, Seibert J. 2012. Bias correction of regional climate model simulations for hydrological climate-change impact studies: Review and evaluation of different methods. Journal of Hydrology, 456-457:12-29.
|
|
|
| [37] |
Themebl M J, Gobiet A, Heinrich G. 2012. Empirical-statistical downscaling and error correction of regional climate models and its impact on the climate change signal. Climatic Change, 112:449-468.
doi: 10.1007/s10584-011-0224-4
|
|
|
| [38] |
Thom H C. 1958. A note on the gamma distribution. Monthly Weather Review, 86(4):117-122.
doi: 10.1175/1520-0493(1958)086<0117:ANOTGD>2.0.CO;2
|
|
|
| [39] |
Torabi Haghighi A, Klove B. 2017. Design of environmental flow regimes to maintain lakes and wetlands in regions with high seasonal irrigation demand. Ecological Engineering, 100:120-129.
doi: 10.1016/j.ecoleng.2016.12.015
|
|
|
| [40] |
Tran Anh Q, Taniguchi K. 2018. Coupling dynamical and statistical downscaling for high-resolution rainfall forecasting: case study of the Red River Delta, Vietnam. Progress in Earth and Planetary Science, 5:28, doi: 10.1186/s40645-018-0185-6.
doi: 10.1186/s40645-018-0185-6
|
|
|
| [41] |
Tue Vu M, Aribarg T, Supratid S, et al. 2016. Statistical downscaling rainfall using artificial neural network: significantly wetter Bangkok? Theoretical and Applied Climatology, 126(3-4):453-467.
doi: 10.1007/s00704-015-1580-1
|
|
|
| [42] |
Wilby R L, Charles S P, Zorita E, et al. 2014. Guidelines for Use of Climate Scenarios Developed from Statistical Downscaling Methods. Supporting Material of the Intergovernmental Panel on Climate Change. http://www.ipcc-data.org/guidelines/dgm_no2_v1_09_2004.pdf.
|
|
|
| [43] |
Yazdandoost F, Moradian S, Izadi A. 2020. Evaluation of water sustainability under a changing climate in Zarrineh River Basin, Iran. Water Resources Management, 34(15):4831-4846.
doi: 10.1007/s11269-020-02693-3
|
|
|
| [44] |
Yazdandoost F, Moradian S, Izadi A, et al. 2021. Evaluation of CMIP6 precipitation simulations across different climatic zones: Uncertainty and model intercomparison. Journal of Atmospheric Research, 250:105369, doi: 10.1016/j.atmosres.2020.105369.
doi: 10.1016/j.atmosres.2020.105369
|
|
|
|
Viewed |
|
|
|
Full text
|
|
|
|
|
Abstract
|
|
|
|
|
Cited |
|
|
|
|
| |
Shared |
|
|
|
|
| |
Discussed |
|
|
|
|